

Abstract
Optical tire sensors are powerful engineering tools that can reveal the mechanisms behind tire-road interactions. This paper presents a laser-based sensor system to measure tire-tread block deformation. The methodology and corresponding procedure for the system are introduced. Practical issues, such as tire sensor localization, are discussed. Validation experiments were conducted on a chassis dynamometer, and an asymmetric tire tread deformation along the contact patch was observed. It is proposed that asymmetric tread deformation is due to rolling resistance. The measurements under different operational conditions, including the rolling direction, wheel load, rolling velocity, and inflation pressure, were analyzed in the context of rolling resistance.
Export citation and abstract BibTeX RIS
1. Introduction
Significant improvements in tire sensors have been achieved over the past decade, allowing valuable information to be extracted from tire deformations. This provides deeper insight into physics within the tire-road interactions, such as friction [1–3], aquaplaning [4], and rolling resistance, which are extremely important for vehicle safety [5], handling, and fuel consumption. Tires are a composite product, made up of various materials and complex structures. The deformation of each part has a unique effect on tire performance. Therefore, various tire sensors have been developed to measure deformations and forces on specific tire parts, such as the following:
- Sidewall deformation measurement [6, 7];
- Tread deformation measurement [8];
- Footprint contact pressure measurement [9];
- Footprint length measurement [10].
The tread is the only part of the tire that comes into contact with the ground and, therefore, has a significant impact on the performance of the tire, such as traction, abrasion, and rolling resistance. To attain better grip performance, highly viscoelastic rubber compounds are commonly used for tread blocks [11]; however, these compounds exhibit high hysteretic losses due to periodical deformations caused by traveling over the ground. Figure 1 presents curve I, which represents the scenario in which tread elements are in the leading half, and curve II, which corresponds to the situation in which tread elements are located in the trailing half. At the same strain, the stress is larger in the loading process than in the unloading process. In other words, the distributed stress in the leading half is larger than in the trailing half, which results in an equivalent force in the leading half. This force generates a moment that resists the tire's forward movement, which accounts for 15%–18% of the total vehicle fuel consumption [12]. Despite this significant effect, the rolling resistance phenomenon is not sufficiently understood. Thus, to exploit the full potential of a tire to improve performance in terms of fuel consumption and CO2 emissions, a detailed understanding of the tread deformation during rolling within the contact patch is essential for elucidating the mechanism behind rolling resistance.
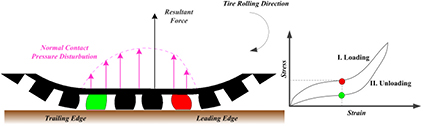
Figure 1. (left) Side view of the tire-road contact pressure distribution in the vertical direction, and (right) a rubber compound stress-strain curve. The tread block within the leading half (red) is in the loading state. The tread block within the trailing half (green) is in the unloading state.
Download figure:
Standard image High-resolution imageAlthough the aforementioned tire sensors can measure a wide range of tire deformations and forces, only a few sensors can measure tread deformation. Moreover, several previous attempts, such as in [8, 13], only measured the partial deformation of the tread element between a sandwich sensor structure. However, the time history of the complete tread block deformation is required to study tire-road interactions, particularly for rolling resistance. Thus, a tire sensor system to measure tire-tread deformation must be developed.
As a non-contact and non-destructive test method, optical sensing is an ideal method of measuring tire deformation. Compared with other tire sensor systems, such as piezoelectric films [9] and strain gauges [14], the optical tire sensor has advantages in terms of repeatability and sampling frequency. Moreover, the sensors' high durability and robustness also allow for operation in harsh environments and at normal driving speeds. The previously developed optical tire sensor systems have demonstrated their feasibility and superiority in tire-vibration analysis [15], tire-force estimation [16], and aquaplaning investigations [17].
The primary contribution of this work lies in the development of a laser-based tire-sensor system that measures tread deformation. The tread deformation is measured using two laser triangulation sensors and by accurately measuring the rotation angle of the wheel. In the context of rolling resistance, the deformations under different operational conditions are analyzed. Several important practical issues that arose during the system development, such as tire-sensor localization and signal processing, are discussed. To the best of our knowledge, this is the first sensor system developed that can measure the tread deformation of a rolling tire. This sensor system could potentially be used as a powerful engineering tool that will reveal unknown tire-road interaction mechanisms, such as rolling resistance and friction force.
The remainder of this paper is organized as follows. Section 2 provides a brief introduction to the laser-based tire-sensor system. Section 3 first presents the calibration and signal-processing issues, followed by a description of the algorithm that measures tread deformation. Section 4 presents the experimental results under different operational conditions, such as the rolling direction, wheel loads, rolling velocity, and inflation pressure. Section 5 presents the conclusions and discusses the novelties and limitations of the current work.
2. Measurement system
2.1. Laser-based tire sensor system
The tire-sensor system for carcass-deflection measurement in [17] was further developed in this study to measure tread deformations. As shown in figure 2, the system includes two laser-triangulation sensors and an optical encoder. Both laser sensors include a red semiconductor laser and a complementary metal–oxide–semiconductor (CMOS) image sensor, which has a large, dynamic range and reliable S/N ratio. This allows measurements on objects such as tire rubber that with weak reflections. Table 1 lists additional specifications of both laser sensors. Laser sensor 1 (Keyence IL-065) was encapsulated in sensor housing, which was then installed on a steel passenger car rim to measure the distance L1 ('sidewall height') between the rim and inner liner. This sensor rotates with the tire during the measurement. In addition, laser sensor 2 (Keyence LK-H150) was used to measure the dynamic loaded radius (wheel rotating axis distance from the road). This sensor was fixed to a rigid mechanical support attached to the stator of the slip ring. Hence, the position of laser sensor 2 is stationary about the rotating axle. A slip-ring package (Michigan Scientific SR10AW/T512) was used to transmit the multi-channel analog signal from laser sensor 1 through a rotating tire. Furthermore, an optical encoder (1024 counts/revolution, 0.35° resolution) within the slip-ring package was utilized to measure the angular position of laser sensor 1.
Table 1. Laser sensor specifications.
| Principle | Keyence IL-065 | Keyence LK-H150 | |
|---|---|---|---|
| Laser triangulation | Laser triangulation | ||
| Light source | Type | Red semiconductor laser, wavelength: 655 nm | Red semiconductor laser, wavelength: 655 nm |
| Laser class | Class 2 | Class 3 R | |
| Output | 560 μW | 4.8 mW | |
| Reference distance | 65 mm | 150 mm | |
| Measurement range | 55–105 mm | 110–190 mm | |
| Spot size | 550 × 175 μm | 120 μm | |
| Minimum sampling rate | 0.33 ms | 2.55 μs | |
| Repeatability | 2 μm | 0.25 μm | |
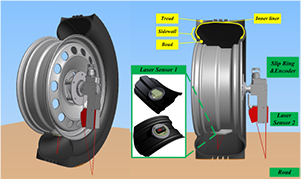
Figure 2. Prototype of the laser-based tire-sensor system to measure tread deformation.
Download figure:
Standard image High-resolution imageTo maximize the number of measurements acquired while within the contact patch, laser sensor 1 was configured to the fastest mode (3 kHz), and laser sensor 2 was configured to 20 kHz. The sampling frequency of the data-acquisition system was selected to be 40 kHz. For an R16 passenger car tire with a 100 mm contact patch, a spatial resolution of 1 mm could be expected at a speed of 10 km h−1.
Figure 3 illustrates the architecture of the data-acquisition system, which was implemented via a real-time NI DAQ system, and the post-processing algorithm was developed in Matlab. Differential measurements were performed instead of single-ended measurement to attain a low noise-to-signal ratio. The experiments were conducted in a test rig on a chassis dynamometer drum, which was covered with Safety-Walk (roughness of approximately P = 60). The test tire was driven by a drum (radius of 609.5 mm). The controlled speed could reach 200 km h−1. Moreover, the test tire could be driven in either the forward or backward direction, which is important for this rolling resistance study. The wheel load was adjustable through hydraulic cylinders controlled by p/Q controllers. In this study, to obtain a comparable measurement against the existing rolling resistance measurements in the literatures, which are based on ISO and SAE standards, the slip angle and camber angle were both adjusted to 0°. For further studies on tire cornering, braking, or accelerating, measurements with non-zero slip ratios and slip angles should also be conducted.

Figure 3. The laser-based tire-sensor system on a chassis dynamometer and the data flow chart.
Download figure:
Standard image High-resolution image3. Tire deformation measurement
The proposed tread deformation was estimated based on various measurements, including the sidewall height, loaded radius, and sensor circumferential position. This section first presents the fundamental issues of the measurements, followed by a description of the tread-deformation estimation method.
3.1. Nomenclature
As illustrated in figure 4, the definitions and notations of the different coordinate systems within the system are as follows:
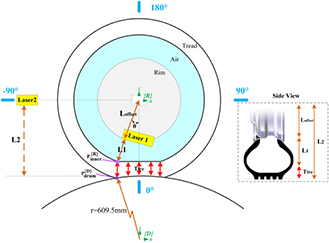
Figure 4. The coordinate system of the tire-sensor system.
Download figure:
Standard image High-resolution image- Rim coordinate {R}: the origin is located at the center of the axle, which does not rotate during rolling. The x- and z-axes align with the horizontal and vertical directions, respectively.
- Drum coordinate {D}: the origin of this frame is affixed to the center of the drum. The x- and z-axes are defined in the same manner as for the rim coordinate {R}.
- Sidewall height L1: the distance from the rim to the inner liner of the tire. The variation of this length is the sidewall deflection, which is influenced by the wheel load and road profile, and was measured by laser sensor 1.
- Loaded radius L2: the distance from the axle to the surface of the drum in the vertical direction. This distance is affected by the wheel load and was measured by laser sensor 2.
- Offset Loffset: the distance from the axle to the start point of laser sensor 1.
- Sensor circumferential position θ: the angle between the tire sensor and tire vertical axis. The six-o'clock position was selected to be 0°. The angle was determined by the optical encoder measurement.
- Tread thickness Ttre: the distance between the inner liner and outer surface of the tread block in the vertical direction. This distance is the primary interest of this paper. The estimation method based on the aforementioned quantities will be presented in the following section.
3.2. Sidewall deflection measurement
The tire sidewall refers to the adjacent part between the tread and bead. In tire mechanics, the tire sidewall affects the comfort, tire cornering, and aligning stiffness considerably. The flexibility of the tire sidewall results in a relatively large deformation under a vertical load. Figure 5 depicts the tire sidewall deflection within a single tire revolution. The sidewall measurements can be divided into two areas: the non-contact zone, in which deformations are caused by the tire vibration, and the contact zone, in which the sidewall is compressed by the ground. A previous study [17] indicated a nearly linear dependence between the peak values of the sidewall deflection and wheel loads, which could be used to estimate the wheel load if the sidewall stiffness could be determined experimentally.
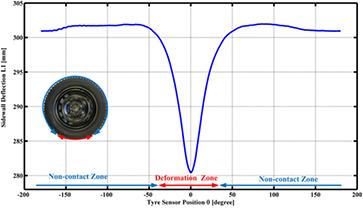
Figure 5. The tire sidewall deflection (load = 4 kN, velocity = 5 km h−1, inflation pressure = 2.5 bars).
Download figure:
Standard image High-resolution image3.3. Sensor delay calibration
Since the tread deformation is estimated based on the measurements from different sensors, the synchronization requirement for the sensor measurements is rigorous. However, the sensors used in the system all have response delays of various lengths. The response-delay time refers to the interval from the time when the sensor detects the change until the time the circuit output analog signal is recorded. The delay for the laser sensor, which is assumed to be a constant delay, mainly depends on the complexity of the internal signal processing, such as the averaging and filtering. According to the specifications, the maximum response delay times are 4 ms and 400 µs for laser sensors 1 and 2, respectively. In addition, the response delay time was measured to be 7 µs for the optical encoder.
As discussed in [18], the delay has no effect on the measurement within a single device. However, the delays require careful attention for the measurements from different devices. In the data-acquisition system, signals at specific times are instantly logged with an identical time stamp. In other words, at time t1, laser measurement L1 (t1) should be recorded together with the corresponding sensor circumferential position θ(t1). However, due to the delay of the laser sensor Δt, the laser measurement L1(t1) is actually logged with the sensor circumferential position θ(t2). The angle lag  between the recorded and actual sensor circumferential position can be estimated as follows:

where v is the tire-rolling velocity. The exact angle lag must be determined to synchronize measurements from laser 1 and the optical encoder. The angle lags were determined at different velocities by comparing the peak positions of the laser 1 measurements. All tests were conducted at a wheel load of 600 N and an inflation pressure of 4 bars. At this operational condition, the rolling resistance has only a minor effect on the tire deformation. Figure 6 clearly illustrates that the angle lag has an approximately linear dependence on the tire-rolling velocity.

Figure 6. The shift in the peak position at different velocities.
Download figure:
Standard image High-resolution imageThe error bar represents the standard deviations across the repeated peak position measurements during 50 rotations at each velocity. The angle lag was estimated as 0.216° per m s−1, which corresponds to a 1.26 ms constant response delay between laser sensor 1 and the optical encoder. Thus, the angle offset at different speeds could be formulated as follows:

where  is a constant offset between the zero positions of the encoder and tire sensor without considering the laser response delay, and v is the tire-rolling velocity in m/s. The constant offset is determined on the basis of the sidewall deformation from the previous sub-section. It is based on the fact that the sidewall deflection attains its largest value at the 0° tire coordinate, as shown in figure 5. The angle offset α is then used to compensate for the delay between laser measurements and angle measurements.
3.4. Tread deformation measurement
Tread deformation within the contact patch is a complex 3D phenomenon that includes bending, shear, and compression deformations. Nowadays, the rolling loss from the bending deformation of the tread is minimized through the application of more flexible tread patterns. Thus, the tread compression and tread longitudinal shear are considered the main sources for the rolling resistance. However, the shear deformation highly depends on the tread compression due to the incompressibility of tread compounds. On the other hand, the tread compression also affects the tire-road friction, which is an important factor for the shear deformation. Therefore, the present work only focuses on measuring the tread compression.
In this tire-sensor system, assuming that the tread is in full contact with the surface of the drum, the contact profile is the curvature of the drum, which is a perfect circular shape. Thus, the tread thickness can be defined as the difference in height between the inner liner of the tire and the surface of the drum in the vertical direction.
For an inner liner element  the distance ρ (ρ = L1 + Loffset) from the point to the axle and the circumferential angle θ are both known. The inner-liner position within the rim coordinate {R} is derived as follows:
Because the drum has a constant radius, any element of the drum-surface profile can be easily described within the drum coordinate {D} as  For the condition of zero camber and slip angles (γ = 0° and α = 0°), since the z-axes of the rim and drum coordinates are aligned in an identical vertical line, the drum surface profile
  can be transformed into the rim coordinate {R} as follows:

where r is the radius of the drum and L2 is the loaded radius.
Until now, the coordinates of both the tire inner liner and drum surface are known within the rim coordinate {R}. Hence, the tread thickness can be calculated as follows:

With a known, uncompressed tread thickness Tt0, the tread deformation during the contact can be written as follows:

Because the contact pressure is zero when outside the contact patch, it is logical to assume that vertical deformations only exist inside the contact patch. The contact patch length could be determined as the length of the non-zero deformation part. The tread deformation measurement within the contact patch is realized by rotating laser sensor 1. Therefore, the measurement is updated once per tire revolution.
To reduce the measurement uncertainties, the tread deformation is derived based on 50 rotation measurements. As shown in figure 7, the standard deviation from 50 rotation measurements indicates that the measurement uncertainties are small compared with the tread-deformation level. Those uncertainties depend on the repeatability of laser sensors, which are 2 μm and 0.25 μm, respectively. On the other hand, the measurement uncertainties are also introduced by the optical encoder. Furthermore, the synchronization error, even after the delay compensation, still introduces uncertainties to the measurement.
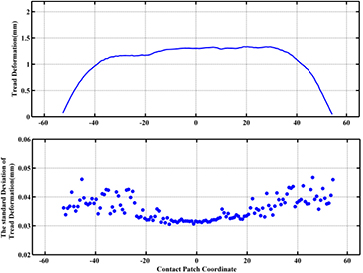
Figure 7. Tread deformation measurements based on 50 rotations and the corresponding standard deviations.
Download figure:
Standard image High-resolution image4. Results and discussion
The experiments were conducted with a commercially available passenger car tire (205/55R16). The original thickness from the inner liner of the tire to the outer surface of the tread was measured to be 15.3 mm. Four variables—the direction of rotation, wheel load, rolling velocity, and inflation pressure—were selected to examine their potential effects on tire-tread deformations. To reduce coupling effects, only one variable was selected for each experiment by holding all other variables constant. The observations are presented and discussed in detail in the following section.
4.1. Asymmetric tire tread deformation
Figure 8 presents the measured tire thickness and deformation within the contact patch for both the clockwise (CW) and counterclockwise (CCW) directions. In both cases, the contours exhibit a larger deformation at the leading edge and a smaller deformation at the trailing edge. Moreover, the deformation increases rapidly at first, until reaching the peak in front of the contact patch, and then slowly decreases. Furthermore, the direction change alters the peak location. In other words, this asymmetric vertical deformation leads to a resistance torque when the tire rolls. These hysteretic losses in the rubber compound depend on the time histories of both the strain and stress. The measurements clearly reveal that in addition to the asymmetric contact-pressure distribution, the asymmetric deformation of the tread blocks influences the tire-rolling resistance considerably. In addition, the actual measurements could also be used to refine tire models that assume a parabolic, symmetric contact pressure distribution.
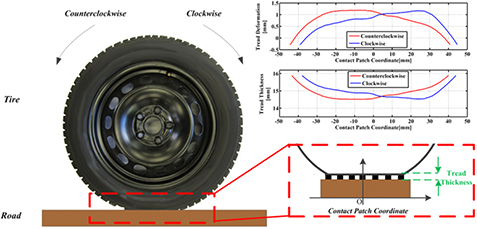
Figure 8. The asymmetric tread deformations for a radial tire (wheel load = 3 kN, velocity = 10 km h−1, inflation pressure = 2.2 bars).
Download figure:
Standard image High-resolution imageIn the ideal case, the tire deformation for both rolling directions, under the same experimental conditions, should be axisymmetric with respect to the vertical axis. However, the results of the experiment indicate that tire deformation in the clockwise direction is slightly smaller than that in the counterclockwise direction. Possible explanations for this include the following: (i) the anisotropic behavior of an actual tire, such as ply-steer; and (ii) the difference between the nominal and actual loads applied by the tire test-rig control system.
4.2. Influence of the wheel load on tire tread deformation
To examine the effects of the wheel load on tire-tread deformation, experiments were conducted under three different loads (2000 N, 4000 N, and 6000 N). As shown in figure 9, the experimental results imply that a greater load results in a longer contact patch length, and vice versa. Furthermore, the tread deformation appears to be smaller under a higher load, which might be due to the shift in the load from the tire crown to the tire shoulder, as reported in other studies [19, 20]. However, the deformation shapes also become more asymmetric under a higher load. To physically understand the tire-rolling resistance mechanism, this observation is important because it reveals the changes in deformation under different load conditions. A larger load will result in a greater rolling-resistance force, which agrees with both daily experience and experimental observations [21] that rolling resistance is linear with the wheel load for a certain operating range.
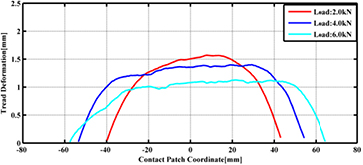
Figure 9. Comparison of the measured tread deformation under different wheel loads (velocity = 5 km h−1, inflation pressure = 2.5 bars, clockwise).
Download figure:
Standard image High-resolution image4.3. Influence of the velocity on tire tread deformation
Figure 10 illustrates the influence of different velocities on tire-tread deformation. Five different rotating velocities (5 km h−1, 8 km h−1, 10 km h−1, 13 km h−1, and 15 km h−1) were examined. Compared with the effects from the wheel load, the influence of velocity is relatively small. There was an observable pattern in the tread-deformation shape at different velocities. Moreover, the rotating speed has a minor effect on the contact length. Similar observations of the velocity on the normal pressure can be found in [22]. These observations agree well with the results and observations in [23], in which the velocity was also shown to have a minor effect on the rolling resistance at velocities less than 100 km h−1.
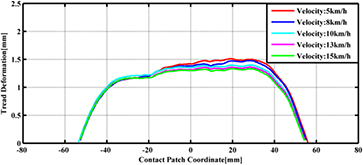
Figure 10. Comparison of the measured tread deformation at different velocities (wheel load = 4 kN, inflation pressure = 2.5 bars, clockwise).
Download figure:
Standard image High-resolution imageIncreases in the rolling velocity also cause the magnitude of deformation in the leading half to become slightly smaller. The reasons for this phenomenon are likely twofold. On one hand, according to [24], the rubber damping property, which is frequency dependent, might contribute to this effect. On the other hand, the wheel hop might also account for the magnitude changes due to the test rig control system. However, because the excitation frequency range in this experiment is low and narrow, it is difficult to draw any general conclusion.
4.4. Influence of inflation pressure on tire tread deformation
Figure 11 depicts the tire tread deformation curves with three different inflation pressures (2.0 bars, 2.5 bars, and 3.0 bars). The comparison indicates that similar to the load effect, a higher inflation pressure (3.0 bars) will shorten the contact patch length. Nevertheless, the magnitudes of the largest deformations do not significantly alter with changes in pressure. The same result was observed in [25] for the thermal simulations and laboratory measurements. The tread contribution from the hysteretic losses is nearly constant with pressure changes. However, the hysteretic losses in other regions, e.g., the shoulder, sidewall, and bead, are more sensitive to changes in inflation pressure, which leads to the well-known observation that the tire's overall rolling resistance decreases with increasing inflation pressure.

Figure 11. Comparison of the measured tread deformation at different inflation pressures (velocity = 5 km h−1, wheel load = 4 kN, clockwise).
Download figure:
Standard image High-resolution image
5. Conclusion
This paper presented a laser-based sensor system to measure tire-tread deformation. Asymmetric tread deformations along the contact patch due to rolling resistance were clearly observed. The rolling direction, wheel loads, and inflation pressures affected the tread deformation considerably, whereas the tire-rolling velocity, in a certain operating range, had only a slight effect on the tread deformation. The observations reveal the direct link and qualitative relationship between tread deformations and rolling resistance. To further develop a quantitative relationship between them, experiments that measure both tread deformations and rolling resistance are needed. In addition, for a spot laser sensor, only one tread element in the tire cross-section was measured. Tread deformation is also not uniform along the width of the tire-road contact patch. Therefore, a 2D laser sensor, which could examine the complete tread deformation within the contact patch in three dimensions, should be developed to obtain a better understanding between the tread deformation and tire-rolling resistance. This work, based on the optical sensing method, provides quantitative measurements for tire designers to verify finite-element simulation results and optimize tire construction and materials. This method represents a powerful engineering tool to study the low rolling resistance of tires.
Acknowledgments
The research leading to these results was performed within the LORRY project (www.lorryproject.eu) and received funding from the European Community's Seventh Framework Programme (FP7/2007–2013) under grant agreement No. 314463. This work was also partially funded by the Academy of Finland (grant number 138272). The support is gratefully acknowledged.