

Abstract
We demonstrate a temperature noise floor of 0.3 K  and a long-term stability better than 0.6 K (peak-to-peak value) using a single crystal of diamond smaller than 50 nm across and containing about 100 nitrogen-vacancy centres as a temperature sensor. We compare the achieved characteristics to other single-particle sensors and show that it is one of the best ratiometric all-optical nano-probes of temperature to date.
Export citation and abstract BibTeX RIS
1. Introduction
Minimally intrusive temperature measurements with nanometer spatial resolution is an important problem which, when solved, will have potential applications in cellular biology, nano-electronics and other fields where understanding temperature dynamics and inhomogeneity of the temperature distribution in space are important for uncovering the functionality of natural and human-made complex systems. It is well established, for example, that one degree of temperature is a significant factor for the outcome of hypothermal cancer treatment [1, 2]. On a cellular level, a relatively small temperature change affects such processes as protein folding [3], calcium signalling [4], metabolism rates [5] etc. Localization of the hot-spots in active integrated circuits becomes increasingly important with continuing scale-down of microelectronics technologies [6]. The problem of temperature nanosensing has been targeted in many recent high profile publications. The least invasive and sensitive methods of temperature measurements currently exploit luminescent probes [7]. They are sensitive and provide several hundreds of nanometers or even better spatial resolution. Conventionally, optical resolution of a luminescence detecting instrument is affected by diffraction and is not better than half of the wavelength emitted by the probe, but sub-diffraction spatial resolution can be achieved by various types of novel methods of microscopy exploiting luminescent nano-particles (nano-crystals, single molecules etc) [8].
Recently, luminescent defects in nano-diamond crystals, the so-called nitrogen-vacancy (NV) centers have demonstrated potential in a variety of applications [9–13] including temperature sensing [14–19]. NV-centers are defects in the crystal lattice of diamond crystals when one of carbon atoms is substituted with nitrogen and, in addition, a single vacancy is created at a position adjacent to the nitrogen atom (for a recent review see [20]). In this paper, we are mostly interested in negatively charged NV− centers. A peculiar property of these centers is the spin-triplet nature of their most stable state. This property enables electron-spin resonance measurements on NV centers in their electronic ground state. Moreover, the dependence of the luminescence intensity on the spin projection on the symmetry axis of the center enables optical detection of magnetic resonance (ODMR) in a single center. This is also facilitated by optical polarization of the electronic spin (preferable populations of m = 0 spin level under optical excitation) due to spin-selective intersystem crossing (effective only for  ) from the electronically excited triplet to a metastable singlet state. The sensitivity of Δ, the zero-field splitting between the m = 0 and
  spin states to the temperature has been demonstrated and used to achieve the temperature noise floor of about 0.01 K
  in measurements with a single NV-center embedded in an almost perfect ultra-pure bulk diamond crystal [16, 17]. This is the lowest noise floor experimentally demonstrated so far with a single quantum system. But such ODMR measurements require an electrically conducting coil placed near the center and carrying radio-frequency (RF) currents tuneable around 2.8 GHz. This creates technical complications in the experimental setup, as well as resistive heating and exposure of the sample to RF radiation. Also, the demonstrated record low noise floor in ODMR has been obtained in a nearly perfect bulk diamond crystal while a sensor not larger than 50 nm is typically required for intracellular measurements. All of these factors limit the scope of possible applications based on the ODMR technique.
Here we demonstrate a novel, competitive, simple, and all-optical approach to the temperature measurements which uses luminescence of NV centers in diamond nano-crystals and out-performs the existing all-optical nano-sensor by an order of magnitude. The main criteria for the comparison is a minimum temperature change which can be detected within a certain measurement time.
2. Experimental
The experimental setup has been described in many details elsewhere [19]. In brief, we use diamond crystals with a mean size of about 35 nm prepared from synthetic sub-micron diamond powder. The diamonds have been first irradiated with 40 keV α-particles and then annealed at about 1070 K to increase concentration of NV-centers and milled down to the size of nano-particles. The estimated concentration of NV centers in the diamond nanocrystals is about 10 ppm from ensemble characteristcs [21]. The diamond nano-crystals have been spin-coated on a quartz slide for optical measurements. The laser light has been focussed on the surface of the slide and luminescence collected with a microscope objective. At a room temperature of 295 K, we used a microscope objective with a high numerical aperture of 0.9. For measurements above the room temperature, the slide has been placed in a heater where the temperature was stabilized within accuracy of ±1 K using a simple electronic feedback circuit. Numerical aperture of a long working distance microscope objective has been 0.55 in this case. The spectra have been obtained with 532 nm and 590 nm excitation wavelength. In each case a long-pass filter (Semrock) transmitting only light at longer than 600 nm wavelength has been placed in front of the spectrometer. Luminescence has been measured with electron-multiplying CCD (Andor) working in conventional amplifier mode to reduce fluctuations of the signal.
3. Results and discussion
In the following, we first demonstrate all-optical ratiometric temperature measurements based on luminescence spectra of a single, less that 50 nm across diamond crystal containing about 100 NV centers. The noise floor of 0.3 K  is achieved without the complexity of the ODMR. Such a small noise floor is an order of magnitude smaller than previously demonstrated in all optical measurements [19]. Then we compare the achieved characteristic to other single-particle nano-sensors of temperature. This comparison is not straightforward as frequently important information is missing in the original publication on temperature measurements and has to be retrieved from other sources.
3.1. Thermometry with NV-centres in nano-diamond crystals
Two luminescence spectra of the same crystal are shown in figure 1. The striking difference between the two spectra is due to the different contributions of electrically neutral centers, NV0 to the spectra. These centers have a shorter zero-phonon line (ZPL) transition wavelength (575 nm in comparison to the 638 nm transition of  ). The ZPL corresponds to pure electronic optical transitions which do not change the phonon numbers of the crystal lattice and/or of local vibrations. Therefore photons at 590 nm wavelength have enough energy for electronic excitation of the NV0 centers only from a thermally populated vibrational level. The two spectra are scaled vertically so that they overlap at the long-wavelength side where the luminescence of NV0 is minimal. An advantage of the excitation at the 590 nm wavelength is significant reduction of the background under ZPL in the luminescence spectra. This background is one of the factors contributing to the detection noise [19]. The background is not reduced to zero due to a significant contribution of hot luminescence of
  . A simple way to characterize this background quantitatively is by the background ratio
  (see figure 2), the ratio of the background level at the center of ZPL to the ZPL amplitude. The factor r has been determined for 5 crystals where it had a value of
  . The dispersion of r is relatively small because in the case of the 590 nm excitation r is an intrinsic property of the NV− luminescence and does not depend on the concentration of NV0 in the crystal. Contrarily, the ratio varies between 4 and 10 in the case of 532 nm excitation. Another advantage of 590 nm excitation is that in this case the left side of the phonon band (approximately from 607 nm to 657 nm) can be very well approximated by an exponential function. Under the 532 nm excitation the background is more structured and this creates additional ambiguity in the data analysis and complicates separation of the ZPL from the phonon band.
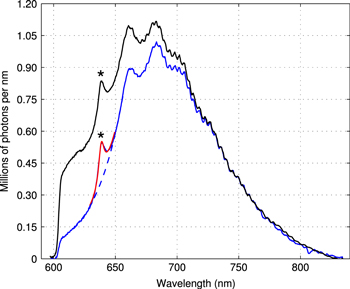
Figure 1. Luminescence spectra of NV-centers in diamond at a room temperature (295 K) under excitation by 532 nm wavelength (upper line) and 590 nm wavelength (lower line). The spectra are scaled to overlap in the long-wavelength region. The zero-phonon lines of the NV− center are labeled by asterisks. The oscillations on the right-hand side of the spectra are caused by interference in the optical window of the CCD.
Download figure:
Standard image High-resolution image
Figure 2. Simulated data mimic the short-wavelength region of the experimental spectra (590 nm excitation). The data represent function  with added Poissonian noise. The data are fitted by minimizing the corresponding chi-squared. The process is repeated 10 000 times to determine
  , the standard deviations divided by the mean values for A,
  , and Γ (shown by circles, squares, and diamonds respectively). The solid line is the theoretical curve as defined by equation (2).
Download figure:
Standard image High-resolution imageIt can be seen in figure 3(A) that both the ZPL amplitude and the background depend on the temperature. We will discuss the background dependence later and first focus our attention on the ZPL. The temperature dependencies of the ZPL amplitudes measured on 5 crystals are shown in figure 3(B).
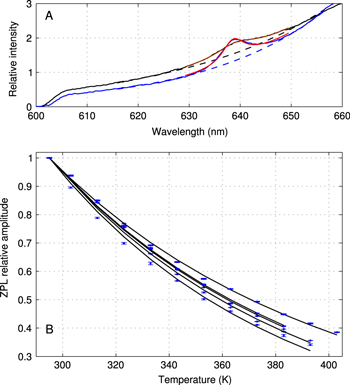
Figure 3. Panel A: the two spectra measured at 295 and 383 K (excitation at 590 nm) show the dependence of the relative amplitude and the background on the temperature of the crystal. The spectra are normalized to the same total area. Panel B: temperature dependence of relative ZPL amplitudes of five crystals and the fits to the single-parameter equation (3).
Download figure:
Standard image High-resolution imageThe data analysis has been done by minimizing the chi-squared function defined as follows
where Nn is the number of photons detected in the nth spectral bin (corresponds to one pixel of the CCD matrix in the direction of spectral dispersion). The exponential term is semi empirical and can be justified by the fact that thermal population of the vibrationally excited levels (emission of photons with a wavelength shorter than that of the ZPL comes exclusively from the vibrationally excited states) is proportional to the exponential Boltzmann factor. The ZPL has three fitting parameters, the amplitude A, the linewidth Γ and the position n0. The exponential background is characterized by the prefactor B0 and the exponential factor b. In principle, all the factors and their combinations such as  , the area under the ZPL (ZPL area divided by the total area of the spectrum gives the value called Debye–Waller factor, or DWF) are temperature dependent and can be used for temperature measurements. However, their sensitivities to the temperature are different. Although the relative errors in the estimated values of A, Γ, DWF etc (defined here as standard deviations divided by the corresponding mean values e.g.
  ) are all inversely proportional to the square root of the total number of the photons emitted in the ZPL,
  , the proportionality constants are different in each case. Under simplifying assumption (uniform, wavelength independent background and an infinite recorded spectral interval where a single Lorentzian-shape line is located) the relative standard deviations of the ZPL parameters can be derived analytically [22]. The standard deviation of the amplitude estimate can be expressed as follows

where ![$[{{a}_{1}},{{a}_{2}},{{a}_{3}}]=[3,3,1]$](https://content.cld.iop.org/journals/0957-4484/26/24/245501/revision1/nano513797ieqn16.gif) are analytically derived assuming an infinite spectral interval. For a finite spectral interval, comparable to the ZPL linewidth the analysis is more complicated but can be done numerically. This is shown in figure 2. The inset in figure 2 demonstrates how
are analytically derived assuming an infinite spectral interval. For a finite spectral interval, comparable to the ZPL linewidth the analysis is more complicated but can be done numerically. This is shown in figure 2. The inset in figure 2 demonstrates how  (and similar for Γ and NZPL) depends on the background when the linewidth is about 12 times narrower than the recorded spectral interval. Surprisingly, the results for the amplitude A are the least dependent on the details of the model and the theoretical curve (equation 2) overlaps well with Monte Carlo simulations. The convergence of the data obtained by numerical simulations to the curves derived for the infinite range is very slow for
  and Γ for which
 ![$[{{a}_{1}},{{a}_{2}},{{a}_{3}}]=[1,3,1]$](https://content.cld.iop.org/journals/0957-4484/26/24/245501/revision1/nano513797ieqn19.gif) and
and ![$[{{a}_{1}},{{a}_{2}},{{a}_{3}}]=[2,4,4]$](https://content.cld.iop.org/journals/0957-4484/26/24/245501/revision1/nano513797ieqn20.gif) respectively (these curves are not shown in the figure).
respectively (these curves are not shown in the figure).
Based on the experiments performed on a single NV center and theoretical analysis [23, 24], it is expected that the linewidth increases with temperature while the DWF decreases with increasing temperature. It is then apparent that the amplitude (divided by the total luminescence intensity to account for the changes in the laser light intensity etc) has a larger temperature sensitivity than both DWF and Γ. It is clear from the noise analysis and the sensitivity argument that the amplitude has a significant advantage in the accuracy over Γ and DWF.
A simple Debye model for the density of the phonon modes and scaling laws for the electron–phonon coupling can be used to predict how the DWF and the width of the ZPL depend on the temperature. In particular, at room temperature and above the ZPL width is proportional to T2 [25] while the decrease of the DWF is described by an exponential dependence [19, 26]. These two factors combined together result in the following expression for the temperature dependence of the ZPL amplitude normalized by AR, its value at  which was the temperature in the laboratory
where TD is the Debye temperature of diamond and S is the parameter determining the strength of coupling between the electronic degrees of freedom in the NV-center and the phonon bath of the crystal. Equation (3) effectively depends on a single parameter  . For the sample of 5 crystals which have been studied,
  K. The theoretical sensitivity of the ZPL amplitude according to equation (3) reads

Given the mean and the variance of  , the value of inverse sensitivity
  at T = 295 K. The sensitivity can also be estimated by fitting a cubic-polynomial to the experimental data points in figure 3(B). The polynomials fit the data visibly better than the single-parameter equation (3) but the value of
  K at 295 K estimated using the derivatives of the polynomials agrees well with the estimate obtained from equation (4). Given a small dispersion of the temperature sensitivity we will use the value of
  K also for crystals which have not been calibrated in the oven.
The final step in the data analysis is to eliminate fluctuations of the ZPL amplitude due to the fluctuations in the excitation intensity. For this purpose, the amplitude has been divided by the integral intensity of the spectrum in the range from 610 to 660 nm.
The change of temperature  can be determined using
  , the change of the ZPL amplitude as follows

while the noise floor of the temperature measurements reads

The value of  , where tm is the measurement time is called the noise floor of the temperature measurements and is expressed in units of K
  . To obtain the experimental value for the noise floor, luminescence of one crystal has been monitored for about 22 min at room temperature of 295 K. 900 spectra have been collected with integration time of 1 s per spectrum and then analysed as explained above. The difference between the ZPL amplitude at the beginning of the series and its values at later times has been multiplied by 95 K for conversion to the corresponding temperature change and then plotted in figure 4(A). Note also how well a simple exponent fits the left side of the phonon band as shown in figure 4(B). The standard deviation of the temperature fluctuations estimated from the data equals 0.30 K and given the 1 s integration time the noise floor equals 0.3 K
  . Below we estimate the noise floor using Poisson statistics of photon counting.

Figure 4. Panel A: time series of ZPL amplitude demonstrates noise floor of 0.3 K  . The solid lines are fourth-order polynomial fits (separately for each segment) indicating that the long term fluctuations are smaller than 0.6 K (peak-to-peak value). Panel B: luminescence spectrum (dots) of the crystal used to obtain the series shown in Panel A. The pixel number is in a linear relationship with the wavelength but is more convenient for the noise analysis than nm. The solid lines show the Lorentzian and the background fitted to the data in the pixel range from 30 to 190. Panel C demonstrates a temperature change of 8 K detected with a nano-diamond (
 )
)
Download figure:
Standard image High-resolution image
The number of photons detected in ZPL in one second  and the relative background factor r = 1.65 for this crystal. Substitution of these numbers into right hand side of equation (2) leads to a value of
  in perfect agreement with the experimental number of
  . Moreover, the relative standard deviations of Γ and DWF determined experimentally for the 900 data points in figure 4 are 0.0044 and 0.0037, in agreement with the simulations shown in figure 2. Thus, the observed fluctuations confirm Poisson statistics of the photon counting in these experiments. This conclusion is not trivial as it indicates negligable luminescence intermittency (blinking) in these crystals as compared to quantum dots (QDs) [27].
The long time drift which can be identified in the data by fourth-order polynomial fits to the three segments shown in figure 4(A) indicate possible slow fluctuations of the room temperature. But 0.6 K, the peak-to-peak range of these fluctuations is within the 68% confidence interval  defined by the short-time fluctuations. The cause of the apparent slow drift has not been further investigated. The overall detected photon count rate observed for this crystal is 52 MHz. Using the numbers for the photon detection efficiency reported previously [19] we estimate that there are about 100 NV centers in the crystal under consideration (the exact estimate depends on the population of the metastable signet state). Panel C in figure 4 shows a change of 8 K detected by a nano-diamond of a similar detected brightness (
 MHz count rate). For this measurement, the slide with nano-diamonds has been placed in the heating chamber, close to its optical window. The spectra have been measured first at a room temperature and then a temperature of 8 K higher. A smaller numerical aperture of the microscope objective (NA 0.55 with a long working distance) and the window of the heating chamber have reduced the photon collection efficiency by a factor of about 3. The standard deviation of the data at the room temperature is 0.33 K and agrees with the estimate obtained for Panel A. The peak-to peak range of 1.6 K and the standard deviation of 0.5 K at the higher temperature are slightly larger. The two distinct spikes and the apparent drift in the temperature data are explained by imperfect temperature stabilization.
The noise floor of the temperature measurements can be further reduced by exploiting the temperature dependence of the exponential fit to the short-wavelength side of the phonon band. In particular, the exponential factor b (see equation (1) and the caption to figure 2) demonstrates inverse sensitivity  K. Although this makes b three times less sensitive to the temperature change than the ZPL amplitude, the short-time relative fluctuations of b are more than three times smaller. Weighted average calculation of
  using the values of
  and
and  reduces the short-term noise floor to 0.23 K
  . Unfortunately, it has been observed that the long-term instability divided by its short-time variance is larger for the exponential factor than the same ratio determined for the ZPL amplitude. The origin of the long-term instability needs further investigations.
3.2. Comparison to other nano-sensors and ODMR
Conventionally, the sensitivity of a probe  is defined as a relative change of the temperature sensitive factor F per one degree of temperature increment. Although this is an important parameter (see, for example, a review article [7] where the data on sensitivity is reported for many sensors), the detection of the temperature change by luminescent nano-sensors (unlike in bulk measurements) is fundamentally limited also by the number of detected photons which cannot be increased by increasing the concentration of the nano-particles. If a probe responds to a temperature change by changing its total luminescence intensity (see, for example, a paper by Wang et al [28]), the minimum change of the temperature detectable by one particle reads
where  is the temperature change which can be detected with 68% confidence, tm is the measurement time, I is the photon emission rate per particle, D is the photon detection efficiency, and
  is the number of detected photons. The expression is based on the assumption that Poisson statistics of photon counting is the dominating source of noise. This is frequently the case in single nano-particle measurements where the number of detected photons is so small that
  is much larger than, for example, the relative fluctuation of the excitation laser intensity. The temperature resolution reported in many publication has units of K and the term originates from bulk measurement where it is likely to be determined by the stability of the experimental setup, which may have a complicated dependence on the measuring time.
Using equation 7 we can evaluate the noise floor of the CdTe QDs [28]. The reported sensitivity of this sensor is 1.1% K−1 and radiative decay rate of their excitonic states is about 50 MHz [29, 30]. This rate sets the maximum photon emission rate at 50 MHz (to achieve this number the optical transition must be saturated by a high intensity of the exciting laser). The rate of detected photons depends on the detection efficiency but in the case of QDs may be reduced by luminescence intermittency effect [31]. The maximum detected count rate observed for similar QDs is about 500 kHz [32]. The corresponding noise floor is about 0.13 K  . The paper reports temperature resolution of 0.02 K estimated from the signal-to-noise characteristics of the fluorescence spectrometer used in balk measurements and therefore the Poisson fluctuations will dominate single-particle measurements. This is an impressive value of the noise floor but CdTe QDs suffer from thermal instability [28]. In addition, it can be problematic to ensure high stability of the excitation intensity (better than 0.1%) on the level of a single particle which can exhibit, for example, significant diffusion. Therefore so called ratiometric optical thermometry appears much more suitable for single-particle applications because ratiometric probes display a change in the relative intensities of different regions of the detected spectra [33].
A good example is given by  -doped semiconductor nanocrystals [34, 35] where the relative intensities of two peaks in the spectra, one associated with direct emission from an excitonic state of the QD and the other from the state of
  localized in the band gap, depend on the temperature. The temperature is assessed using the ratio
  , where I1 and I2 are the intensities emitted in the two bands. Using elementary error propagation calculations, the temperature noise floor can be estimated as

The sample with the highest precision (DPA-MnO5ZnS10) has the following characteristics: sensitivity  K−1, exciton life time
  and a very long lifetime of the
  level which mounts
  ms. The intensities of the two bands are about equal at room temperatures because the
  level has several orders of magnitude higher population than the exciton state. Given
  the expression above simplifies to
  . The publications on these sensors do not state the actual count rates. In the most favourable for the detection case,
  is the radiative lifetime and the corresponding emission photon rate under saturation is 0.5 kHz and then
  K
K  , much higher than the value obtained for CdTe DQs.
For completeness, we also consider ODMR measurements carried in a 150 nm crystal containing about 500 NV centers as presented in [16]. The results were much less impressive than with a bulk diamond crystal obtained by the same authors and others [17]. In [16], the luminescence intensity was measured at two pairs of RF frequencies positioned symmetrically on both sides near the points of the largest gradient of the approximately Lorenzian ODMR line to find the change of the zero-field splitting Δ. The noise floor for the nano-diamond measurements has not been reported but the following theoretical expression can be derived (for the procedure used in [16] and briefly discribed above) using Poisson statistics of the photon counting

where  is the ODMR width,
  is the contrast of the ODMR, and
  kHz K−1 is the sensitivity. The nano-diamond used in the intracellular experiments had a photon count rate detected during the ODMR measurement of about 10 MHz [36]. We have used these data and have estimated
  K
K  , a value practically identical to the noise floor demonstrated in this work with a nano diamond of a similar brightness.
4. Conclusion
In this paper we have presented and characterized a simple ratiometric, all-optical temperature sensor based on NV− centers in diamond. We have demonstrated a noise floor at the level of 0.30 K  at 52 MHz detected photon rate. The temperature noise floor is lower than or equal to the values demonstrated with direct ODMR measurements on a nano-crystal with similar brightness but the proposed method is straightforward to apply using conventional optical microscopes (e.g. Raman microscopes, etc). The noise is dominated by the Poisson fluctuations of the photon counting and will be further reduced if the concentration of the NV centers is increased. The simple Poisson statistics of the photon counting signals that luminescence intermittency and/or setup instability does not affect the measurements. There is also the potential to reduce the noise floor down to 0.23 K
  at 50 MHz photon count rate by combining the dependence of the phonon band on the temperature with the dependence of the ZPL amplitude.
Acknowledgments
The authors acknowledge N B Manson and M W Doherty for useful and inspiring discussions.