

Abstract
By means of hybrid density functional theory (DFT) computations, we found that (Li,K)-codoped WO3 shows a significantly enhanced near-infrared (NIR) absorption ability for smart windows, and investigated the influence of doping through the analysis of the electronic structures of pure and doped hexagonal WO3. Furthermore, this codoped material, with a hexagonal tungsten bronze nanostructure, was successfully prepared via a simple one-step hydrothermal reaction for the first time. Transmission electron microscopy images showed that the as-prepared products possessed a nanorod-like morphology with diameters of about 5–10 nm. It was demonstrated that (Li,K)-codoped WO3 presents a better NIR absorption ability than pure, Li-monodoped or K-monodoped WO3, which is in good agreement with our theoretical predictions. The experiment and simulation results reveal that this enhanced optical property in NIR can be explained by the existence of high free electrons existing in (Li,K)-codoped WO3.
Export citation and abstract BibTeX RIS
1. Introduction
Semiconductor materials with selectively controllable infrared (IR) properties have attracted extensive attention as a potential way to improve the energy efficiency of smart-window applications in buildings [1]. In particular, developing materials to shield from near-IR (NIR) is important, since the majority of the IR energy in the solar spectrum is concentrated in the range of NIR (780–2500 nm) [2].
Among semiconductors, tungsten trioxide (WO3) is considered as a promising candidate for smart windows due to its unique electrical and optical properties [3–6]. Previous investigations have indicated that the appearance of oxygen vacancies in the crystal structure creates free electrons and lowers the oxidation state of tungsten, which yields a good NIR shielding ability for WO3 [7, 8]. However, due to the limited number of oxygen vacancies, the free electron concentration, dominating the electrical and optical properties, is restricted. The various tunnels in WO3 created by correlated corner-sharing WO6 octahedra provide another opportunity for the introduction of free electrons, i.e. interstitial doping. Different from defects or substitutional doping, interstitial doping allows the impurity atoms to reside in empty sites of the crystal structure [9]. Tungsten bronze (TB) is one of the class of interstitially doped WO3, with the formula MxWO3 (M = Li, Na, K, Rb, or Cs, etc), which shows high absorption of NIR light and transmittance of visible light (Vis) [10]. Generally, it is believed that the codoping is an effective strategy for tuning free electron concentration [11]. Our previous density functional theory (DFT) calculations also predicted that the codoping could increase electron density and induce strong NIR absorption in WO3 [12]. However, to the best of our knowledge, no experimental studies on codoped WO3 have been reported.
Herein, we use the hybrid DFT calculation to find that (Li,K)-codoped WO3 presents significantly enhanced NIR absorption, compared to Li-monodoped (Li–WO3), K-monodoped (K–WO3) and pure WO3. Moreover, we also adopt non-toxic tungstic acid precursors, and K2SO4 and Li2SO4 as dopants to synthesize (Li,K)–WO3 through an ethylene glycol (EG) reduction approach. Optical tests show that (Li,K)–WO3 definitely exhibits a better NIR absorption ability than pure Li–WO3 and K–WO3, which confirms our theoretical prediction.
2. Theoretical and experimental methods
2.1. Theoretical methods
All calculations were carried out using the projector augmented technique, as implemented in the Vienna ab initio Simulation Package (VASP) [13, 14]. The Perdew–Burke–Ernzerhof (PBE) [15] gradient corrected functional was employed to treat the exchange and correlation. All plane waves with a cutoff energy of 500 eV were used in the basis function. The lattice constants of all the structures were optimized and 5 × 5 × 9 Monkhorst-Pack [16] k-point sampling is used for atomic relaxation of 2 × 2 × 1 supercells. The relaxation was stopped when the force on each atom reached 0.01 eV Å−1 or less. The Heyd–Scuseria–Ernzerhof [17, 18] (HSE06) hybrid functional was used in the calculations of densities of states (DOS), where a combination of 55% exact Hartree–Fock (HF) and 45% PBE exchange was used, and the exchange functional was described by PBE in the long range part. The range-separation parameter μ was fixed at 0.2 Å−1. A reduced 5 × 5 × 5 k-point sampling was taken for DOS plots.
The optical absorption spectra of the materials were calculated using the following equation [19]:

where α(ω) is the absorption coefficient, and ε1(ω) and ε2(ω) stand for the imaginary and real parts of the frequency dependent complex dielectric function ε(ω), respectively. In this paper, ε1(ω) and ε2(ω) were averaged over three polarization vectors (x, y and z) to take the tensor nature of the dielectric into account. The number of bands (NBANDS) was set to 500 to ensure that the empty bands were included in the calculations.
2.2. Experimental methods
All chemical reagents were of analytic grade and used directly without further purification. In a typical procedure, 490 mg of K2WO4·H2O was dissolved in 10 ml deionized (DI) water, and then 10 ml 7% HNO3 aqueous solution was added into the K2WO4 solution. The light yellow precipitate was washed with DI water three times to remove contaminant ions and obtain a solid. Then 50 ml DI water was added to the H2WO4 precipitate and the solution was stirred at 40 °C to obtain a translucent and homogeneous solution. After that, 10 ml ethylene glycol and certain amounts of K2SO4 and Li2SO4·H2O were added into the solution with a predesigned Li/W molar ratio and a K/W (molar ratio) = 0.33. Finally, the precursor solution was transferred into a Teflon-lined 100 ml autoclave and heated at 200 °C for 16 h. After the autoclave cooled down naturally under ambient conditions, the precipitate was collected after centrifugation and washed with DI water and absolute ethanol several times, and finally dried at 60 °C in a vacuum.
X-ray diffraction (XRD) measurements were conducted with a Bruker D8 Advance diffractometer, Cu-Kα radiation (λ = 1.5406 Å). The diffraction data were recorded for 2θ angles between 10°–80°. Transmission electron microscopy (TEM) and high-resolution TEM (HRTEM) images were obtained on a JEM-2100. Fourier transform IR spectra (FTIR) were recorded in a VERTEX 70 Bruker spectrometer with a resolution of 4 cm−1, in the range of 400–4000 cm−1. The particle size distribution of the samples was measured on a Malvern Zetasizer ZS90. X-ray photoelectron spectra (XPS) measurements were performed on a THERMO VG ESCALAB 250 electron spectrometer with a monochromated Al Kalph 150 W. The pass energy was fixed at 200 eV for survey and 30 eV for high-resolution scans with a spot size of 500 μm. The binding energies were calibrated against the C 1s signal, which was centered at 284.9 eV. The dispersion state of the nanocrystals on the films was record by employing a Bruker Dimension FastScan atomic force microscope (AFM) in tapping mode.
The as-prepared sample powder was dissolved in DI water using ultrasonication for 10 min to form stable TB dispersions with 160 mg mL−1. Then 2 g polyvinyl pyrrolidone (PVP, MW = 1300 000) was added to the 8 g dispersion, providing a viscous mixture. Next, the mixture solution was painted on a thin glass plate by an applicator, with a concave depth of 50 μm. After drying at 70 °C, a uniform film was obtained and the optical test of the film was conducted using a Lambda 950 UV–Vis–NIR spectrophotometer.
3. Results and discussion
To give a comprehensive understanding of the doping positions of Li and K, it is necessary to illustrate the crystal structures of hexagonal WO3 (hex-WO3). As shown in figure S1, there are three types of interstitial sites in pristine hex-WO3, i.e. hexagonal cavity (HC), trigonal cavity (TC) and four-coordinated square window (SW). Potassium can only enter into the HC and interact with the surrounding oxygen. In addition to HC, TC and SW are also available to lithium due to its small size. After geometry optimization, lattice expansions take place in the entire the doped system (table S1). In addition, the Li in SWs moves into the TCs while the K shifts in the opposite direction and interacts with the oxygen atoms nearby (figure S2(e)).
The optical absorption spectra of pristine and doped hex-WO3 were calculated and the results are displayed in figure 1. Pristine hex-WO3 shows absorption only in the short wavelength range and a response in the Vis–NIR range is barely observed. In contrast, absorption in the long wavelength, especially in NIR, range can be found after the incorporation of Li, K and (Li, K). Furthermore, although there is a difference in NIR absorption ability between the two kinds of (Li,K)–WO3 (figures 1(c)–(d)), their intensity in NIR still surpasses that of the monodoped system.

Figure 1. Calculated UV–NIR absorption coefficients: (a) hex-WO3, (b) Li-monodoped WO3 (Li initially located within HC), (c) K-monodoped WO3, (d) (Li,K)-codoped WO3 (Li initially located within TC), and (e) (Li,K)-codoped WO3 (Li initially located within SW).
Download figure:
Standard image High-resolution imageIn order to further understand the origin of the change in optical properties before and after doping, we also calculated the total DOS and partial DOS (PDOS) of the pure and doped hex-WO3. As the band gap of semiconductors is usually underestimated by standard DFT [20] HSE06 was performed, and the calculated band gap of hex-WO3 (2.9 eV) is close to the experimentally reported value (2.8 eV) [21], which supports the accuracy of the simulation. Pure hex-WO3 (figure 2(a)) has semiconducting behavior as its Fermi level is located at the valence band maximum (VBM). The VBM and conduction band minimum (CBM) are primarily dominated by O 2p and W 5d states and their compositions show little change after doping. From the PDOS in figures 2(b)–(e), one can see that both the Li 2s states and K 4s states lie above the Fermi level, implying that the Li and K atoms are ionized and create charge density to the CBM. As a result, all the hexagonal TBs (HTBs) demonstrate n-type metallic characteristics with their Fermi level entering into the conduction band. It can be found that no matter where the Li is the Fermi level of (Li,K)–WO3 is always located at a higher energy than that of Li–WO3 and K–WO3, indicating that more free electrons exist in the W–O framework of (Li,K)–WO3. Since the concentration of free electrons plays an important role in determining the optoelectronic properties of doped semiconductors [22], it is reasonable to see a diverse NIR absorption abilities between (Li,K)–WO3, Li–WO3 and K–WO3. In addition, although the band gaps (the energy difference of CBM–VBM) of HTBs decreased (the many-body effect [23]), the wide optical band gaps were retained due to the fact that the bottom of the conduction band is filled with electrons and only high energy levels are available to the excited electrons from the valence band (the Burstein–Moss effect [24]), which ensures the high transmittance of Vis.

Figure 2. Total and partial density states of (a) hex-WO3, (b) Li-monodoped WO3 (Li initially located within HC), (c) K-monodoped WO3, (d) (Li,K)-codoped WO3 (Li initially located within TC) and (e) (Li,K)-codoped WO3 (Li initially located within SW). The black dashed vertical lines are taken as the Fermi levels.
Download figure:
Standard image High-resolution imageFor experimental validation of the theoretical findings, WO3, Li–WO3, K–WO3 and (Li,K)–WO3 were prepared. For Li-monodoped WO3, Li intercalation causes a cubic phase (JCPDS card no. 70-148) and only hex-WO3 (JCPDS card no. 85–246) can be obtained when EG is absent (figure 3(a)). Figure 3(b) shows that the reflections of K–WO3 can be well matched with hexagonal potassium TB (K0.26WO3; JCPDS card no. 83–1593). It is noted that the diffraction peak of (002) shifts to a lower degree with lithium incorporation, which means that Li is incorporated into the crystal structure and induces lattice distortions. Furthermore, the relative intensities of the (200) peaks in Li–WO3 and the (002) peaks of WO3 and K-containing products are higher than the standard level, revealing the preferential growth of the HTBs is along the a- or c-axes.
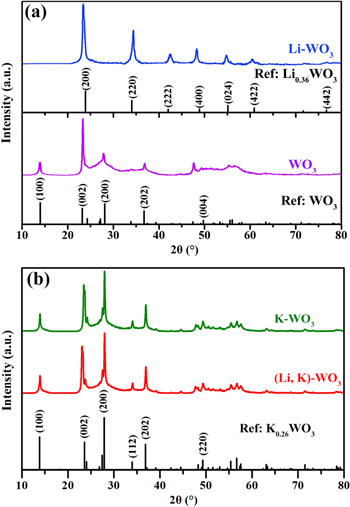
Figure 3. XRD patterns of (a) WO3 and Li-monodoped WO3, and (b) K-monodoped WO3 and (Li,K)-codoped WO3.
Download figure:
Standard image High-resolution imageFrom the low-resolution TEM images (figures 4(c)–(f)), it can be observed that all the as-prepared products are comprised of numerous nanorods that are 5–10 nm in diameter and of hundreds nanometers in length, and the particle size distribution illustrates that the size of all the products is comparable (figure S3). The spacing between adjacent lattice planes is also calculated (inset of figures 4(c)–(f)), which confirms the XRD results. The growth mechanism of the nanorods obtained in our experiment can be fitted into two theories. The first one is a prevailing opinion that sulfate ions prefer to absorb onto the crystal faces parallel to the c-axis, leading to the formation of a one-dimensional structure [25, 26]. On the other side, the incorporation of metal atoms such as Li and K into interstices of WO3 differentiates the surface energy of the primary particle which promotes the growth rate of different crystal faces [27]. Due to the fact that the sulfate ions, Li+ and K+ all exist in our reaction system, these two theories are capable of explaining the origin of anisotropy growth found in our products.
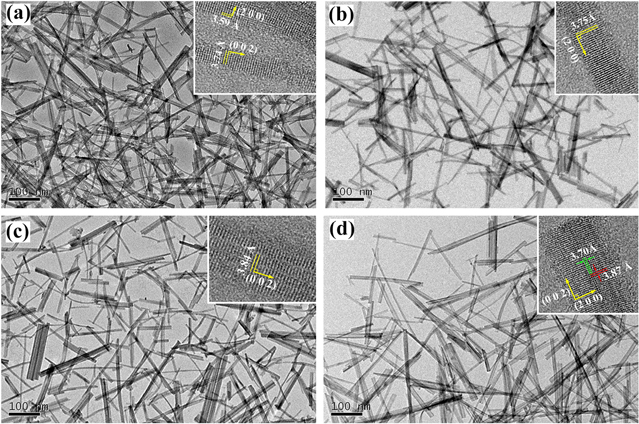
Figure 4. TEM images of (a) WO3, (b) Li-monodoped WO3, (c) K-monodoped WO3 and (d) (Li,K)-codoped WO3. Inset: HRTEM image of each product.
Download figure:
Standard image High-resolution imageFTIR spectra of pristine hex-WO3 and HTBs in the range of 500–1700 cm−1 are presented in figure 5. The bands centered around 3432 cm−1 (not shown here) and 1620 cm−1 can be observed in all the samples, which are assigned to the bending and stretching vibrations of absorbed water molecules, respectively [28]. For the hex-WO3, a broad band at 792 cm−1 can be found, corresponding to the stretching vibration of the W–O–W bridges [29]. After monodoping with Li or K and codoping with (Li,K), it shifts to a high frequency (around 828 cm−1) and some new peaks at lower frequencies (around 730 cm−1, 661 cm−1, and 590 cm−1) appear, which are also assigned to the stretching of the O–W–O bridges [30]. These changes can be attributed to the structure distortions of WO6 octahedra, resulted from the lengthening and shortening of the W–O bonds [31, 32]. In addition, sulfate ions and EG molecules can be excluded since they are not detected.

Figure 5. FTIR spectra of (a) WO3, (b) Li-monodoped WO3, (c) K-monodoped WO3 and (d) (Li,K)-codoped WO3.
Download figure:
Standard image High-resolution imageThe surface chemical composition of the samples was determined by XPS characterization. The XPS wide scan spectrum of (Li,K)–WO3 is shown in figure 6(a). Elements of W, O, Li and K can be clearly observed and the existence of C should be attributed to atmospheric contamination. In figure 6(b), the Li 1s signal (50.3 eV) appears after lithium doping, which is in good agreement with the reported XPS results of Li in MoO3 and V2O5 [33, 34]. The spin–orbit doublet of K (figure 6(c)) consists of two peaks, a K 2p3/2 component (294.1 eV) and a K 2p1/2 component (291.4 eV), suggesting that K is in the 1+ valence state. Figures 6(d)–(g) show the W 4f core-level spectra of different samples. For WO3, its W 4f doublet corresponding to W 4f 5/2 and W 4f 7/2 is located at 38.1 eV and 36.0 eV, respectively, which is a typical W+6 oxidation state [35]. However, the W 4f 5/2 and W 4f7/2 move toward a lower binding energy after alkali metal doping, indicating that W in HTBs can have a mixed valence of W5+ and W6+ [36]. Through the deconvolution of W 4f-line (peak ratio and spin–orbit splitting fixed at 3:4 and 2.1 eV), the percentage content of W5+ defects is 0%, 33%, 26% and 43% for WO3, Li–WO3, K–WO3, and (Li,K)–WO3, respectively. This implies that the free electron concentration is different in each as-prepared sample, which is consistent with the results of our DFT calculations. The element contents measured by XPS are listed in table S2.

Figure 6. (a) Full range XPS spectrum of (Li,K)-codoped WO3. (b) XPS spectra of Li 1s in different products. (c) XPS spectra of K 2p in different products. (d)–(g) XPS W 4f spectra of different products and their peak fitting.
Download figure:
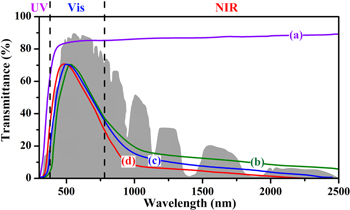
Standard image High-resolution imageFigure 7 displays the transmittance spectra of the films coated by different samples. Because of the wide band gap and empty conduction band, the WO3 film shows a high transmittance in the Vis–NIR range. In contrast, films coated with Li–WO3, K–WO3 and (Li,K)–WO3 retain relatively high transparency in Vis (approximately 71%) and a strong shielding ability in NIR range. A blueshift of the transmittance peak and the strongest NIR shielding ability is found in (Li,K)–WO3. The reason that Li–WO3 exhibits a better NIR shielding performance than K–WO3 is that more Li is incorporated into the WO3 than K which induces a high concentration of low-valence tungsten ions. This seems to be contradictory to our theoretical prediction, as it should be noted that the dopant concentration in each monodoped case is the same. Because the shapes and sizes of the nanocrystals in the different products are similar, the influence of the two factors may be insignificant in the comparison of the optical properties for different HTBs in this work.
Figure 7. Transmittance spectra of the films containing (a) WO3, (b) K-monodoped WO3, (c) Li-monodoped WO3 and (d) (Li,K)-codoped WO3. The gray area is the AM 1.5 solar spectrum.
Download figure:
Standard image High-resolution image
Several models have been proposed to explain the NIR shielding mechanism of doped semiconductors. Among them, small polaron model and localized surface plasmon resonance absorption are the most extensively accepted theories. In these two theories, the NIR shielding is intimately related to the free electrons. In the former model, small polarons are generated by the free electrons and the accompanied lattice distortions, and the absorption of NIR light can assist the hopping of small polarons from W5+ to nearby W6+ [37]. On the other side, the collective oscillations of conduction band electrons in response to external electromagnetic waves is the cause of the major absorption of NIR in heavily doped semiconductors [38, 39]. Through the combination of theoretical calculations and experimental analyses, we believed that the high concentration of free electrons leads to the enhanced NIR shielding properties of (Li,K)–WO3.
The AFM technique was used to investigate the coated films (figure S4). The two-dimensional AFM images clearly show that the surface layers of the films are composed of many rod-like particles. These nanorods are 5–10 nm in diameter and hundreds of nanometers in length, which agrees well with the TEM results shown before. According to the cross section analyses (figure S4(c)), the maximum peak–valley distance is less than 100 nm, showing that the surface of the film is uniform and smooth.
4. Conclusion
In summary, a new semiconductor material, (Li,K)-codoped WO3, with an enhanced NIR shielding ability was proposed by hybrid DFT calculations and further validated by experiments. Through the calculated absorption coefficients and electronic structure, the (Li,K)-codoped WO3 was superior in NIR absorption compared to Li-monodoped, K-monodoped and pure WO3, which may be due to the increase in the electron in conduction band. Moreover, (Li,K)-codoped WO3 was synthesized for the first time through an EG reduction approach using non-toxic tungstic acid precursors, and K2SO4 and Li2SO4 as dopants. Optical tests demonstrated that an enhanced NIR shielding ability is achieved after the incorporation of Li and K, compared to Li-monodoped and K-monodoped WO3, which confirms our theoretical predictions. It is expected that (Li,K)-codoped WO3 is a promising candidate for smart windows in applications for energy-saving buildings.
Acknowledgments
This research is supported by the National Natural Science Foundation of China (No. 21476024), the National Key Technology Support Program (2014BAE12B01) and the Beijing Municipal Science and Technology Project (Z151100003315005).