

Abstract
Using a plasma jet composed of two needle electrodes, a laminar plasma plume with large volume is generated in air through an alternating current voltage excitation. Based on high-speed photography, a train of filaments is observed to propagate periodically away from their birth place along the gas flow. The laminar plume is in fact a temporal superposition of the arched filament train. The filament consists of a negative glow near the real time cathode, a positive column near the real time anode, and a Faraday dark space between them. It has been found that the propagation velocity of the filament increases with increasing the gas flow rate. Furthermore, the filament lifetime tends to follow a normal distribution (Gaussian distribution). The most probable lifetime decreases with increasing the gas flow rate or decreasing the averaged peak voltage. Results also indicate that the real time peak current decreases and the real time peak voltage increases with the propagation of the filament along the gas flow. The voltage-current curve indicates that, in every discharge cycle, the filament evolves from a Townsend discharge to a glow one and then the discharge quenches. Characteristic regions including a negative glow, a Faraday dark space, and a positive column can be discerned from the discharge filament. Furthermore, the plasma parameters such as the electron density, the vibrational temperature and the gas temperature are investigated based on the optical spectrum emitted from the laminar plume.
Export citation and abstract BibTeX RIS
1. Introduction
In recent years, research on atmospheric pressure uniform discharge (APUD) has become a hot topic in plasma science, mostly due to its good uniformity and high efficiency for plasma chemical reaction. APUD has a variety of application fields such as film deposition [1, 2], surface modification [3, 4], decontamination and sterilization [5, 6], plasma medical treatment [7, 8] and wound healing [9–11].
An obstacle to realizing APUD is the glow-to-arc transition because of high gas temperature and gas chemistry (the reactions mainly related to oxygen) [12]. To inhibit this transition, the crucial point is to control the discharge current increment [13, 14]. Dielectric barrier discharge (DBD) has become a good candidate for APUD because the introduction of the dielectric layer can suppress the current increment [15]. However, uniform DBDs are only achieved in a narrow electrode-separation, usually in several millimeters [16]. Therefore, they are not desirable because the scale of the work-piece to be treated is confined by the narrow gap. In order to eliminate the scale confinement in uniform DBD, a variety of atmosphere pressure plasma jets (APPJs) have been proposed [17–19]. APPJs can generate a uniform plasma plume in open space [20]. However, for the majority of APPJs, the profile of light emission area typically covers only a few square millimeters [21, 22], which is too small for large-scale surface treatments.
Fortunately, several attempts have succeeded in generating laminar plumes with a relatively large volume [21, 23]. A direct current (DC) brush-shaped plasma plume is generated by blowing argon through two cylindrical electrodes, and bacterial inactivation has been investigated for this glow discharge plasma [24, 25]. With the same discharge device, Tang et al have investigated the discharge characteristics in detail, such as the voltage–current curve, the electron density, and the reactive species [26]. Furthermore, self-pulsing phenomenon has been observed for the dc-excited argon plasma brush, and the uniform plume results from the fast movement of the decaying plasma along the gas flow direction [27]. Using a half-confined dielectric barrier duct, a laminar plume is generated with an argon and oxygen mixture as the working gas [28]. For the plasma plumes mentioned above, the noble gas is indispensible. The large-volume plumes with less expensive gases, such as air, are more desirable. A dc-excited uniform plume has been generated by blowing air through two platinum pin-electrodes spaced by 5 mm, however, the air needs to be preheated to about 2000 K [29]. A dc-excited air plasma brush has been investigated, and the brush-shaped plume results from the afterglow of the gliding arc discharge [30]. A ballast resistor is an indispensable component of the dc discharge circuit for suppressing the current increment [26, 30]. Therefore, considerable energy is wasted through the Joule heat of the ballast resistor and these deficiencies limit their wide use in the medical and industrial fields.
In this paper, without any ballast resistor, a laminar air plasma plume with a relatively large volume is generated in an ambient atmosphere through an alternating current (ac) excitation. Based on high-speed photography, electrical measurement, and optical emission spectroscopy, the discharge characteristics of the laminar plume are investigated in detail.
2. Experimental setup
Figure 1 presents the schematic of the experimental setup. Ambient air with humidity of about 40%–50% is forced into a hollow ceramic duct with a rectangular cross section. The air flow rate is controlled by a mass flowmeter in the range from 0–10 L min−1, and 8.0 L/min is used if no special explanation is given. The length of the rectangular duct is about 60 mm. Its inner and outer cross sections are 1.0 mm × 7.0 mm and 3.0 mm × 10 mm, respectively. Two tungsten needles spaced by 7.0 mm are located outside the free end (nozzle) of the duct. The tungsten needles are about 1 mm in diameter and its tip diameter is about 200 μm. One of the needles is connected to the high voltage output of an alternating current (ac) power supply (Suman, CTP-2000K, 57 KHz), and the other is grounded. The discharge current and the applied voltage across the two electrodes are measured simultaneously by a current probe (Tektronix TCP312A) and a high voltage probe (Tektronix P6015A), respectively. A photomultiplier tube (ET 9085SB) is used to detect the light emission from the discharge. The waveforms of the applied voltage, the discharge current, and the light emission are recorded by a digital oscilloscope (Tektronix DPO4104). A digital camera (Canon EOS 7D), a high-speed video camera (Cooke, Pco.dimax), and an ICCD (Andor DH334) are used to record the discharge images. Their exposure time is in the range 1/8000 s–30 s, 1.5 μs–40 ms, and 3 ns–10 s, respectively. The oscilloscope and the ICCD can be synchronized by an external trigger (Tektronix AFG3021). Therefore, the waveforms of the applied voltage and the discharge current as well as the discharge image can be captured simultaneously. The light emission from the discharge is focused onto an optical fiber and transmitted into the entrance slit of a spectrometer (ACTON SP2758, CCD:1340 × 400 pixels) with a grating of 2400 mm−1 grooves. The entrance slit width of the spectrometer is maintained at 0.05 mm and the integration time of the CCD is 3 ms.
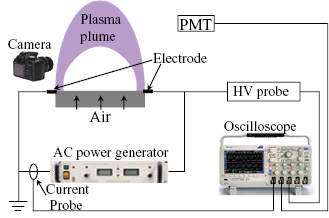
Figure 1. Schematic diagram of the experimental setup, PMT represents the photomultiplier tube.
Download figure:
Standard image High-resolution image3. Results and discussion
3.1. Discharge photography
When the peak value of the applied voltage is increased, a corona discharge is first ignited in the vicinity of the two needle tips, as shown in figure 2(a). When the peak value of the applied voltage is increased, the length of the corona increases, as shown in figure 2(b), until a corona filament bridges the two electrodes (figure 2(c)). The purple corona filament lies very straight and stably at the gas outlet. When the output power of the source is increased further, a uniform laminar plasma plume is formed outside the duct nozzle in the downstream region of the air flow with the gas flow rate larger than 4 L min−1, as shown in figure 2(d). When the power is increased further, the laminar plasma plume becomes brighter, as shown in figure 2(e). For the corona discharges, the current peak value ( ) and the voltage peak value (
 ) are invariant under a constant output power of the source. However, they fluctuate with time for the laminar plume discharge. Hence, an averaged peak voltage (
 ) is used for the laminar plume by averaging its maximum and minimum.
  is 3.6 kV for all of the following results if no special explanation is given. It is worth pointing out that for a gas flow rate lower than 4 l min−1, a stationary discharge filament takes the place of the laminar plume under high output power, as shown in figure 2(f).
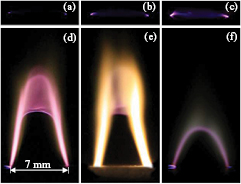
Figure 2. Discharge images under different voltages,  is 7.1 kV (a), 7.6 kV (b), 8.3 kV (c), and
  is 3.6 kV (d), 4.5 kV (e), 4.5 kV (f). Captured by Canon camera with an exposure time of 0.1 s in (a)–(c), and 1 ms in (d)–(f), respectively. The gas flow rate in (f) is 2 L min−1.
Download figure:
Standard image High-resolution imageFigure 3 presents the images of the uniform laminar air plasma plume taken at different delay times ( ) using the high-speed video camera. Obviously, only some filaments in an arched shape can be observed between the two electrodes. The first image (0 μs) corresponds to the birth moment of a discharge filament. It can be found that the filament propagates along the gas flow direction by comparing the images at different moments. At 588 μs, some new discharges tend to appear on one side of the filament, where a new filament (next generation filament) will be born. At 630 μs, the newborn filament is visible. At 672 μs, it moves away from its birth place with the disappearance of the father filament. Obviously, the laminar plume in figure 2(d) is a train of moving filaments, which are temporally superposed.
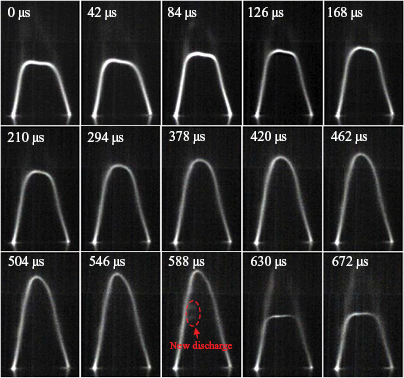
Figure 3. Discharge images of the laminar plume taken at different delay times with an exposure time of 10 μs.
Download figure:
Standard image High-resolution imageThe applied voltage (U) between the two electrodes can be depicted by the line integral of the electric field (E) as:  . Here, l is the length of the integral path. Obviously, the shortest length exists in the vicinity of the nozzle; therefore, the electric field has its maximal value at the nozzle and decreases with increasing distance along the gas flow. That is to say, the new filament tends to be born at the nozzle if only the applied electric field is considered. However, the birth place of the new filament is not at the nozzle, but at a certain distance in the downstream region. Therefore, an additional mechanism must be considered. Obviously, ultraviolet photons emitted from the discharge filament can produce seed electrons in its surrounding places through photo-ionization [31]. Apparently, a new discharge filament tends to be generated at the place where the highest density of seed electrons exists. Under the mutual effects of the applied field and the photo-ionization, a new filament will be born at a certain distance away from the nozzle.
The propagation velocity of the filament can be calculated by dividing the filament propagation distance by the time span. Figure 4 shows the filament propagation velocity as a function of the gas flow rate. Apparently, the filament propagation velocity increases roughly from 9 m s−1 to 20 m s−1 with increasing the gas flow rate, which is slightly lower than the gas flow velocity. This result implies that the filament propagation in the plume region is mostly a gas flow phenomenon [32]. Consequently, the filaments are blown out and propagate away from their original place because of the gas flow.

Figure 4. Filament propagation velocity as a function of the gas flow rate.
Download figure:
Standard image High-resolution imageThe filament lifetime distribution is shown in figure 5(a). It can be found that the filament lifetime almost follows a normal (or Gaussian) distribution, which is a bell-shaped curve [33]. The most probable filament lifetime is about 525 μs with a  of 3.6 kV and a gas flow rate of 8 L min−1. Figures 5(b) and (c) present the filament lifetime as a function of the gas flow rate and the averaged peak voltage, respectively. Obviously, the filament lifetime decreases with increasing the gas flow rate or decreasing the averaged peak voltage. As mentioned before, the electric field decreases along the air flow direction. The filament discharge cannot be sustained at the end of the plume (a certain distance away from the nozzle), where the electric field is lower than the threshold that can maintain the filament discharge. Obviously, the most probable filament lifetime is determined by the filament propagation velocity and the distance between its birth place and the end position. With increasing the gas flow rate, the filament propagation velocity increases; however, its birth place and end position remain almost unchanged. Hence, the most probable filament lifetime decreases with increasing the gas flow rate. The electric field increases with increasing the averaged peak voltage, and the end position will move further away from the gas nozzle. Therefore, the propagate distance will increases with increasing
  . Consequently, the most probable filament lifetime increases with increasing
  .
.

Figure 5. (a) Distribution of the filament lifetime in the laminar plume. The most probable lifetime as a function of the gas flow rate (b) and  (c).
(c).
Download figure:
Standard image High-resolution image3.2. Electrical measurements
Figure 6 presents the waveforms of the applied voltage, the discharge current, and the light emission signal from the discharge for the two distinct discharge modes. Under low voltage, the corona discharge is characterized by one pulse per half voltage cycle in both the discharge current and the light emission, as shown in figure 6(a). With increasing the peak voltage, the pulse number per half voltage cycle increases, as shown in figure 6(b). Moreover, the discharge pulses are stochastically distributed with time. For the uniform laminar plume mode, a hump appears per half voltage cycle in both the discharge current and the light emission, as shown in figure 6(c). The waveforms in figure 6(c) suggest that the filament ignites and quenches once per half voltage cycle. Considering the filament lifetime in figure 3 is much longer than the voltage cycle, it can be concluded that the filament ignites and quenches repeatedly during its propagation.
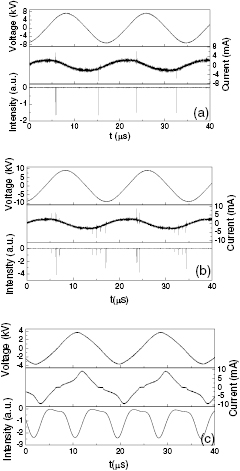
Figure 6. Waveforms of the applied voltage, the discharge current and the light emission, (a) and (b) correspond to the corona discharge, and (c) corresponds to the plume discharge.
Download figure:
Standard image High-resolution imageBoth  and
and  fluctuate with time even under constant experimental parameters for the laminar plume discharge. Therefore, the oscilloscope and the ICCD are synchronized by the external trigger to implement a simultaneous recording of the voltage waveform and the current waveform as well as the discharge image. Figure 7 indicates
  and
and  as a function of the filament length estimated from the discharge image. Under a constant
  (about 3.6 kV), it can be found that
  decreases, while
  increases with increasing the filament length. Suppose that the filament can be regarded as a resistor with resistance R, then
  can be given by:
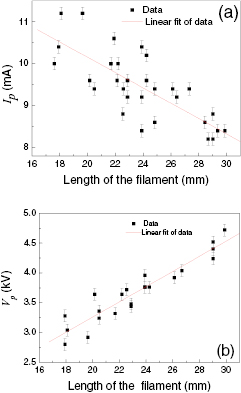
Figure 7. Instantaneous peak current (a) and peak voltage (b) as a function of the filament length.  is about 3.6 kV.
Download figure:
Standard image High-resolution imageHere,  is the peak value of the electromotive force for the ac source and
  is the resistance of the other parts in the electric circuit. Vp is given by:
From equations (1) and (2), it can be deduced that  decreases and
  increases with increasing the filament length because R increases with it.
As mentioned before, the filament ignites and quenches once per half voltage cycle for the laminar plume in figure 6(c). From figure 6(c), the voltage and current characteristic per single discharge (half voltage cycle) can be obtained for the uniform laminar plume, as shown in figure 8(a). The corresponding filament is about 24 mm in length. It can be found from figure 8(a) that the voltage–current curve has a positive slope (Zone I), which means that it is a Townsend discharge at the beginning [13]. With increasing the discharge current, a slightly negative slope appears in the voltage–current curve (Zone II). The negative slope is an indication of a glow discharge. Furthermore, the current density is about 10 A cm−2 with a 9 mA discharge current, which conforms to a glow discharge [34]. In Zone III, the applied voltage as well as the discharge current decreases until the discharge quenches. Figure 8(b) shows an enlarged part of an ICCD image for the 24 mm-long filament taken at the moment of discharge current peak. There is a negative glow near the instantaneous cathode, a positive column, and a Faraday dark space between them. The negative glow is relatively brighter than the positive column. The anode glow is hardly discernable, which is similar to that in a dc-excited plasma jet [35]. These characteristic regions in figure 8(b) also indicate that atmospheric pressure glow discharge is realized for the laminar plume.

Figure 8. (a) Voltage–current characteristics of a 24 mm long filament, (b) enlarged discharge image near the two electrodes at the moment of the current peak (captured by ICCD with an exposure time of 1 μs).
Download figure:
Standard image High-resolution imageIt is well known that inhibiting the transition from glow to arc is crucial for the realization of atmospheric pressure glow discharge. It is believed that two factors are important for inhibiting the transition. One is the direct cooling of the filament by the flowing gas. The other is related to the intermittent characteristic of the discharge because the filament can cool itself down to a low temperature between two consecutive discharges.
3.3. Plasma parameters diagnosis
An optical spectrum emitted from the laminar air plume is shown in figure 9(a). The spectral lines mainly include the 2nd positive system of N2 ( ), the 1st positive system of N2 (
 ), the band of the OH radical (
 ), the O atom at 777.4 nm, and
  at 656.3 nm. The oxygen atom comes mainly from the following reaction [35],

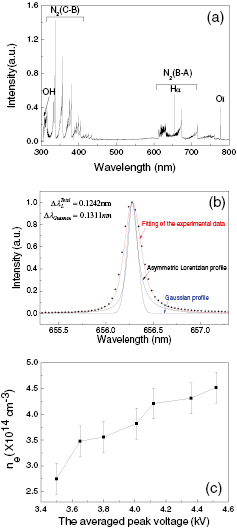
Figure 9. (a) Optical emission spectrum from the laminar plume, (b) de-convolution process of Hα (656.3 nm),  is 4.1 kV, (c) electron density as a function of
  .
.
Download figure:
Standard image High-resolution imageThe hydrogen atoms and hydroxyl radicals are considered to be from the dissociation of water vapor molecules. Considering the reaction coefficients, the most important reaction for hydrogen atom formation is:

The electron density can be estimated by:

Here, e is the electron charge, j is the current density, E is the electric field, and  is the electron mobility. The electric field is about 1.5 kV cm−1 through dividing the peak voltage (3.6 kV) by the filament length (24 mm). With an electron mobility of 4.3 × 102 cm2 (V·s)−1 at atmospheric pressure [32], the electron density is estimated to be on the order of 1 × 1014 cm−3. For such a high electron density, it is valid to obtain the electron density by Stark broadening of
  [36, 37].
During the discharge, the spectral line emitted from the plasma is subject to various broadening mechanisms such as natural broadening, Doppler broadening, instrumental broadening, van der Waals broadening, and Stark broadening. The natural broadening is generally negligible in high-density plasma [38]. The Doppler broadening follows a Gaussian profile [39]. The instrumental broadening is a convolution of the Gaussian profile and the asymmetrical Lorentzian profile [40]. The van der Waals broadening follows the Lorentzian profile and the Stark broadening of Hα follows the symmetrical Lorentzian profile. It is obvious that the sum of the van der Waals broadening, Stark broadening, and instrumental broadening is also an asymmetrical Lorentzian profile.
The total spectral line profile is the convolution of the Gaussian profile and asymmetrical Lorentzian profile L'(λ), and is described by [39]:
Where λG, w', d', and α' are fitted to the experiment data. A deconvolution procedure is used to separate the L'(λ) profile from the total spectral line profile [39]. Therefore, the FWHM (full width at half maximum) of the total Lorentzian profile  = 0.1242 nm can be obtained, as shown in figure 9(b).
The FWHM of the van der Waals broadening for the case of the atomic lines can be calculated by [17]:

Here, T = 1670 K is the gas temperature. Using the above equation, the van der Waals broadening is estimated to be 0.0284 nm.
As mentioned above, the instrumental broadening is the convolution of the Gaussian profile and the asymmetric Lorentzian profile. The FWHM of the asymmetric Lorentzian profile from the instrumental broadening is measured by a He-Ne laser and calculated by the deconvolution procedure to be 0. 0502 nm [40].
The FWHM of the Stark broadening can be calculated from [37, 39]:

Then, the electron density of the plasma (ne) can be calculated to be  with
with  = 0.0460 nm by the following formula [17].

Figure 9(c) shows the electron density as a function of the averaged peak voltage. It can be found that the electron density increases with increasing the averaged peak voltage.
The 2nd positive system of N2 is used to calculate the molecular vibrational temperature ( ), and the band from the OH radical can be used to calculate the rotational temperature (
 ), which is close to the gas temperature [41, 42].
  and
and  are investigated as a function of the averaged peak voltage and the gas flow rate, as shown in figure 10. It can be found that they all increase with increasing the averaged peak voltage under a constant gas flow rate,and decrease with increasing the gas flow rate under a constant averaged peak voltage. This phenomenon can be explained as follows. During the discharge process, electrons collide with nitrogen molecules or an OH radical, which results in energy transfer from the electrons to the nitrogen molecules and the OH radical. The energy balance of this exchange is determined by the electron density and the effective rate of energy exchange through inelastic collision (e.g. vibrational-rotational energy exchange), which gives rise to the vibrational and rotational temperature increase of the neutral molecules [26, 43]. With increasing the averaged peak voltage, the electron density increases; therefore, the collision frequency increases. Hence, more energy is transferred to the nitrogen molecules and OH radical. Consequently, the vibrational temperature and the rotational temperature increase with increasing the averaged peak voltage. On the other hand, the flowing gas can cool the discharge. Consequently, the vibrational temperature and the rotational temperature decrease with increasing the gas flow rate.

Figure 10. The vibrational temperature and the rotational temperature of the laminar plasma plume as a function of  (a) and the gas flow rate (b).
Download figure:
Standard image High-resolution image
4. Conclusions
In conclusion, an ac-excited laminar plasma plume with a fairly large volume is generated at atmospheric pressure with ambient air used as the working gas. The results show that the laminar plasma plume is in fact a temporal superposition of a train of moving discharge filaments, which are blown out from their birth place by the air flow. The filament propagation velocity increases with increasing the gas flow rate. The filament lifetime, much longer than the discharge cycle, tends to follow a normal distribution. The most probable filament lifetime decreases with increasing the gas flow rate. However, it increases with increasing the averaged peak voltage. Along with the filament propagation, its length increases; meanwhile the real time peak voltage increases and the real time peak current decreases. The voltage–current characteristic indicates that the filament evolves from a Townsend discharge to a glow discharge, then the discharge quenches per half voltage cycle. For the moment of current peak, characteristic regions including a negative glow, a Faraday dark space, and a positive column can be discerned. The optical spectra emitted from the laminar plume mainly include the emission lines from the 2nd positive system of N2, the band of the OH radical ( ), the O atom and
  . The electron density, the vibrational temperature, and the rotational temperature are investigated based on the optical emission spectrum. It is found that the electron density increases with increasing the averaged peak voltage. Both the vibrational temperature and the rotational temperature increase with increasing the average peak voltage and decreasing the gas flow rate.
Acknowledgments
This paper is sponsored by the National Natural Science Foundation of China under Grant Nos. 10805013, 11575050, Funds for Distinguished Young Scientists of Hebei province under Grant No. A2012201045, Department of Education for Outstanding Youth Project under Grant No. Y2011120, and the Research Foundation of Education Bureau of the Hebei province, China, under Grant No. LJRC011.