
Abstract
There has been increasing interest in using the nonlinear features of acousto-ultrasonic (AU) waves to detect damage onset (e.g., micro-fatigue cracks) due to their high sensitivity to damage with small dimensions. However, most existing approaches are able to infer the existence of fatigue damage qualitatively, but fail to further ascertain its location and severity. A damage characterization approach, in conjunction with the use of an active piezoelectric sensor network, was established, capable of evaluating fatigue cracks in a quantitative manner (including the co-presence of multiple fatigue cracks, and their individual locations and severities). Fundamental investigations, using both experiment and enhanced finite element analysis dedicated to the simulation of nonlinear AU waves, were carried out to link the accumulation of nonlinearities extracted from high-order AU waves to the characteristic parameters of a fatigue crack. A probability-based diagnostic imaging algorithm was developed, facilitating an intuitive presentation of identification results in images. The approach was verified experimentally by evaluating multi-fatigue cracks near rivet holes of a fatigued aluminum plate, showing satisfactory precision in characterizing real, barely visible fatigue cracks. Compared with existing methods, this approach innovatively (i) uses permanently integrated active sensor networks, conducive to automatic and online health monitoring; (ii) characterizes fatigue cracks at a quantitative level; (iii) allows detection of multiple fatigue cracks; and (iv) visualizes identification results in intuitive images.
Export citation and abstract BibTeX RIS
1. Introduction
Engineering materials and structures experience continuous accumulation of fatigue damage, deteriorating gradually over the lifespan. Such a concern is particularly accentuated for transportation vehicles, as fatigue damage can, under cyclic loads, develop to critical degrees at an alarming rate without sufficient warning, leading to catastrophic consequences. The Eschede train crash (1998), the worst high-speed train disaster hitherto, was attributed to fatigue cracks in the wheel rims under repeated loads (500 000/day) [1]. The longer a structure is in service, the more fatigue cracks it may develop. With safety a paramount priority for all engineering structures, reliability and integrity criteria must be strictly met, and this has entailed remarkable development of non-destructive evaluation (NDE) and, recently, structural health monitoring (SHM) techniques [2]. Successful implementation of NDE and SHM to ageing structures can effectively enhance safety, drive down exorbitant maintenance costs and extend residual service life.
Amongst various types of NDE and SHM, acousto-ultrasonics, a combination of acoustic-emission and ultrasonic characterization, has proven its effectiveness in achieving a reasonable compromise among resolution, practicality and detectability [3–8]. Of particular interest are Lamb waves, acousto-ultrasonic (AU) waves confined in thin sheet-like structures. Possessing features including strong penetration, fast propagation, omnidirectional dissemination and high sensitivity to damage, Lamb waves have been intensively employed to develop diverse acousto-ultrasonics-based NDE and SHM [9–15]. Most existing approaches rely substantially on linear macroscopic wave scattering (e.g., wave attenuation, reflection, transmission or mode conversion) upon the incident waves interacting with damage. They can be used to evaluate gross damage (e.g., through-hole, open crack or void) with dimensions comparable to the AU wavelength.
However, real-world structural damage initiates from the damage precursors at unperceivable levels (e.g., fatigue cracks), and becomes conspicuous quite late (after 80% of the total life for most metallic materials [16]). Under cyclic loads, fatigue cracks present nonlinear characteristics, which, unfortunately, may not be well evidenced in linear macroscopic changes of AU waves, because interaction between the incident AU waves and a fine fatigue crack (much smaller than the AU wavelength) would not lead to considerable wave scattering [17]. One can increase the frequency of incident AU waves to reach a reduced wavelength, but this is at the expense of introducing additional complexity in the signal's appearance due to the multimodal and dispersive properties of AU waves at high frequencies. Therefore, when dealing with fine fatigue cracks, acousto-ultrasonics relying on linear macroscopic wave scattering may lose its effectiveness and practicability.
To overcome the above deficiencies, nonlinear acousto-ultrasonics has been increasingly attempted, to take advantage of the nonlinear features of AU waves associated with fatigue damage. This has been motivated by the fact that dislocations of a fatigue crack give rise to nonlinearity, shifting the incident AU wave energy from the excitation frequencies to other frequency bands. The key approaches can be grouped into three categories in general:
(1) based on high-order harmonic or sub-harmonic generation
Fatigue damage causes a certain shift of incident AU wave energy from the driving to other frequency bands, leading to sub-harmonic or high-order harmonic generation [18–22]. In particular, second harmonic generation has been widely used because the nonlinear effects at the third or higher-orders are often imperceptible. By scrutinizing either sub-harmonic or high-order harmonic generation, the existence of fatigue damage can be detected.
(2) based on mixed frequency responses
Also known as nonlinear wave modulation spectroscopy [19], methods in this category use low-frequency but high-magnitude structural vibration to modulate high-frequency but weak-magnitude AU waves [23]. During the dilation phase of the low-frequency cycle, AU waves are partially decoupled by the open crack, reducing the wave magnitude when waves traverse the crack; in the other half cycle, the closed crack does not interrupt the waves. Both phases jointly cause amplitude modulation of the AU waves, leading to a series of sidebands around the wave excitation frequency in the spectrum. These approaches can also be used to indicate the presence of fatigue damage.
(3) based on shift of resonance frequency
This category probes a shift in the resonance frequency of the medium when AU waves traverse it, to obtain a measure of the degradation of the medium due to the existence of fatigue damage. As an example, nonlinear resonant ultrasound spectroscopy (NRUS) [24] explores the dependence of the resonance frequency on the strain amplitude, and any detected changes in the resonance frequency properly reflect the existence of fatigue damage.
Other efforts making use of nonlinear features of AU waves also include those based on nonlinear surface waves [25], contact acoustic nonlinearity (CAN) [26], dual frequency mixing [27] or time reversal [28], etc. Despite their demonstrated effectiveness in indicating the existence of fatigue damage, most approaches suffer from drawbacks when used for developing automatic SHM techniques, because of:
- (1)the use of bulky probes, moving back and forth to generate/acquire AU waves. In SHM, permanently integrated sensors with minor structural intrusion are preferred;
- (2)the reliance on limited information rendered by a pair of isolated probes, therefore failing to describe the integrity of the whole structure;
- (3)detection only at a qualitative level (inferring the existence of fatigue damage only), because of the lack of concrete algorithms to reach a quantitative description of the fatigue damage; and
- (4)by the same token, their inapplicability in identifying multiple fatigue cracks.
Envisaging the above-mentioned deficiencies of the existing nonlinear acousto-ultrasonics when used for SHM, a damage characterization approach in conjunction with the use of an active piezoelectric sensor network was motivated. AU waves were activated and acquired using the active sensor network, from which signal features associated with the nonlinearities of high-order AU waves were extracted, endowing the approach with a particular capacity for evaluating fatigue cracks in a quantitative manner (including the co-presence of multi-cracks, and their individual locations and severities). Using experimental investigation and an enhanced finite element (FE) simulation, fundamental studies were carried out to establish a quantitative correlation between (i) a self-defined acoustic nonlinearity factor calculated via a particular sensing path in the sensor network and (ii) the offset distance from a fatigue crack to that sensing path. To present results intuitively, a probability-based diagnostic imaging algorithm was developed. The effectiveness of the approach was examined by characterizing multiple barely visible fatigue cracks near rivet holes of a fatigued aluminum plate.
2. Nonlinear attributes of AU waves for characterizing fatigue crack
When propagating in an elastic medium, AU waves are distorted to a certain degree by the inherent nonlinearities of the medium, producing high-order harmonics in the captured wave signals. This reflects the nonlinear elastic properties inherently possessed by the material, which can be described using the nonlinear stress–strain relationship governed by nonlinear terms (see section 2.1). Once a fatigue crack exists, the micro-structures of the medium are altered by dislocations of the fatigue crack; when the AU wave traverses the crack, the imperfect interface contacting of the fatigue crack introduces additional nonlinearity to AU waves (by this token the fatigue crack is often interpreted as 'breathing cracks'). That is because when AU waves reach the interface of the fatigue crack, the compressional part of waves penetrates the interface, whereas the tensile part is blocked, resulting in a localized nonlinear behaviour (i.e., CAN aforementioned). Inversely, by perceiving these nonlinear properties manifested in AU wave signals, a fatigue crack can, in principle, be revealed. Both material nonlinearities and CAN are responsible for the major nonlinearities of AU wave signals. Deterioration and accumulation of fatigue damage (i.e., nucleating and growing) incurs further changes in these nonlinearities. This is the premise warranting the use of nonlinearities extracted from AU waves for characterizing fatigue damage in this study.
2.1. Theoretical principle
Without loss of generality, consider a one-dimensional rod guiding a longitudinal wave mode. By ignoring the wave attenuation and dispersion, the wave can be defined by
where ρ is the medium density, u(x,t) the particle displacement at location x and moment t (abbreviated as u in what follows; u is namely a captured AU wave signal), and σ the normal stress. Taking into account the medium nonlinearity, the nonlinear Hooke's law reads [29]

where E is the modulus of elasticity of the medium, ε the normal strain and β the second-order nonlinear elastic coefficient (β is called acoustic nonlinearity factor hereinafter). Substituting equations (2) into (1) and neglecting the terms higher than the second order (due to their minute contribution to σ), it gives rise to

To solve equation (3), a perturbation theory [30] is applied, in which u is re-defined as

where u0 represents the incident AU wave, a zero-order term governing the linear components of u, and u1 is the first-order perturbation accounting for the nonlinear components of u. Substituting equations (4) into (3) leads to
Because the nonlinear term in equation (5) (i.e.,  ) is sufficiently small when compared to the linear term (i.e.,
  ), one has,
By substituting equations (6) into (5), one obtains

Provided u1 << u0 (nonlinear attributes in the medium are considerably weaker than linear attributes), equation (7) reduces to

Assume u0 to be a harmonic wave with a mono-frequency of ω, as

where k is the wavenumber, and Γ1 represents the magnitude of the first-order harmonic wave, which is called the primary wave mode in what follows. With equation (9), the corresponding perturbation solution to equation (8) can be obtained as

or, if denoting  as Γ2,

Equation (10) reveals that the nonlinear component u1 with a magnitude of Γ2, characterizing the nonlinear attributes of the captured AU wave signal, has a nominal frequency of 2ω—double that of the excitation frequency. This implies that the medium nonlinearity distorts an incident mono-frequency AU wave, resulting in an energy shift to higher frequencies (integer multiples of the excitation frequency), a phenomenon defined as acoustic nonlinearity [18]. The wave components at higher frequencies are collectively referred to as higher-order harmonics of the primary wave mode, and in particular the one with the double driving frequency (2ω) is the second harmonic wave mode. From equation (10), one has
Therefore, β, the acoustic nonlinearity factor hereinafter, links the magnitudes of the primary (Γ1) and second harmonic wave modes (Γ2) to the propagation distance (x).
2.2. Relative acoustic nonlinearity factor
The acoustic nonlinearity factor defined by equation (11) was derived for longitudinal waves propagating in a one-dimensional rod. Regulated by a scaling parameter (γ), such a factor can be extended to Lamb waves in plates as detailed elsewhere [20, 29, 30], as
Because γ depends in a complex manner on the material and geometric parameters of the medium, a relative acoustic nonlinearity factor, β', is introduced in this study, in recognition of the fact that a medium has an unchanged γ at a given propagation distance of AU waves before and after the occurrence of fatigue damage. This factor reads
This relative acoustic nonlinearity factor introduces additional benefits to fatigue damage characterization: (i) in principle, the characterization is independent of a benchmark structure and a baseline signal, because the process is based on the detection of any abnormal increase in β' due to fatigue damage, which is considerably minute in a pristine benchmark (without fatigue damage). In other words, the nonlinearity manifested in a captured AU wave signal contributed by the material itself is insignificant compared with that arising from the fatigue damage (to be demonstrated in section 3.3), and therefore once any singular increase in β' detected, fatigue damage is deemed existent; (ii) it minimizes the influence of the material and geometric diversity of the medium on AU nonlinearity; and (iii) it avoids the involvement of wave propagation distance as seen in equation (12).
2.3. Mode selection
To assure considerable generation and accumulation of the desired second harmonic of AU waves, the primary and second harmonic wave modes should conform to the following cardinal prerequisites: (i) synchronism: both the phase and the group velocities of the primary wave mode match those of the second harmonic wave mode, respectively, thus guaranteeing the shift of AU energy from the primary to the second harmonic modes over propagation distance (thus the second harmonic mode becomes accumulative) [19, 31]; (ii) non-zero power flux: the primary mode is of the same type as the second harmonic mode (e.g., both are symmetric or both are anti-symmetric), thus ensuring a non-zero power transfer from the primary to the second harmonic modes. Any two wave modes meeting the above two conditions are referred to as a synchronous pair in this study; in contrast, power transfer from the primary to the second harmonic modes could not be efficiently achieved if the above two conditions were not satisfied.
Figure 1 shows the dispersion curves of AU Lamb waves in an aluminum plate, calculated using DISPERSE®. The mode pair (S1,S2) at (f = 3.57 MHz⋅mm, 2f = 7.14 MHz⋅mm)—the first-order (denoted by S1) and second-order (denoted by S2) symmetric Lamb modes, as highlighted in the figure—meets the prerequisites and forms a synchronous pair. In addition, at 3.57 MHz⋅mm and 7.14 MHz⋅mm, the S1 and S2 modes propagate at the highest speeds among all available modes, respectively, thus standing out from the other modes and avoiding spurious contributions from other wave modes to the second harmonic accumulation. Such a merit excludes other candidate synchronous pairs such as (S2,S4). For the selected synchronous pair, the magnitude of S1 at 3.57 MHz⋅mm corresponds to Γ1 in equation (13), while the magnitude of S2 at 7.14 MHz⋅mm corresponds to Γ2.
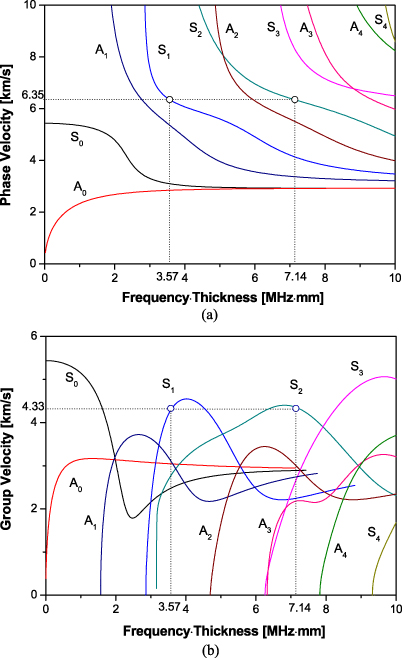
Figure 1. Dispersion curves of AU Lamb waves in an aluminum plate calculated using DISPERSE® (showing the selected synchronous pair (S1, S2)).
Download figure:
Standard image3. Fundamental study: relative acoustic nonlinearity factor versus measurement offset of sensing path
To characterize fatigue damage quantitatively, a fundamental investigation was first carried out to calibrate the influence of a fatigue crack on β'. An aluminum plate (measuring 400 × 240 × 4.5 mm3) with fixed-supported left and right edges was considered, as shown in figure 2. The plate bore a triangular notch (15 mm in base and 25 mm in height) at the centre of the upper plate edge, serving as a fatigue crack initiator. Ten circular piezoelectric lead zirconate titanate (PZT) wafers surface-mounted on the plate configured five actuator–sensor paths with different offset distances (od) from the crack initiator, as shown schematically in figure 2.
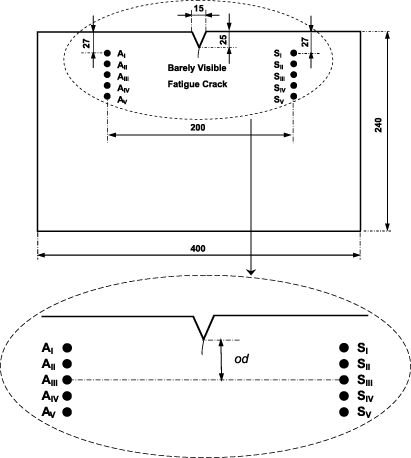
Figure 2. Schematic of the aluminum plate with a fatigue crack initiator (Ai and Si (i = I,II,III,IV,V): PZT wafers as actuators and sensors, respectively; od: offset distance between the crack initiator and a particular sensing path).
Download figure:
Standard image3.1. Experimental interrogation
The aluminum plate underwent a fatigue processing on a digitally controlled MTS testing platform (858 Mini Bionix), subject to a sinusoidal tensile load of 5 Hz. It took about 200 000 cycles to produce a barely visible fatigue crack (BVFC), circa 4 mm in length from the tip of the initiator, as seen in figure 3. Upon generation of the BVFC, ten circular PZT wafers (nominal diameter: 5 mm each) were surface-mounted on the fatigued plate, to form five actuator–sensor paths Ai − Si (i = I,II,III,IV,V), each having different od (0, 10, 20, 30, 40 mm, respectively). For each path, the distance between the actuator and the sensor was kept at 200 mm. Each path was instrumented with a signal generation and acquisition system [32]. 16-cycle Hanning-window-modulated sinusoidal tone bursts at a central frequency of 800 kHz were generated in MATLAB and downloaded to an arbitrary waveform generation unit (Agilent E1441). The signal was amplified with a high-frequency power amplifier (CIPRIAN US-TXP-3) to 80 Vp−p and applied on each actuator of the five sensing paths to generate AU waves. With the current plate thickness (4.5 mm), the excitation frequency of 800 kHz ensured generation of S1 as the primary wave mode (0.8 MHz × 4.5 mm = 3.57 MHz⋅mm), which constituted a synchronous pair with S2. The response signals (including S1 and S2) were acquired by the PZT sensor of each sensing path through a signal digitizer (Agilent E1438) at a sampling rate of 40 MHz.

Figure 3. A fatigued aluminum plate with five sensing paths (the same as the one in figure 2; bottom: a zoomed-in view of the vicinity of the generated BVFC).
Download figure:
Standard imageAs an example, the time domain signal acquired by path AI − SI is exhibited in figure 4(a). Often the captured signals present highly multimodal and dispersive natures, from which no straightforward signal features associated with fatigue damage can possibly be extracted directly. It is noteworthy that a tiny BVFC does not incur noticeable changes in linear macroscopic wave scattering, and thus no additional wave packets scattered from the BVFC or mode conversion can be detected in the signals. This once again accentuates that identification relying on linear macroscopic wave scattering may lose its effectiveness when used to detect fatigue damage. The signal in figure 4(a) was subsequently processed with the short-time Fourier transform (STFT) to obtain its time–frequency spectrogram, shown in figure 4(b), highlighting two major energy concentrations at the excitation frequency (circa 800 kHz) and twice the frequency (circa 1.6 MHz), respectively. The primary and second harmonic wave modes were extracted at their respective frequencies in figure 4(b) and re-constructed to the time domain, combined in figure 5 for comparison. From figure 5, Γ1 of S1 and Γ2 of S2 were determined to calculate β' using equation (13). Note that Γ2 is only 5% of Γ1, indicating the weakness of the second harmonic mode compared with the primary mode from which it is generated and accumulated. It is noteworthy that a certain discrepancy in the arrival time of the maximum energy between S1 and S2 can be noticed in figure 5, which can be attributed to possible errors while experimentally capturing two wave modes (as explained S2 is insignificant compared with S1) and extracting signal features using the designated signal processing tool.
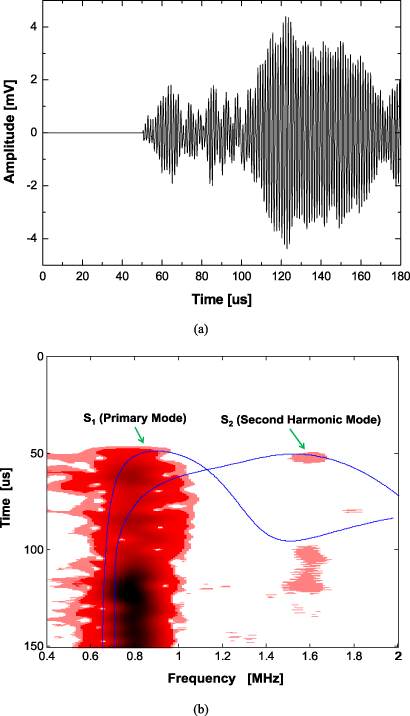
Figure 4. (a) A typical time domain signal in the experiment (acquired by sensing path AI − SI); (b) time–frequency spectrogram of the signal in (a) (integrated with dispersion curves).
Download figure:
Standard image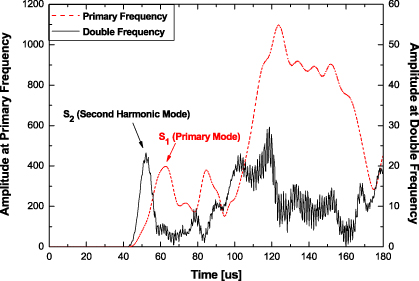
Figure 5. Combined slices of signal energy as a function of time captured by AI − SI and extracted at the primary (800 kHz) and second harmonic (1.6 MHz) frequency in the experiment.
Download figure:
Standard imageRepeating the above process, values of β' for all five sensing paths were calculated, contributing to a correlation curve between the relative acoustic nonlinearity factor of a particular sensing path and its od from the BVFC, after normalization with the one calculated via AI − SI, as shown in figure 6 (the solid line). In the figure, different values of od were normalized with regard to the AU wavelength (od/λ), making it possible to extend the discussion to general circumstances with other excitation frequencies.

Figure 6. Relative acoustic nonlinearity factor versus offset distance normalized by the AU wavelength (experiment and simulation data).
Download figure:
Standard image3.2. Simulation
Dynamic FE analysis was conducted in parallel using the commercial FE package ABAQUS®/EXPLICIT. The same aluminum plate was meshed at full scale using three-dimensional eight-node brick elements. To be consistent with the experiment configuration, encastre boundary conditions were applied on the left and right plate edges. A surface crack 4 mm long from the tip of the initiator and 2.25 mm deep (half of the intact plate thickness), parallel to the left/right plate edge, was modelled. In the vicinity of the crack, the mesh was particularly refined with an element size less than 0.25 mm, thus guaranteeing at least 15 elements were allocated per wavelength of the primary wave mode. Eight elements were allocated through the plate thickness.
A contacting-pair interaction was imposed on the two surfaces of the crack, which had a gap of 0.2 mm in between, connecting the two surfaces in a contact manner and enforcing the equality of their degrees of freedom. Such a restriction allowed the breathing behaviour of a fatigue crack when the primary wave mode traversed it, properly simulating CAN. A three-dimensional nonlinear constitutive relationship involving the third-order elastic (TOE) tensor was introduced to the material property definition, so as to model the intrinsic material nonlinearity and the geometric nonlinearity [33] as well, through a user subroutine VUMAT in ABAQUS®, as fully reported in the authors' other work [29]. A pre-developed piezoelectric actuator/sensor model [32] was recalled to model the PZT wafers, in which uniform in-plane radial displacement constraints were applied on the FE nodes of the actuator model to generate the primary wave mode, which is consistent with the motion pattern of the S1 mode, which predominantly has in-plane displacements. The same excitation condition as that used in the experiment was applied. AU wave signals were acquired by calculating the strains at the places where sensors were positioned.
To facilitate comparison with experimental results, the combined primary and second harmonic wave modes extracted from the signal captured by the same sensing path AI − SI are shown in figure 7, from which β' was ascertained using equation (13). Compared with the corresponding experimental results shown in figure 5, excellent coincidence between two wave modes in terms of the arrival time of the maximum energy is observed, as a result of the absence of any measurement errors in simulation.
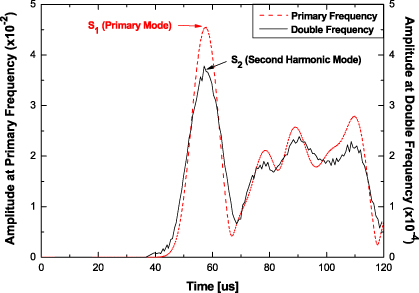
Figure 7. Combined slices of signal energy as a function of time captured by AI − SI and extracted at the primary (800 kHz) and second harmonic (1.6 MHz) frequency in simulation.
Download figure:
Standard imageWith all five sensing paths, the dotted line in figure 6 presents the relationship between β' of a particular sensing path and its od/λ from the crack obtained from simulation. Quantitative agreement is noticed between the results from experiment and from the enhanced FE analysis using TOE for simulating nonlinear AU waves.
3.3. Discussion
The correlation β' − od/λ in figure 6 reveals that the relative acoustic nonlinearity factor defined by equation (13) captured via AI − SI (i.e., the path having the smallest offset distance from the fatigue crack) presents the highest value; with the increase in od, β' decreases monotonously and reaches its minimum when od/λ is approximately 6 (corresponding to the case that od is circa 30 mm); in particular, a remarkable decrease in β' is observed within od/λ < 4 (od: 20 mm), whereas no further significant decrease can be noted when od/λ > 4.
The above correlation was established when the length of the sensing path (between Ai and Si) was 200 mm. To further scrutinize this correlation at different distances of AU wave propagation, modelling and simulations were repeated for different sensing path lengths, ranging from 100 to 400 mm with an increment of 100 mm. The accordingly obtained β' − od/λ curves are compared in figure 8, where no substantial variations among the results obtained by sensing paths of different lengths can be observed, provided their od from the crack remained the same. The largest β' can always be captured when the sensing path has the shortest od, and it decreases gradually with increasing od and subdues once od/λ reaches approximately 4. This affirms the hypothesis made in section 2.2 that compared with the accumulative material nonlinearity as wave propagation, the one incurred due to fatigue damage dominates the overall nonlinearity of an AU wave signal (i.e., the nonlinearity of an AU wave signal contributed by the material itself is insignificant compared with that arising from the fatigue damage). The correlation in figure 6 rationalizes the algorithm developed in this study for quantitative characterization of fatigue damage.

Figure 8. Relative acoustic nonlinearity factor versus offset distance normalized by the AU wavelength for different lengths of sensing path (all from simulation).
Download figure:
Standard image4. Probability-based diagnostic imaging using active sensor network
Driven by the incentive to 'visualize' characterized fatigue damage, a damage imaging algorithm was further developed in this study, to project the identification results to synthetic images, called damage diagnostic imaging (DDI) [34]. DDI differentiates itself from traditional damage imaging techniques such as tomography, thanks to appealing features including the use of an active sensor network with a much sparse transducer configuration, instead of a dense transducer network used in tomography, and the adoption of a faster image re-construction algorithm instead of computationally expensive tomography. These make DDI a good candidate for developing automated SHM [35–38]. In DDI, a damage event is described in terms of the likelihood (i.e., probability) of its presence, instead of deterministic parameters (e.g., coordinates of damage centre, length and orientation of a particular damage dimension, or size of a damaged area). Using probability to describe a damage event is not a weakness but an advantage over conventional damage presentation. That is because damage detection is a process with high indeterminacy (especially for characterization of fatigue damage as it involves numerous uncertainties and probabilistic factors). Thus it is a corollary that the identification results should ideally be delivered using the 'probability' associated with the presence of fatigue damage since the underlying implication of 'probability' is more consistent with the essence of 'detection'. In DDI, the probability of fatigue damage presence is depicted in a contour map, allowing users to intuitively and rapidly comprehend the overall health status of the structure under inspection.
4.1. Construction of image field value using β'
In DDI, the inspection area of the structure is two-dimensionally meshed first using a dense set of spatial points, and projected to a two-dimensional pixelated image (or map) with each pixel corresponding exclusively to a spatial point. The value of each image pixel (called field value hereinafter) is in some way linked to the presence probability of fatigue damage at the spatial point correlated with this pixel. A fatigue damage zone can thus be graphically defined by highlighting those pixels with remarkably high field values, providing a quantitative and detailed depiction about the damage (e.g., size and orientation).
Considering an active PZT sensor network with NTotal PZT elements to cover the inspection area, each PZT in the network can serve as either the actuator or the senor in terms of the dual piezoelectric effects. Given a sensing path in the network PZTi − PZTj(i,j = 1,2,⋯NTotal,i ≠ j), with the coordinates of actuator PZTi and sensor PZTj being (xi,yi) and (xj,yj), respectively, the field value at pixel (x,y) perceived by PZTi − PZTj (denoted by I(x,y)i−j) is defined, based on the conclusion drawn from figure 6, as

where  is the relative acoustic nonlinearity factor acquired via sensing path PZTi − PZTj, ς is a scaling parameter controlling the size of the effective distribution area, and Rij(x,y) is a weight to regulate the area of influence from the fatigue damage on a particular sensing path in the sensor network as detailed elsewhere [34, 38], which reads
With equation (14), the field value at each pixel can be constructed by PZTi − PZTj, leading to a probability image. In the case that the inspection area is free of damage, all the field values are low (practically it is not zero due to noise interference). In contrast, with fatigue damage, the sensing paths can be affected by the nonlinearity due to fatigue damage, more or less subject to the od between the fatigue damage and this sensing path, and the field values at those pixels contained in the fatigue damage zone are elevated pronouncedly.
It is important to note that a sensing path perceives the damage near it only, an attribute due to the quick descent of β' as with an increase in od, as described in figures 6 and 8. This high sensitivity creates the feasibility of identifying multiple fatigue damage zones, because such a trait of β' makes the field value defined by equation (14) highly inert to distant damage (to be demonstrated in section 5).
4.2. Image fusion
In accordance with equation (14), each sensing path in the sensor network creates a probability image (called source image) [39], each reflecting the prior perceptions as to the fatigue damage in the structure from the perspective of the sensing path that creates such an image. Each source image contains, however, not only features related to damage but unwanted components such as measurement noise and uncertainties. Aimed at screening unwanted noise while strengthening a fatigue damage-incurred singularity, an image fusion scheme based on the arithmetic mean was introduced, amalgamating available source images at the pixel level and constructing a superimposed image (ultimate resulting image). It is a collective consensus as to fatigue damage from the entire sensor network. The scheme is defined as
where I(x,y)|ultimate is the field value at pixel (x,y) in the ultimate resulting image. Upon image fusion, the damage-incurred singularity (commonality in individual source images) stands out and noise (random information in source images) is filtered. Identified fatigue damage zone can thus be illuminated at image pixels with higher field values.
5. Quantitative evaluation of multi-fatigue cracks near rivet holes: results and discussion
As an application, the developed approach was employed to characterize multiple fatigue cracks near the rivet holes in a fatigued aluminum plate.
5.1. Specimen configuration and testing
An aluminum plate (measuring 380 × 400 × 4.5 mm3) with four through-thickness rivet holes for bolt connection (Φ10 mm each; see figure 9 and table 1 for geometric parameters) was fatigued using a digitally controlled MTS testing platform (858 Mini Bionix) subject to a sinusoidal tensile load of 5 Hz. To facilitate initiation of micro-fatigue cracks and expedite their deterioration, a small notch with a sharp tip was inscribed at the edge of two rivet holes randomly chosen (#1 and #2), respectively. It took about 500 000 cycles to produce two barely visible fatigue cracks, as photographed in figure 10: about 5 mm long initiated from Rivet Hole #1, and circa 3 mm from #2. Eight PZT wafers (Φ: 5 mm, thickness: 0.5 mm each), denoted by Ti(i = 1,2,...,8) with respective coordinates tabulated in table 1, were surface-mounted on the fatigued plate to form an active PZT sensor network, as shown schematically in figure 9. This sensor network offered 7 × 8 = 56 sensing paths, which were instrumented with the signal generation and acquisition system introduced in section 3.1. The diagnostic signal (Hanning-window-modulated 16-cycle sinusoid tone bursts at 800 kHz, conforming to the mode selection criterion in section 2.3) was generated and the response AU wave signals were captured with the system.

Figure 9. Schematic of the aluminum plate with four rivet holes and the layout of the surface-mounted active PZT sensor network.
Download figure:
Standard image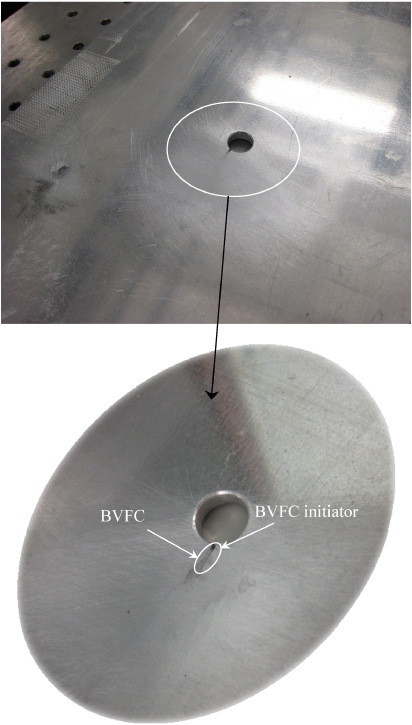
Figure 10. BVFC generated near Rivet Hole #1 upon fatigue testing (bottom: zoomed-in view).
Download figure:
Standard imageTable 1. Coordinates of the centres of four rivet holes in the fatigued aluminum plate and eight PZT wafers in the active sensor network (mm).
| Rivet hole/PZT wafer | Coordinates of centre |
|---|---|
| #1 | (40, 90) |
| #2 | (−90, 40) |
| #3 | (−90, −80) |
| #4 | (40, −30) |
| T1 | (150, 150) |
| T2 | (0, 150) |
| T3 | (−150, 150) |
| T4 | (−150, 0) |
| T5 | (−150, −150) |
| T6 | (0, −150) |
| T7 | (150, −150) |
| T8 | (150, 0) |
5.2. Results and discussion
With captured signals, β' was calculated using equation (13) for each sensing path, and a source image was subsequently constructed using equation (14). All source images were fused in terms of equation (16), leading to the ultimate resulting image, as displayed in figure 11. In the image, the presence probability of fatigue damage is quantitatively calibrated in terms of the greyscale, where the darker the greyscale at a pixel the greater the presence possibility of fatigue damage at the spatial node represented by that pixel. For easy comparison, the two real fatigue cracks are integrated in the image. In the figure, two regions with higher greyscale (i.e., higher field values) can be observed, covering Rivet Hole #1 and #2, as well as their vicinities, implying a higher probability for the existence of fatigue cracks therein, although artefacts due to measurement noise can also be seen in the image which perturb the evaluation results from the reality.
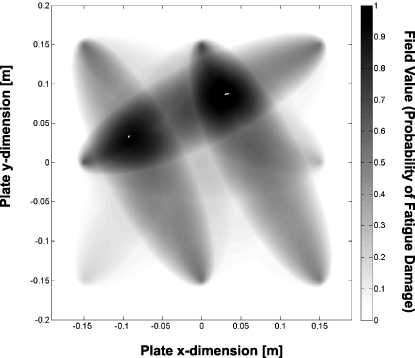
Figure 11. Diagnostic image following image fusion showing the presence probability of fatigue damage zones in the plate.
Download figure:
Standard imageIt is noteworthy that the identified results in the image correspond to the two fatigue cracks initiated from rivet holes, rather than the rivet holes themselves or the fatigue crack initiators at the hole edges, although the highlighted areas with higher greyscale are considerably greater than the actual sizes of the two fatigue cracks. In fact, the two highlighted zones describe the vicinity of the two fatigue cracks. That is because, upon fatigue testing, the vicinities of two fatigue cracks became plastically deformed, which elevates β' measured by the sensing paths nearby. As explained in section 2.2, the proposed approach explores the abnormal increase in β' due to a fatigue crack only, and it is thus independent of a benchmark structure, in which the intrinsic material nonlinearity, geometric nonlinearity and gross damage (e.g., a rivet hole in this study) would not incur abnormal changes in β'. Thus, once the increase in β' is detected, it is attributable to the existence of fatigue damage.
Furthermore, a threshold, κ, was applied to strengthen the identified fatigue damage by screening measurement noise. κ is a pre-set percentage of the maximum field value of the ultimate resulting image. Any field value which is less than such a threshold is forced to be zero, and otherwise retained (a smaller threshold means more information is included in the ultimate resulting image). Shown in figure 12 are the resulting images when different thresholds (κ = 0.5,0.6,0.7,0.8) are applied. With the increase in κ, artefacts from noise are considerably suppressed and the fatigue damage zones become obvious. In particular, with κ = 0.8 and ς = 1.01, two fatigue damage zones are manifested clearly in figure 12(d).

Figure 12. Diagnostic images applied with different thresholds: (a) κ = 0.5; (b) κ = 0.6; (c) κ = 0.7; and (d) κ = 0.8.
Download figure:
Standard image6. Conclusions
It is of great significance but also a great challenge to characterize micro-fatigue cracks quantitatively. This is a critical step towards automatic SHM. Aimed at a SHM technique able to evaluate fatigue cracks in a quantitative manner, a damage characterization approach based on the nonlinearities extracted from high-order AU waves was developed in conjunction with the use of an active piezoelectric sensor network and a probability-based diagnostic imaging algorithm. A fundamental study was carried out to correlate a self-defined relative acoustic nonlinearity factor for a particular sensing path with its offset distance from the fatigue crack, using experiments and an enhanced FE analysis dedicated to simulating nonlinear AU waves. It revealed that with increasing offset distance the relative acoustic nonlinearity factor decreases monotonously, and subdues at a certain ratio of the offset distance to AU wavelength. Accurate characterization results for multiple barely visible fatigue cracks near rivet holes of a fatigued aluminum plate demonstrated the feasibility of the proposed technique in quantitatively detecting real-world fatigue damage. The use of a permanently mounted active sensor network, visualization of identification results in images and less dependence on a benchmark structure endowed the approach with the particular capacity to achieve automatic SHM in engineering practice. Though presenting satisfactory characterization results, this proposed approach may be prone to some issues that might compromise its effectiveness and practicability during implementation. For example, the mechanism of using PZT wafers at high frequencies for capturing AU nonlinearities has yet to be fully comprehended, and thus criteria are lacking for optimal selection of PZT wafers for SHM; application to real-world engineering structures may be hampered due to the considerably weak responses of the PZT wafer-captured AU nonlinearity under the influence of measurement noise, thus entailing future study.
Acknowledgments
Z Su wishes to acknowledge the support given to him by the Hong Kong Polytechnic University (Research Grants A-PL08 and A-PL71). Q Wang is grateful to National Natural Science Foundation of China for a research grant (Grant No.: 11202107).