
Abstract
Batteries in electric vehicles (EVs) require a packaging system that provides both thermal regulation and crash protection. A novel packaging scheme is presented that uses active cooling of microvascular carbon fiber reinforced composites to accomplish this multifunctional objective. Microvascular carbon fiber/epoxy composite panels were fabricated and their cooling performance assessed over a range of thermal loads and experimental conditions. Tests were performed for different values of coolant flow rate, channel spacing, panel thermal conductivity, and applied heat flux. More efficient cooling occurs when the coolant flow rate is increased, channel spacing is reduced, and thermal conductivity of the host composite is increased. Computational fluid dynamics (CFD) simulations were also performed and correlate well with the experimental data. CFD simulations of a typical EV battery pack confirm that microvascular composite panels can adequately cool battery cells generating 500 W m−2 heat flux below 40 °C.
Export citation and abstract BibTeX RIS
1. Introduction
A key challenge for high-range electric vehicles (EVs) is packaging the large number of battery cells required. Battery packaging must simultaneously maintain an optimal temperature for battery operation while also protecting batteries in the event of a crash.
It is critical that temperature is regulated for the lithium-ion batteries used in most EVs, since operating temperatures outside of the range 10 °C–40 °C lead to poor cycling performance and reduced lifetime [1, 2]. Prismatic batteries produce in the range of 1–30 W of waste heat during deep cycling, with the highest heat generation occurring at high discharge rate and high degree of discharge [3]. Batteries are also subject to heating and cooling from operation in warm or cold climates [4]. Finally, cell damage can lead to sudden increases in temperature that can potentially lead to thermal runaway and fire [5]. In order to maintain optimal performance and protect batteries from thermal runaway, most EVs employ an active thermal management system using either air [6] or a liquid coolant [7–9]. Alternate cooling schemes have also been proposed using heat pipes [10] or phase change materials [11].
Battery packaging must also protect batteries during crashes. This has led to complex packaging such as the scheme used for the Chevy Volt, where liquid coolant circulates through aluminum cooling panels sandwiching the battery cells while an outer casing of fiberglass and steel protects the cells during a crash [7, 8]. Despite such complex and heavy protection schemes, several EV battery packs have caught on fire after crashes in recent years due to damaged batteries and cooling systems [12, 13]. A need exists for an integrated, lightweight packaging system that can provide superior structural protection with simultaneous thermal management. Fiber-reinforced composites are one potential materials system with superior crashworthiness. Carbon/epoxy fiber-reinforced composites fail in a crash through a combination of compressive failure and splaying (delamination and bending) which leads to material disintegration [14]. The specific energy absorbed (SEA) ranges from 50–100 kJ kg−1 [15]. For comparison, typical SEA values are ca. 30 kJ kg−1 for aluminum and ca. 20 kJ kg−1 for steel [15]. Composite battery packaging can thus provide significantly increased crashworthiness compared to metals while also reducing weight. Reduced weight in turn leads to extended range, as realized in EVs that utilize carbon/epoxy composites such as the BMW i3 [16].
Fiber-reinforced composites have also been used for the integration of microvascular channels for coolant flow [17–22]. The majority of studies to date have focused on cooling polymer matrix composites in high heat flux environments to keep them below their glass transition temperature (ca. 150 °C). Soghrati et al simulated cooling of a microvascular glass-fiber/epoxy composite subject to heat fluxes representative of hypersonic flight [18]. Composites with high coolant flow rate and channel density maintained temperatures below 150 °C at heat fluxes as high as 100 kW m−2. Coppola et al measured the flexural modulus of microvascular glass-fiber/epoxy composites at elevated ambient temperatures [19] and demonstrated up to 90% retention of modulus at an ambient temperature of 325 °C. Coppola et al also demonstrated the retention of compressive strength for vascular carbon fiber/epoxy composites subject to heat fluxes as high as 60 kW m−2 [21]. As an alternate application, microchannels have also been used to actuate shape memory composites through the flow of heated fluids [23, 24].
While these prior studies demonstrated the utility of actively cooled/heated composites, none have considered the use of composites as cooling panels designed to keep a heat source (e.g. a battery) within a narrow temperature range. Prior studies have focused on composite panels with relatively small planar area (<100 mm × 100 mm) compared to EV batteries. Finally, while some studies showed agreement between experiment and simulation, their scope has been restricted to a limited number of test conditions.
Here we propose a novel battery packaging scheme where a single material provides both cooling and crash protection. Batteries are embedded within microvascular carbon fiber/epoxy composites through which coolant can flow (figure 1(a)). Batteries can be stacked into a single pack (figure 1(b)), with additional composite reinforcement seamlessly added around the pack exterior as needed. Alternatively, batteries can be embedded within composite body panels to achieve system-level savings of volume and weight [25, 26]. With either packaging scheme, batteries are protected by composites that have a higher specific strength, stiffness, and crashworthiness than aluminum or steel [27, 28].
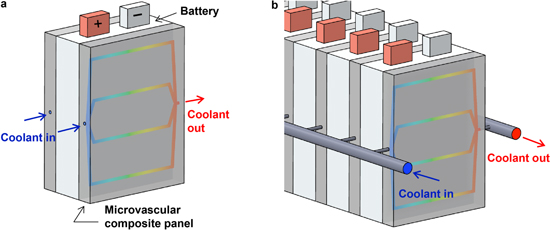
Figure 1. Schematic of battery packaging using microvascular composite panels. (a) A battery cell is sandwiched between two microvascular composite panels through which coolant flows. (b) Assembly of multiple battery cells with a coolant distribution manifold.
Download figure:
Standard image High-resolution imageThe cooling performance of microvascular composite cooling panels is characterized using both experiments and simulations. Microvascular composites are fabricated by vacuum-assisted resin transfer molding (VARTM) and the use of sacrificial fibers. Cooling performance is characterized across a range of coolant flow rates, applied heat fluxes, channel spacings, and carbon fiber materials. Computational fluid dynamics (CFD) simulations are also performed and are validated across all experimental test conditions. Finally, further simulations are performed to design vascular cooling panels for use in a typical EV battery pack. Simulations are performed using different panel materials, channel spacings, applied heat fluxes, coolant flow rates, and panel thicknesses. A detailed crashworthiness study of microvascular carbon/epoxy composites is presented in a separate work [29].
2. Methods
2.1. Fabrication of microvascular composite panels
Microvascular composite panels were prepared using VARTM. Panels were made with both polyacrylonitrile (PAN) and pitch derived carbon fiber fabrics. The PAN-based fabric used was a 2 × 2 twill weave of Toray T300 3 K fiber (199 g m−2, Soller Composites) and the pitch-based fabric was a plain weave of ThermalGraph EWC-300X 4 K fiber (610 g m−2, Cytec). Fabrics were infused with an epoxy resin composed of 100:35 Araldite LY 8605 epoxide to Aradur 8605 curing agent (Huntsman Advanced Materials, LLC).
For PAN-based carbon/epoxy panels, 12 layers of carbon fiber fabric were stacked in a double vacuum bag layup with 500 μm diameter sacrificial fibers placed between the 6th and 7th layers of fabric (figure S1 is available online at stacks.iop.org/SMS/26/105004/mmedia). Channels were evenly spaced throughout the panel (see table S1 for channel spacings for different panels). For all panels but one, the sacrificial fibers were nylon monofilament (Berkley) treated with Henkel FREKOTE release agent (Northern Composites) and were manually extracted after cure. As a proof of concept, in one panel polylactide (PLA) fibers treated with tin (II) oxalate catalyst were used as sacrificial fibers and removed using the VaSC technique [30]. The sacrificial PLA fibers were prepared using a modified solvent-impregnation procedure adapted from Esser-Kahn et al [30] and Dong et al [31] (see section S1 for details).
Prior to infusion, epoxy resin was mixed by hand and degassed for 3 h at room temperature. Resin was infused into the fabric layup using a vacuum pump at ∼38 Torr. The resin was cured at room temperature under vacuum for 24 h and then 121 °C for 2 h followed by 177 °C for 3 h. The heating rate was 2 °C min-1 and the cooling rate to ambient was 1 °C min−1. The average thickness of the PAN-based carbon/epoxy panels was 2.71 ± 0.07 mm which corresponds to a fiber volume fraction of 49.5 ± 1.3% based on ASTM D3171 (Test Method II).
After cure, the sacrificial nylon fibers were manually extracted using needle-nose pliers. This technique produced high-fidelity circular channels with little disruption to fiber architecture (figure 2). PLA fibers were evacuated through the VaSC process (200 °C and vacuum for 48 h) and gave similar quality channels. The VaSC process requires longer manufacturing time, but it is more scalable and can create channels with much more complex shapes [30, 32].

Figure 2. Microvascular composite panel. (a) 150 mm × 200 mm carbon fiber/epoxy panel with 6 cooling channels (500 μm diameter) with inlet and outlet needles attached. (b) Cross-sectional optical micrographs of a 500 μm diameter cooling channel embedded in a carbon/epoxy composite.
Download figure:
Standard image High-resolution imageOne pitch-based carbon/epoxy panel was made using 4 layers of carbon fiber fabric in a double vacuum bag layup with sacrificial fibers placed between the 2nd and 3rd layers of fabric. The pitch-based carbon/epoxy panel had a thickness of 3.03 mm which corresponds to a fiber volume fraction of 38.3%.
2.2. Cooling experiments
Vascular panels were cut to 150 mm × 200 mm with a sectioning saw (Buehler IsoMet 1000) and the top surface was painted with a matte black paint (Krylon) for thermal imaging. Inlet and outlet holes 1.03 mm in diameter and 3 mm deep were drilled into each channel to allow the insertion of needle fittings. Cooling tests were performed using the experimental setup shown in figure 3(a). Panels were placed on top of a copper plate coupled to a polyimide flexible heater (Omega, part # KH-608/2) with thermal grease (Omega, part # Omegatherm 201). Applied heat flux was controlled by regulating the voltage supplied to the heater (see section S2) with a Variac variable transformer (Staco Energy Products Co., Type L1010). The heater assembly was placed on a balsa wood platform while the sides were insulated using fiberglass insulation.

Figure 3. Schematics of cooling experiments and simulations. (a) Experimental setup where panel temperature is measured with an IR camera while coolant temperature is monitored with thermocouples embedded in the microchannel inlets and outlets. (b), (c) Top and side view of the simulation model (dimensions in mm). The microvascular composite panel is heated from below while coolant circulates through all channels at a set inlet temperature and flow rate.
Download figure:
Standard image High-resolution imageThe coolant was a 50:50 water/ethylene glycol mixture (Macron Chemicals) and was stored in a circulator (Julabo, Model F32-HP) at 21 °C and pumped through the composite with a peristaltic pump (Cole-Parmer Masterflex, Model EW-07551099). Coolant flow was evenly divided between channels. Tubing lines were connected to the composite with 19 gauge needle fittings. The fittings contained Type T thermocouple probes (Omega, part # TMQSS-020U-36) to measure coolant temperature, which were inserted by drilling a hole into the fittings and sealing the thermocouple with acrylate adhesive (Loctite Depend 330). For 3, 4, and 6-channel panels, thermocouples were placed at all channel inlets and outlets. For 8 and 12-channel panels, thermocouples were placed at every other inlet and outlet. Thermocouple measurements were taken using 4-port thermocouple readers (Phidgets Inc., model 1048) controlled using LabVIEW 2013. Surface temperature measurements of the panel were taken with an infrared camera (FLIR, Model SC620).
Experiments were performed to measure the surface temperature and the average coolant temperature rise (ΔTc) at steady-state. The cooling efficiency (η) of the panel was then calculated as the ratio of the heat flux absorbed by the channels (qc) to the total heat flux applied (qt) using equation (1):

where  ΔTc,
ΔTc,  is total coolant flow rate, and cp is the specific heat of the coolant.
2.3. Model conditions for CFD simulations
The cooling performance of microvascular panels was analyzed using the commercial CFD package ANSYS Fluent v15.0. The model simulated is shown in figures 3(b) and (c) and consists of a vascular composite heated from one side (copper plate/heater) and open to convection and radiation on the opposite side. The side walls are insulated in the plane and coolant is circulated with a constant inlet temperature (21.5 °C) based on the average inlet temperature read by thermocouples during experiments. The full set of dimensions, boundary conditions, and material properties used for simulations is included in table 1.
Table 1. Dimensions, boundary conditions, and material properties used for cooling simulations.
| Simulation condition/material property | Value for experimental validation | Value for in situ battery cooling | Reference |
|---|---|---|---|
| Panel dimensions | |||
| Panel width (mm) | 150 | 160 | |
| Panel height (mm) | 200 | 200 | |
| Panel thickness (mm) | 2.7a | 3b | |
| Channel diameter (mm) | 0.5 | 0.5 | |
| Channel location through-thickness | Centered | Centered | |
| Channel spacing | See table S1 | See table S1 | |
| Boundary conditions | |||
| Applied heat flux (W m−2) | 500 from backb | 250 from front and 250 from backb | |
| Total coolant flow rate (ml min−1) | 28.2b | 28.2b | |
| Coolant inlet temperature (°C) | 21.5 | 27 | |
| Coolant outlet pressure (Pa) | 0 | 0 | |
| Thickness of copper plate between heater | |||
| and composite (mm) | 1.6 | N/A | |
| Convection coefficient h for top face (W m−2 K−1) | 8 | N/A | |
| Emissivity for top face | 0.97 | N/A | |
| Air temperature (°C) | 21 | N/A | |
| Sides of panel | Insulated | Insulated | |
| Coolant: 50/50 water/ethylene glycol | |||
| Density (kg m−3) | 1065 | 1065 | [33] |
| Viscosity (Pa s) | 0.0069*(T/273)−8.3 | 0.0069*(T/273)−8.3 | [33] |
| Specific heat (J kg−1 K−1) | 2574.7 + 3.0655 T | 2574.7 + 3.0655 T | [33] |
| Thermal conductivity (W m−1 K−1) | 0.419 | 0.419 | [33] |
| PAN-based carbon fiber composite | |||
| Fiber volume fraction Vf (%) | 49.5 | 60 | ASTM D3171 |
| Density (kg m−3) | 1440 | 1500 | c |
| Specific heat (J kg−1 K−1) | 880 | 860 | c |
| In-plane thermal conductivity (W m−1 K−1) | 2.2 | 2.7 | c |
| Transverse thermal conductivity (W m−1 K−1) | 0.47 | 0.59 | c |
| Pitch-based carbon fiber composite | |||
| Fiber volume fraction (%) | 38.3 | 60 | ASTM D3171 |
| Density (kg m−3) | 1490 | 1710 | c |
| Specific heat (J kg−1 K−1) | 850 | 790 | c |
| In-plane thermal conductivity (W m−1 K−1) | 48 | 75 | c |
| Transverse thermal conductivity (W m−1 K−1) | 0.39 | 0.61 | c |
| Aluminum | |||
| Density (kg m−3) | N/A | 2720 | Fluent 15.0 |
| Specific heat (J kg−1 K−1) | N/A | 870 | Fluent 15.0 |
| Thermal conductivity (W m−1 K−1) | N/A | 202 | Fluent 15.0 |
aValue of 3 mm used for pitch-based carbon fiber composite. bBaseline value. Other values were also tested. cDetermined using constituent properties and fiber volume fraction. Epoxy properties and fiber properties are given in table S2. Density and specific heat were determined by rule of mixtures. Conductivity was determined using the rule of mixtures for axial conductivity and the self-consistent model for transverse conductivity (see [19] for calculations).
A surface convection coefficient of h = 8 W m−2 K−1 was chosen after fitting to experimental data. The emissivity of the top surface was set to 0.97 to represent the matte black painted surface. Coolant material properties were taken from literature [33] and composite properties were calculated based on constituent properties and fiber volume fraction (see table 1).
A set of simulations was also performed to analyze cooling performance under conditions more realistic for in situ battery packaging. In this case, panels are heated from both top and bottom surfaces (see figure 1(b)), there is no copper plate between the panels and the batteries, and the coolant inlet temperature would likely be higher than room temperature [33]. Commercial microvascular panels would also maximize fiber volume fraction and thus, thermal conductivity (see table 1). Simulations for these conditions were also performed for aluminum panels as a comparison case.
2.4. Mesh generation and convergence
Conforming, hexahedral finite volume meshes of microvascular panels were constructed in ANSYS Meshing v14.5. A mesh convergence study was performed on a panel 3 mm thick with 6 embedded microchannels. Figure S2 shows a convergence plot of average surface temperature for the panel versus the number of fluid elements in the mesh. Based on this study, a maximum fluid mesh sizing of 40 μm was defined yielding 350 000 fluid elements and 750 000 total elements for the 6-channel panel. The same mesh sizings were used for all other panels, yielding a range of 410 000–4000 000 total elements for all panels simulated.
Simulations were performed in ANSYS Fluent using the SIMPLE pressure–velocity coupling scheme, Green-Gauss node-based gradient discretization, second-order pressure discretization, third-order MUSCL momentum discretization, and third-order MUSCL energy discretization. The simulations solve for the conservation of mass, momentum, and energy across a finite volume mesh for a Newtonian, incompressible fluid with laminar flow. The maximum Reynolds number for any simulation was ca. 200, confirming the assumption of laminar flow. Simulations were performed to obtain the temperature profile of the panels at steady-state. The convergence criterion employed was for velocity and continuity residuals to reach 10−4 and for the energy residual to reach 10−9. These thresholds were sufficient for full convergence of panel and coolant temperature fields.
3. Results and discussion
3.1. Experimental characterization of cooling performance
3.1.1. Effect of coolant flow rate
A parametric study was performed to characterize cooling panels across a wide range of operating conditions. The baseline test case consists of a 500 W m−2 applied heat flux and 28.2 mL min−1 (0.5 g s−1) total flow rate applied to a 6-channel PAN-based carbon/epoxy vascular panel. The heater size and baseline heat flux are representative of the thermal load of one battery cell in the Chevrolet Volt [33, 34]. These tests represent a 1:1 battery cell: cooling panel ratio as shown for the stacking sequence in figure 1(b). The choice of coolant and baseline flow rate are also inspired by the Chevrolet Volt system [33, 34].
The effect of total flow rate on the cooling performance of a 6-channel PAN-based carbon/epoxy panel is shown in figure 4. Three panels were tested for repeatability: two panels in which channels were made with nylon monofilament and one panel where the channels were made with the VaSC technique. No significant difference was seen between panels made with the different fabrication techniques. For the case where no flow occurs, the average panel surface temperature is ∼52 °C and all heat is lost through radiation and convection to the environment. As the flow rate is increased, heat is absorbed by the coolant and transported through the channels. Average panel temperature quickly decreases until reaching a plateau value at high flow rate, as does the maximum surface temperature (see summary of all experimental data in table 2). Surface temperature profiles reveal warm regions between channels and a slight increase in temperature in the direction of coolant flow.

Figure 4. Thermal performance of a 6-channel PAN-based carbon/epoxy panel subject to 500 W m−2 applied heat flux as a function of total coolant flow rate. (a) Plot of average steady-state surface temperature and cooling efficiency (η) versus flow rate. Error bars represent the maximum and minimum values for 3 samples. (b) Representative surface temperature profiles for experiment and simulation at different flow rates.
Download figure:
Standard image High-resolution imageTable 2. Comparison of average steady-state surface temperature Tav, maximum surface temperature Tmax, and coolant temperature rise ΔTc for experiments and simulations. Experimental error refers to the largest deviation of any sample from the mean value. The baseline test conditions are in bold.
| Tav (°C) | Tmax (°C) | ΔTc (°C) | |||||||
|---|---|---|---|---|---|---|---|---|---|
| Sample | Samples tested | Heat flux (W m−2) | Total flow rate (mL min−1) | Sim. | Exp. | Sim. | Exp. | Sim. | Exp. |
| 6-channel PAN | 3 | 500 | 0 | 55.1 | 51.5 ± 0.8 | 55.1 | 52.6 ± 0.4 | N/A | N/A |
| " | " | 7.1 | 38.1 | 39.1 ± 0.1 | 39.5 | 40.8 ± 0.2 | 17.7 | 16.1 ± 0.2 | |
| " | " | 14.1 | 34.6 | 35.5 ± 0.4 | 35.0 | 37.2 ± 0.6 | 11.1 | 10.6 ± 0.4 | |
| " | " | 28.2 | 31.0 | 32.0 ± 0.5 | 32.3 | 33.6 ± 0.5 | 6.2 | 6.0 ± 0.3 | |
| " | " | 42.3 | 30.0 | 31.6 ± 0.7 | 31.3 | 33.2 ± 0.8 | 4.3 | 4.3 ± 0.3 | |
| " | " | 56.4 | 29.5 | 31.2 ± 0.4 | 30.7 | 32.8 ± 0.4 | 3.3 | 3.3 ± 0.2 | |
| " | " | 70.5 | 29.2 | 30.9 ± 0.5 | 30.4 | 32.4 ± 0.5 | 2.7 | 2.6 ± 0.1 | |
| 6-channel PAN | 3 | 250 | 28.2 | 26.4 | 26.7 ± 0.3 | 26.8 | 27.7 ± 0.3 | 3.1 | 3.0 ± 0.1 |
| " | 750 | " | 36.9 | 37.4 ± 0.5 | 37.7 | 39.7 ± 0.6 | 9.3 | 9.0 ± 0.3 | |
| " | 1000 | " | 42.2 | 42.9 ± 0.7 | 43.0 | 45.9 ± 0.8 | 12.4 | 11.9 ± 0.3 | |
| " | 1250 | " | 46.8 | 47.5 ± 1.0 | 48.3 | 51.1 ± 0.8 | 15.5 | 14.4 ± 0.3 | |
| 3-channel PAN | 1 | 500 | 28.2 | 35.1 | 36.7 | 36.2 | 38.4 | 5.2 | 5.0 |
| 4-channel PAN | " | " | " | 33.2 | 34.8 | 34.4 | 36.5 | 5.7 | 5.7 |
| 8-channel PAN | " | " | " | 29.7 | 31.0 | 31.0 | 32.7 | 6.5 | 7.1 |
| 12-channel PAN | " | " | " | 28.3 | 30.1 | 29.6 | 31.5 | 6.9 | 7.3 |
| 3-channel Pitch | " | " | " | 30.0 | 32.5 | 31.2 | 33.5 | 6.4 | 6.4 |
Cooling efficiency (η) quickly increases with increasing flow rate (figure 4) until reaching about 80% at high flow rates. Flow rates above 30–40 mL min−1 are observed to provide minimal additional cooling capability while requiring higher pump pressure and power. Good agreement was obtained between experimental data and simulation results for surface temperature and cooling efficiency across all conditions tested. Small discrepancies between experimental and simulated values are likely experimental error and/or variation in convection coefficient (see discussion in section S3).
3.1.2. Effect of heat flux
The effect of applied heat flux on cooling performance for a 6-channel PAN-based carbon/epoxy panel is presented in figure 5. Higher heat fluxes represent higher power density batteries and more rapid charge/discharge conditions. Average and maximum surface temperature (and ΔTc) rise linearly with heat flux as expected. Cooling efficiency is roughly constant over the range of heat fluxes tested.

Figure 5. Thermal performance of a 6-channel PAN-based carbon/epoxy panel subject to 28.2 mL min−1 total flow rate as a function of applied heat flux. (a) Plot of average steady-state surface temperature and cooling efficiency (η) versus applied heat flux. Error bars represent the maximum and minimum values for 3 samples. (b) Representative surface temperature profiles for experiment and simulation at different applied heat fluxes.
Download figure:
Standard image High-resolution image3.1.3. Effect of channel spacing
Composite panels with 3, 4, 6, 8, and 12 channels were tested to study the effect of channel spacing on cooling performance. The results of this study (figure 6) reveal that average surface temperature decreases and cooling efficiency increases with increasing number of channels. The better cooling performance is due to both an increase in channel surface area, which results in lower radial thermal gradients within channels [35], and by the reduction in distance between channels (and the resulting reduction in heat conduction distance to channels).
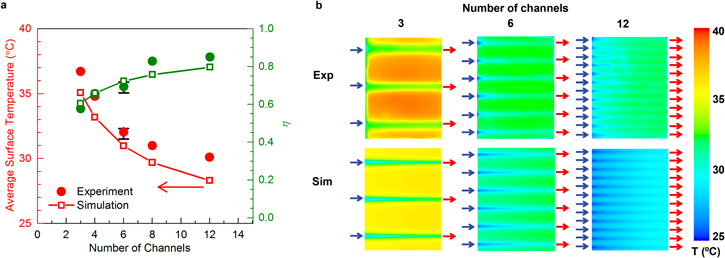
Figure 6. Thermal performance of PAN-based carbon/epoxy panels with 3, 4, 6, 8, and 12 channels at 500 W m−2 applied heat flux and 28.2 mL min−1 total coolant flow rate. (a) Plot of average steady-state surface temperature and cooling efficiency (η) versus number of channels. The error bars represent the maximum and minimum values for 3 samples for the 6-channel sample. (b) Surface temperature profiles for experiment and simulation for panels with different numbers of channels.
Download figure:
Standard image High-resolution image3.1.4. Effect of fiber conductivity
While PAN-based carbon fibers are the most common and economical class of carbon fiber, pitch-based carbon fibers offer substantially higher axial thermal conductivity (ca. 250 W m−1 K−1 for pitch-based carbon fiber versus ca. 8 W m−1 K−1 for PAN-based carbon fiber). A 3-channel pitch-based carbon/epoxy panel was fabricated and tested to compare to an equivalent PAN-based carbon/epoxy panel. The pitch-based panel produces a much more uniform temperature distribution compared to the PAN-based panel (figure 7). The higher in-plane thermal conductivity reduces in-plane thermal gradients, lowering the average surface temperature and increasing cooling efficiency. Pitch-based carbon fiber composites offer superior cooling performance compared to PAN-based carbon fiber composites, albeit at higher material cost.

Figure 7. Comparison of steady-state surface temperature profiles for 3-channel panels made with PAN-based carbon/epoxy and pitch-based carbon/epoxy. The applied heat flux was 500 W m−2 and the total coolant flow rate was 28.2 mL min−1. Cooling efficiency η is noted for each case.
Download figure:
Standard image High-resolution image3.2. Simulations of in situ battery cooling
3.2.1. Effect of panel material and channel spacing
The Fluent model was validated by experiments across a wide range of operating conditions. Further simulations were also performed that better represent in situ battery pack cooling conditions. These simulations consist of a vascular carbon/epoxy composite panel being heated from both top and bottom surfaces. Composite panels were assumed to have a higher fiber volume fraction of 60% and the coolant inlet temperature was increased to 27 °C. The cooling performance objective for these simulations is to maintain a steady-state temperature below 40 °C.
Three panel materials with different thermal conductivities were simulated: PAN-based carbon/epoxy (k = 2.7 W m−1 K−1 in-plane), pitch-based carbon/epoxy (k = 75 W m−1 K−1), and aluminum (k = 202 W m−1 K−1) as a reference case. Panels with these materials and different numbers of channels were simulated for a total applied heat flux of 500 W m−2 and a total coolant flow rate of 28.2 ml min−1 (figure 8). Aluminum panels performed well and satisfied the target temperature requirement in all cases. Pitch-based carbon/epoxy panels also performed well and met the target temperature requirement for all cases greater than 4 cooling channels.

Figure 8. Simulation results for in situ battery cooling using 3 mm thick panels with different materials and channel spacing. (a) Maximum steady-state surface temperature versus number of channels for panels made with PAN-based carbon/epoxy, pitch-based carbon/epoxy, and aluminum. A heat flux of 250 W m−2 is applied from both sides and the total coolant flow rate is 28.2 mL min−1. (b) Surface temperature contours for various panels.
Download figure:
Standard image High-resolution imagePAN-based carbon/epoxy panels with a small number of cooling channels reach temperatures far above the target value due to hot spots forming between channels (figure 8(b)). As the number of cooling channels increases, the temperature distribution becomes more uniform and the maximum temperature drops significantly. The 16-channel PAN-based carbon/epoxy panel has a maximum temperature below the target value and a temperature profile similar to panels made with pitch-based carbon/epoxy and aluminum. The lower thermal conductivity of PAN-based carbon/epoxy can thus be offset by increasing channel density. Meanwhile, PAN-based carbon/epoxy panels provide significantly higher specific strength, stiffness, and crashworthiness than aluminum panels [16].
The incorporation of a high volume fraction of microchannels can potentially reduce the mechanical properties of a composite [36–39]. However, the 16-channel panel has a channel spacing of 13 mm and a channel volume fraction of only 0.5%. Pety et al recently confirmed that microchannels can be incorporated into a carbon/epoxy composite at this spacing without reducing crashworthiness [29]. Crush tests on microvascular panels revealed no loss in SEA for channels both aligned and misaligned with the loading direction. In addition, Coppola et al demonstrated that microchannels can be integrated into a woven composite at this volume fraction without reducing strength or stiffness [40].
3.2.2. Effect of coolant flow rate and heat flux
The performance of a 16-channel PAN-based carbon/epoxy panel was further analyzed at different applied heat fluxes and flow rates (figure 9(a)). For a given heat flux, maximum surface temperature drops quickly with increasing flow rate at first and then begins to plateau. For a given flow rate, increasing heat flux gives linearly increasing surface temperatures, as expected. Interestingly, the panel can cool to the temperature target even at double the baseline heat flux (1000 W m−2 total) if a high enough flow rate is used (>80 mL min−1).

Figure 9. Simulation results for in situ battery cooling using a 16-channel PAN-based carbon/epoxy panel. (a) Maximum steady-state surface temperature for a 3 mm thick panel subject to various total applied heat flux and total coolant flow rate. (b) Average pumping pressure and power versus flow rate. Results are shown for a total applied heat flux of 500 W m−2.
Download figure:
Standard image High-resolution imagePumping pressure for the 16-channel panel is plotted versus flow rate in figure 9(b). Pressure rises linearly as expected. The maximum pressure (33 kPa) is well within the range of commercial automotive coolant pumps, which operate at pressures up to ca. 120 kPa [41]. Pumping power was also calculated by multiplying pressure by volumetric flow rate (figure 9(b)). Power increases with the square of flow rate as expected. The maximum power is only 56 mW, which is less than 0.001% of the ca. 10 kW of power available from a typical EV battery during operation [2].
3.2.3. Effect of panel thickness
Simulations were also performed on 16-channel panels with thicknesses ranging from 1–5 mm. Channels were centered across the cross-section for all panels. Panel thickness had no significant impact on surface temperature (figure 10) since the panels are all thin enough to prevent large transverse thermal gradients. Thus, without sacrificing cooling performance, thin panels can be used to reduce weight while thicker panels can be used to provide increased mechanical protection.

Figure 10. Effect of thickness on the average and maximum surface temperature of panels subject to in situ battery cooling conditions. Simulations were performed with an applied heat flux of 500 W m−2 and a total flow rate of 28.2 mL min−1. Insets show surface temperature profiles for the 1, 3, and 5 mm thick panels.
Download figure:
Standard image High-resolution image
4. Conclusions
Microvascular carbon/epoxy composites were explored as novel materials for battery packaging. Cooling experiments on PAN-based carbon/epoxy vascular panels showed exceptional performance at high total coolant flow rate (>20 mL min−1) and channel density. Cooling performance was further improved for pitch-based carbon/epoxy panels due to their higher in-plane thermal conductivity (k ≈ 50 W m−1 K−1 versus 2 W m−1 K−1 for PAN-based carbon/epoxy). CFD simulations using Fluent were validated across a wide range of testing conditions by experimental data.
Further simulations confirmed that both pitch-based and PAN-based carbon/epoxy panels with sufficient channel density can satisfactorily cool EV battery packs of the Chevrolet Volt class. The required number of 500 μm cooling channels in a 200 mm long panel is 4 for pitch-based carbon/epoxy and 16 for PAN-based carbon/epoxy.
This study was the first to demonstrate that microvascular composites can serve as cooling panels to keep a heat source within a desired temperature range. The thoroughly validated CFD solver can now be used to optimize composites for other applications requiring active cooling and structural protection. Work is ongoing to develop composite cooling panels for fuel cells, microelectronics, antennas [42], and satellites [43]. Work is also ongoing to design battery cooling panels with more advanced 2D channel networks [44].
Acknowledgments
This work was supported by the Air Force Office of Scientific Research (Grant No. FA9550-15-1-0087) and the Center for Electrical Energy Storage, an Energy Frontier Research Center funded by the U.S. DOE, Office of Basic Energy Sciences. SJP was supported by DoD, AFOSR, National Defense Science and Engineering Graduate (NDSEG) Fellowship, 32 CFR 168a. The authors extend gratitude to Prof. Nancy Sottos for helpful discussion; Kevin Hart, Tony Coppola, Jason Patrick, and Piyush Thakre for composite manufacture and testing; Travis Ross of the Beckman Visualization Laboratory for help with ANSYS Fluent; Philip Barnett for help with figure preparation; and Cytec for the donation of carbon fiber fabric.