
Abstract
We describe a simple and inexpensive method for monitoring nasal air flow resistance using measurement of the small-signal acoustic input impedance of the nasal passage, similar to the audiological measurement of ear drum compliance with acoustic tympanometry. The method requires generation of a fixed sinusoidal volume–velocity stimulus using ear-bud speakers, and an electret microphone to monitor the resultant pressure fluctuation in the nasal passage. Both are coupled to the nose via high impedance silastic tubing and a small plastic nose insert. The acoustic impedance is monitored in real-time using a laptop soundcard and custom-written software developed in LabView 7.0 (National Instruments). The compact, lightweight equipment and fast time resolution lends the technique to research into the small and rapid reflexive changes in nasal resistance caused by environmental and local neurological influences. The acoustic impedance rhinometry technique has the potential to be developed for use in a clinical setting, where the need exists for a simple and inexpensive objective nasal resistance measurement technique.
Export citation and abstract BibTeX RIS
1. Introduction
The nasal airway fulfils an important role in warming, humidifying and filtering air before it enters the lower airways. To do so, it is divided sagittally by the septum, with scroll-like cartilaginous 'turbinates' or 'conchae' protruding from the lateral walls, and with all structures covered with a thick, highly vascular mucosal membrane. This surface is densely innervated with sensory and efferent nerve fibres (Proctor and Adams 1976), and with afferent arterioles supplying beds of capacitance vessels that drain into efferent venules (Al Suleimani and Walker 2007, Fairbanks and Raphael 1993). This organization allows blood to be differentially distributed under autonomic control (e.g. to the turbinates), allowing the nose to perform its role as an adaptive air-conditioner (Proctor and Adams 1976). Exactly how sympathetic and parasympathetic inputs interact to control nasal patency by modulating the vascular tone in different parts of the vascular circuit is complex and not well understood (Eccles and Wilson 1973, Lung et al 1984, DeLong and Getchell 1987, Lung and Wang 1989, Fairbanks and Raphael 1993, Al Suleimani and Walker 2007). This is particularly so in humans, in whom nasal congestion is a common medical complaint.
Under some circumstances, the turbinates swell inward towards the septum, and partially or wholly occlude the nasal passage, producing nasal congestion (Corey et al 2000). Of the superior, middle and inferior turbinates, the inferior turbinates contribute most to nasal airway resistance, and the close juxtaposition of the inferior turbinates and the nasal septum is referred to as 'the nasal valve', contributing approximately half of the resistance of the whole airway (Al Suleimani and Walker 2007).
Overall, unravelling the complex neural control of vascular flow and nasal congestion requires a detailed analysis of the dynamic response of bilateral nasal air flow to many stimuli in many individuals, and so a rapid and cost-effective method of monitoring nasal resistance bilaterally is required. There is a need for an objective measure because there is often little correlation between subjective feelings of nasal patency and nasal resistance (Hilberg 2002, Eccles et al 1990, Houser 2007).
1.1. Available methods for monitoring nasal resistance
Many semi-quantitative measures of nasal patency have been used, each with its own advantages and disadvantages (e.g. visual inspection, nasal speculum, endoscopy, optical rhinometry, condensation on glass, or the 'hum-test'), but there are only three quantitative methods used commonly: rhinomanometry, acoustic rhinometry, and imaging (e.g. CAT scan). The first two are the most useful for studies of the dynamic (i.e. real-time) changes in nasal resistance, as described below.
Rhinomanometry requires measurement of air flow and pressure, with nasal airway resistance given by their ratio (pressure over flow; Kenyon and Pickett 2009). The required air flow through the nose is either generated by an external pump, or more commonly by normal air flow during the subject's tidal breathing. However, poor correlations with other methods and issues of repeatability with this technique have been cited (Hilberg 2002). This may partly be due to turbulence and tissue valving, where the relationship between flow and pressure (and therefore their ratio or resistance) is not linear for the higher flows and pressures generated during breathing (Hilberg 2002). In addition, rhinomanometry cannot make simultaneous measurements of left and right nasal passages (Hilberg 2002).
Acoustic rhinometry has emerged from techniques developed in geology and mining, where sound (clicks or wide-band noise) is sent into the nasal cavity, and cross-sectional area (not resistance per se) as a function of distance through the nose is calculated from the averaged reflected sound waveform by unravelling the multiple delayed echoes using the Ware-Aki algorithm (Hilberg 2002). The estimated cross-sectional area profile of the nasal passages has been shown to correlate moderately well with MRI scans of the nasal passages, but the technique has its limitations. It requires specialized clinical equipment, the minimum time between measurements is limited (due to averaging and echo duration), and is confounded by the variable link between cross-sectional area and resistance with different cross-section profiles (e.g. for the same cross-sectional area a circular duct has a lower resistance than a narrow duct).
Optical rhinometry (ORM) is a more recent technique which monitors the absorption of near-infrared light of different wavelengths as it passes laterally through the nose (as in pulse oximetry; Wüstenberg et al 2007). While elegant and convenient, ORM does not provide independent measurement of the left and right nasal passages, cannot distinguish between the upper and lower turbinates, and monitors equivalent tissue density rather than air-flow resistance.
Overall, there is a need for an inexpensive, convenient technique for the simultaneous bilateral measurement of nasal air-flow resistance, for research and/or clinical purposes. As a result, we have developed a simple objective method of quantifying nasal resistance by monitoring the small-signal acoustic input impedance of each nasal passage in real-time, using minimal and cost-effective equipment. The technique, which we refer to here as acoustic impedance rhinometry (AIR), is similar to the audiological measurement of ear drum compliance with acoustic tympanometry, and allows unilateral or bilateral recording with a time resolution of seconds, and the delivery of air-borne stimuli if required.
2. Methods
As in the measurement of the acoustic impedance of the middle ear in tympanometry, the measurement of acoustic impedance requires the generation of a fixed sinusoidal volume–velocity (a sinusoidal back-and-forth 'sloshing' of air), sound-stimulus delivery tubes, a nosepiece to deliver the sound-stimulus without leaks to the nasal entrance, and a microphone to monitor the resultant pressure fluctuation produced there (figure 1). The nosepieces are inserted into the left and right nares, simultaneously, and the subjects' mouth is held open at a fixed gape by a mouth tube. For a fixed volume–velocity drive, the magnitude of the sound pressure fluctuation at the nasal entrance is proportional to the magnitude of the nasal acoustic input impedance (at moderate frequencies dominated by nasal resistance), which can be calculated as the ratio of the amplitude of the pressure response divided by the amplitude of the volume–velocity stimulus.

Figure 1. (a) The left and right nasal impedance probes that are inserted into the nares as shown in (b). (b) Subject with nose inserts and mouth tube to ensure open gape. (c) Simplified equivalent acoustic circuit of the nose/mouth and measurement system, with a volume–velocity source (VV) feeding into each nasal opening, producing a pressure fluctuation measured by each microphone (MIC). For a fixed volume–velocity air flow, the magnitude of the sound pressure level measured at the nasal entrance is proportional to the acoustic impedance of the nasal passage (dominated by resistance). The air pumps (dcair) for delivering air-borne nasal stimuli are optional. When the air pumps are not connected, the delivery tubes are open to the air and provide a static pressure release to atmospheric pressure without acoustically shunting the nasal openings. The impedance of each nasal passage is most often dominated by the nasal valve resistance (Rvalve), and the passages converge into the upper airway (Rmouth). (d) Equivalent acoustic circuit of the main lumped acoustic components. Each ear-bud speaker (SPK) fed the 433 Hz probe tone to the nosepiece via the inertance (Ls) and resistance (Rs) of a 300 mm silicone tube, which ensured that each ear-bud approximated an ac volume–velocity source. Each electret microphone (MIC) was separated from the nosepiece by the inertance (Lp) and resistance (Rp) of its probe tube, which prevented significant loading of the nasal input impedance. The delivery tube from the optional air pump (dcair) also provided a low-frequency pressure release during swallowing and mouth movements which avoided overloading the microphones. RVALVE represents the variable nasal resistance of the nasal valves, and CNOSE represents the acoustic compliance of the nasal passages. The shared resistance at the back of the throat (RTHROAT) and the shunt resistance (RMOUTH) and compliance (CMOUTH) of the mouth are also shown. Closing the mouth during recording (e.g. while swallowing) increased RMOUTH and created a swallowing artefact (see later).
Download figure:
Standard image High-resolution image2.1. The high-frequency acoustic source
While we have previously used rhinomanometry to monitor nasal patency, using either active tidal breathing or an oscillating pump as a low-frequency airflow source, the method we describe here uses a small-signal high-frequency volume–velocity source: a small earphone delivering an acoustic probe tone through a long silicone tube (figure 1(a)). The acoustic probe tones were generated by a laptop through an inexpensive USB external sound card (Sabrent, USB-SND8), chosen because it could plug into any laptop and provided independent left and right microphone inputs. Sinusoidal probe tones from the two ear-buds were fed to the left and right nasal probes through 300 mm lengths of flexible silicone tubing of 1 mm internal diameter (figure 1(a)) so that each tube's high acoustic impedance ensured that the each ear-bud supplied an approximately fixed volume–velocity stimulus to each nosepiece. The sinusoidal pressure sensors were two small and inexpensive electret microphone elements, mounted in parallel with each ear-bud, and also separated from each nosepiece by a 300 mm length of tubing (1 mm internal diameter). Custom-written software developed in LabView 7.0 (National Instruments) allowed the monitoring of the raw pressure waveforms from the electret microphones, and their frequency spectra, specifically the amplitude of the probe tone which was proportional to the modulus of the nasal impedance. Sampling rate was 44.1 kHz with a sample epoch of 330 ms, with a running average over 10 epochs (3 s).
Detailed experimental notes were taken to allow annotation of impedance traces, and for later removal of any artefacts (e.g. swallowing, coughing). An additional 300 mm tube identical and in parallel to the two others was connected to each nose probe, and provided a low-frequency pressure release, normally to room air. This procedure minimized pressure transients during swallowing and other subject manoeuvres. The high acoustic impedance of these 'air delivery tubes' also ensured that they did not significantly shunt the nasal impedance under measurement. When attached to a small air pump, the third tube also allowed delivery of air-borne stimuli to each nostril.
Regarding nosepiece design, the series acoustic impedance of the acoustic probe within the nose was minimized by cutting all three tubes flush with the surface of the nose insert at the point where the tubes exited the insert into the nose. This ensured that the resistance registered as zero when the nosepiece was out of the nose in free air. Air leaks around the rigid cylindrical inserts were minimized by selecting their diameter to produce moderate tension around the nares on insertion, and tacky inert paper-glue ('Clear Gum', Bostik) was also applied around their edges.
Each subject's mouth was held open at a fixed gape using a 50 mm long section of corrugated plastic pipe of 25 mm diameter, with the tongue under the tube to minimize occlusion at the back of the throat (figure 1(b)). The tube's corrugations avoided buckling of the tube, prevented slippage, and provided a convenient rest place for the teeth. It was found that this open gape was sufficient to keep the component of series resistance contributed by the mouth and throat low and constant relative to nasal resistance. Subjects were also asked to swallow infrequently, and to keep their tongue low in their mouth to avoid glottal closure. Placing the tongue under the mouth-tube helped in this regard. Even so, there was always a component of the measured acoustic impedance that was due to the acoustic impedance through the back of the throat and out the mouth, and this was a common-mode impedance shared by the left and right nasal passages (figures 1(c) and (d)), which produced a small amount of acoustic cross-talk between the two channels (see later figure 3(a)). Because the nasal resistances and throat/mouth resistance were in series, the more occluded the nasal passage, the less significant was the contribution of the throat/mouth impedance.
In summary, an equivalent electrical circuit for our acoustic system is presented in figure 1(d) (mass reactances as inductors, acoustic resistance as electrical resistance, and acoustic compliances as capacitances). The physiological (nasal) component of the system including the left and right nasal resistances and shared throat/mouth resistance is shown above the horizontal dashed line, while the left and right nasal couplers, microphones, volume–velocity sources and stimulus delivery tubes are shown below the dashed line. Each ear-bud speaker (the acoustic equivalent of an alternating (ac) voltage source) is shown feeding into its high-impedance delivery tube, so that the ear-bud/tube combination approximates an acoustic volume–velocity source, analogous to an electrical ac current source. The air pump used to deliver chemical stimuli is the acoustic equivalent of a direct current (dc) source (dcair), while each electret microphone is equivalent to a voltmeter, supplied through the high resistance of each acoustic probe tube. Rnose represents the variable resistances of the left and right nasal passages, respectively. The acoustic compliances of each nasal passage are represented by Cnose. The shared resistance at the back of the throat (Rthroat) and the shunt resistance (Rmouth) and compliance (Cmouth) of the mouth are also shown. Closing the mouth during recording (e.g. while swallowing) dramatically increases Rmouth and confounds the recordings, but the mouth tube and open gape minimized the effects of this resistance.
2.2. Reproducibility and stability of recordings
The stability of the recordings is demonstrated in figure 2, where long-term (3000 s) recordings are shown for three normal subjects 30 min after nasal decongestion with oxymethazoline (500 µg mL−1). Probe frequency was 433 Hz. The resting nasal resistances in the three subjects are expressed as a percentage of the calibration resistance, and varied very little around each individual's mean value over the 3000 s (means and standard deviation for the first 2500 s (before jugular occlusion in the first two subjects) were 6.39±0.40%, 9.77±0.85% and 6.68±0.27% relative to the calibration resistance. The transient rise in resistance at the end of figures 2(a) and (b) is due to a brief bilateral occlusion of the jugular veins to elevate cranial blood pressure, engorge nasal tissue, and elevate nasal resistance, to demonstrate that the measurement system was still fully functional. The small variability in these decongested noses was less than that observed when no decongestant was used (see other figures), suggesting normal dynamic changes in nasal resistance without decongestant, presumably under neural control. Overall, we experienced few problems with condensation within the measurement tubes with the 1 mm diameter silicone tubing (more problems were experienced with earlier trials with narrower polyethylene tubes with internal diameters of 0.7 mm). Because there could also be changes in measured resistance with changes in posture and blood pressure (as described later), subjects were asked to sit very still during recordings. Reproducibility within a single subject over days is demonstrated in figure 5 for one subject, where repeat recordings of nasal decongestion are shown. After decongestion, the resting nasal resistance on the two occasions was within a few percent.

Figure 2. (a)–(c) Three examples of the stability of the AIR measurements over 3000 s. All measurements are from noses decongested with oxymetazoline 30 min earlier. The transient rise in resistance near the end of traces (a) and (b) was due to a brief bilateral occlusion of the jugular veins by clamping the neck on both sides to demonstrate that the resistance was being measured effectively.
Download figure:
Standard image High-resolution image2.3. The phase of the measured acoustic impedance
In this study we optimized the AIR technique to measure acoustic resistance (rather than compliance or mass-reactance), because resistance is important in nasal congestion, and is a good measure of the neurally-controlled dynamic changes of the nasal valve. We initially used a probe frequency of 217 Hz to avoid mains interference (multiples of 50 Hz in Australia), and because the frequency was high enough to allow the small ear-bud drivers to produce sufficient sound level for an adequate signal-to-noise ratio (SNR) at the nasal entrance. As the sensitivity of our equipment improved during the development process, however, a higher drive frequency of 433 Hz was used to improve the SNR in the presence of an unwanted acoustic noise from the air pumps used to deliver a through-flow of air-borne stimulants.
Because the two signal channels of our bilateral measurement system monitored the magnitude of the pressure signal, without routinely recording its phase, we mostly measured only the modulus of nasal acoustic input impedance. That is, we did not routinely discriminate between acoustic resistance, acoustic compliance or mass-reactance. Nevertheless, even at 433 Hz the acoustic impedance was dominated by resistance, with the phase of all measurements within 10° of the phase of the response at the opening of the resistive calibration tube (see later figure 5). These phase-sensitive recordings were done by substituting a fixed phase reference signal (the 433 Hz drive sinusoid) for the microphone signal from one nostril, producing a single-channel phase-sensitive system.
With this arrangement, our 433 Hz probe sound generated a sinusoidal pressure at the entrance of our dummy nose (a resistive calibration tube, see later) that was 104 dB SPL under standard conditions. In a normally functioning nasal passage, with a resistance 10–20% of our standard calibration tube, the sound level within the sealed nasal entrance was between 84 to 90 dB SPL, and the probe tone could just be heard by uncongested subjects as a quiet pure tone (with no higher harmonics present).
To allow checking of the throat/mouth impedance and to improve separation of the contributions from the left and right nasal impedances (i.e. reduce left/right cross-talk), we trialled using different probe frequencies for left and right nasal passage, and also alternated presentation of the left and right probe-tones. The simpler solution that was eventually adopted (requiring less software and producing a simpler data output) was the manual pinching of each sound delivery tube in succession, so that the consequent decrease in signal from the contralateral nasal passage indicated the magnitude of 'cross-talk' between left and right measurements at that time. This is illustrated in figure 3(a).
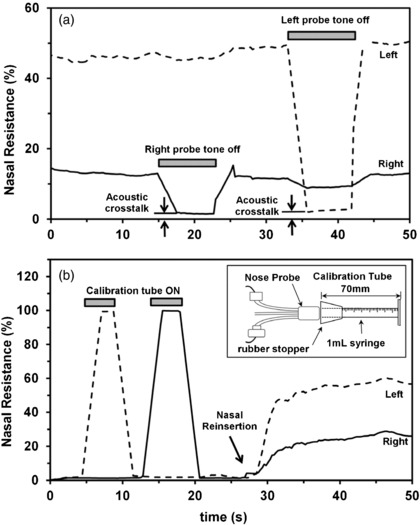
Figure 3. (a) There was some acoustic cross-talk between the left and right nasal passages, which could be measured when the probe tone on one side only was turned off (achieved by pinching off the tube between the nasal probe and the ear-bud speaker). The acoustic cross-talk was largely due to the shared exit resistance through the mouth, but this was minimal with the mouth tube and open gape, particularly in subjects with nasal congestion in whom nasal resistance dominates the total impedance of the system. (b) An example of the calibration process where a standard resistance tube (inset) was coupled to the left (dotted trace) and right (solid trace) nose probe, and the measured resistance set to 100% using software scaling, so that subsequent nasal resistance measurements are expressed as a percentage of this standard resistance.
Download figure:
Standard image High-resolution image2.4. Calibration using a dummy nose
The system could be calibrated conveniently with a calibration tube, made from the barrel of a 1 ml syringe (Terumo) with its tip removed at the 0 ml mark (figure 3(b)). This standard resistance was readily available, easily replicated, and easily understood. Its (laminar flow) resistance could be calculated using Pouiselle's law to be approximately 200 kNs m−5 (confirmed by direct measurement with air flow from a gas bottle, data not shown). This calibration resistance was coupled to the nose probe with a silicone test-tube stopper (which sometimes needed petroleum jelly to ensure an airtight seal). Software-scaling could be adjusted so that the calibration tube corresponded to a 100% reading, and in the remainder of this report nasal impedances are expressed as a percentage of the impedance of this standard calibration tube. Overall, we found that this calibration procedure was only needed occasionally (e.g. to check for leaks in the delivery/measurement tubes and nose probe), although calibration was always confirmed in every measurement. Figure 3(b) shows an example of the calibration procedure. The slow rise and fall in measured resistance was due to the moving point average of the measurement system, and not to any significant delay in the resistance change (which was instantaneous).
3. Results
3.1. Probe re-insertion, reproducibility and stability
The stability of the measurement technique was evident in biological measurements of nasal passages in non-hypersensitive (i.e. non-allergic) subjects, and in nasal passages rendered inert and uncongested by pre-treatment with pharmacological decongestants (figures 2 and 4). Removal and reinsertion of the nasal inserts did not cause significant changes in the measured resistance and impedance phase (see figures 2 and 5). For protracted measurements, swallow artefacts were evident, because swallowing caused transient artefactual changes in the measured resistance due to microphone distortion during the low-frequency transients (figure 4(a)). However, measurements remained stable before and after the swallow artefact. Detailed experimental notes were kept during measurements, recording the time of each subject swallow, to allow removal of swallow artefacts when they occurred. As a result, the fluctuations in nasal resistance we have observed were not due to measurement instability or artefacts, but represented true biological variations in nasal resistance.
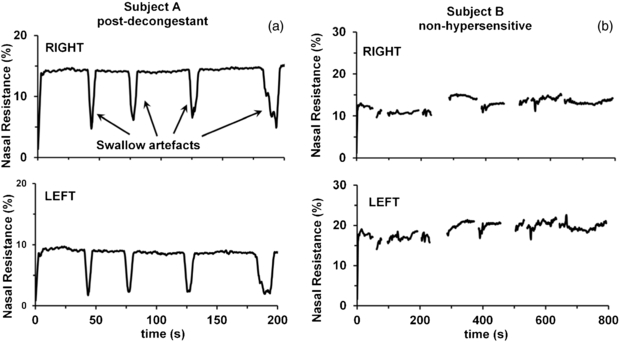
Figure 4. (a) Sample control traces recorded from the right and left nasal passages of a rhinitis sufferer (subject A) pre-treated with pharmacological decongestant bilaterally. Swallowing artefacts (shown here, but removed from subsequent figures) did not alter the magnitude or stability of the ongoing resistance measurement. Nasal resistance has been normalized to the calibration resistance measurement and is expressed as a percentage of the calibration resistance tube. (b) Sample control traces recorded from a non-hypersensitive subject (subject B). The stability of these traces indicated that fluctuations in nasal resistance we have observed elsewhere were not due to measurement instability, but represented biological variations in nasal resistance.
Download figure:
Standard image High-resolution image
Figure 5. (a) Unilateral (left side) measurement of changes in acoustic impedance (upper panel) and impedance phase (lower panel) during nasal decongestion after bilateral application of pharmacological nasal decongestant (phenylephrine). Nasal resistance has been normalized to the calibration resistance measurement. Impedance phase of the nasal passage was measured relative to the impedance phase of the calibration tube. The horizontal line indicates zero degrees phase shift, while +90° represents a pure compliance (an air volume) and −90° represents a pure mass reactance (a slug of air). The small phase-roll (<10°) during decongestion indicates that the acoustic impedance was dominated by resistance in both the congested and decongested nasal cavity. The data points that deviate significantly by more than 10° were due to artefactual changes due to swallowing or reinsertion. (b) A replicate trial two days later of the measurement shown in (a).
Download figure:
Standard image High-resolution image3.2. Effect of decongestants as an example of system performance
Pharmacological decongestion of the nose proved to be the simplest and most effective means of producing large changes in nasal resistance to demonstrate the efficacy of the AIR technique. The active ingredients in over-the-counter decongestants are sympathomimetics (e.g. phenylephrine and oxymetazoline) that reduce blood flow to nasal capacitance vessels by directly stimulating α-adrenergic receptors in the afferent arteriolar smooth muscle (Proctor and Adams 1976). The effect of phenylephrine or oxymetazoline on nasal resistance is illustrated in figures 5 and 6, with data from one typical subject. All decongestant recordings were made at least two days apart, because of the long-lasting effects of the decongestants on the nasal turbinates (including rebound effects).
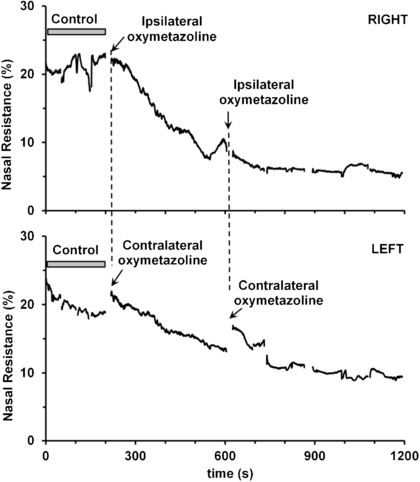
Figure 6. The change in ipsi- and contra-lateral nasal resistance following unilateral application of nasal decongestant (oxymetazoline) to the right nasal passage. Measurements of right (upper panel) and left (lower panel) nasal resistance were made simultaneously. Oxymetazoline was administered via a nasal spray as indicated, and the measurement probe tip was immediately reinserted into the nares.
Download figure:
Standard image High-resolution imageFigure 5 shows two separate trials of nasal decongestion in one subject. After a demonstration of the stability with removal and reinsertion of the nasal probe, decongestant (phenylephrine) was applied bilaterally, during which unilateral (left side) measurements of nasal impedance were made (amplitude and phase, measured relative to the calibration resistance tube). In both trials, nasal resistance dropped by 20 to 30% over 375 s, to plateau at a stable baseline of approximately 20% calibration resistance (a resistance of approximately 40 kNs m−5; figures 5(a) and (b), upper panels). During decongestion, the phase of the measured impedance remained within 10° of the impedance phase of the resistive calibration tube (figures 5(a) and (b), lower panels), indicating that the impedance of the congested and uncongested nasal passage is dominated by resistance. Removal and reinsertion of the nasal probes caused impedance phase rolls of less than 5°, also indicating that there was little change in impedance with small trial-to-trial variations of the depth to which the nasal probes are inserted into the nares.
Figure 6 demonstrates the effect of unilateral (right side) decongestant application on the nasal passages, showing a decrease in resistance bilaterally, but with a slightly faster decrease in the nasal passage exposed directly to the decongestant. It is not clear if the bilateral drop in resistance is due to a spread of decongestant across the midline through blood flow, or more likely due to bilateral neural control of blood flow.
3.3. Postural changes as an example of performance
As another demonstration of the utility of the AIR technique, the effect of posture on nasal resistance was investigated, on the basis that changes in hydrostatic pressure in the nasal blood vessels should cause measurable changes in nasal patency by changing nasal tissue volume (assuming incomplete compensation by any neural reflexes). As illustrated in figure 7, fast increases in nasal resistance were seen when a subject moved from standing to supine, consistent with passive filling of the capacitance vessels with an increase in cranial blood pressure on lying down. Others have previously noted changes in nasal patency with posture, but were limited to monitoring changes over a much longer time course, largely because their measurement procedures were slower than the AIR technique (Kase et al 1994). A similar change with altered cranial blood pressure was also evident with brief jugular blockade (figures 2(a) and (b)).
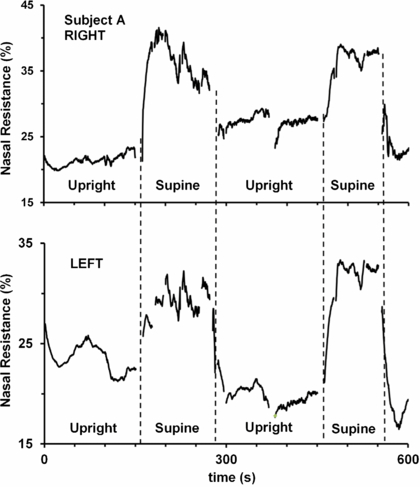
Figure 7. Changes in nasal resistance in right (upper panel) and left (lower panel) nasal passages with changes in posture from the upright position to supine. Lying down presumably increased the pressure in the capacitance vessels in the nasal mucosa, leading to engorgement of the nasal turbinates, causing an increase in nasal resistance that quickly dissipated upon returning the subject to the upright position. Swallow and movement artefacts have been removed from the trace.
Download figure:
Standard image High-resolution image3.4. Unilateral and bilateral chemical challenge as examples of performance
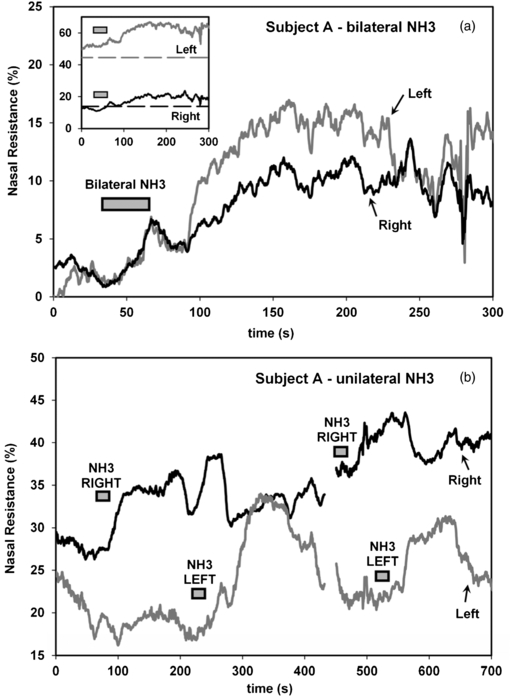
The main impetus in our development of the AIR technique was our interest in environmental stimuli that modulate nasal resistance, particularly in rhinitis. In particular, we had hypothesized that afferent input (temperature sensors, nociceptors, and other afferents) in the nasal cavity may integrate to alter blood flow to the conchae and alter nasal resistance. As an example of the sensitivity of the nasal tissue to direct action of air-borne stimuli, ammonia was used to produce rapid nasal congestion (figure 8). The stimulus-delivery air pump's inlet hose was held briefly above a solution of ammonia (window cleaner). As shown in figure 8(a), when brief (30 s) pulses of ammonia vapour were delivered simultaneously to both nasal passages via the stimulus-delivery tube, nasal resistance increased bilaterally over approximately 125 s by 10% on the right, and 15% on the left. A similar time course was observed with unilateral ammonia application, as shown in figure 8(b). Left and right nasal resistance was measured simultaneously while ammonia vapour was applied unilaterally via the stimulus-delivery air pump, as indicated. There was a clear, reproducible increase in resistance in the nasal passage to which the ammonia stimulus was applied, approximately 100 to 125 s following the stimulus.
Figure 8. (a) Ammonia vapour was delivered to the nasal cavity bilaterally through the stimulus delivery tubes for 30 s. When ammonia was delivered simultaneously to both nasal passages, there was a simultaneous increase in left and right nasal resistance of approximately 10% (right) and 15% (left) within 125 s of the start of the stimulus. The starting value of the resistance has been shifted vertically so that left and right resistances are the same at the start of the stimulus, to emphasize the relative magnitude of the responses in the left and right nasal passages. Inset: the raw traces are shown (solid traces) together with the average pre-stimulus resistance, averaged over the preceding 3 min control period (dotted traces). (b) Unilateral application of ammonia produced a repeatable increase in nasal resistance in the exposed nasal passage, with a maximum between 100 and 125 s after the onset of the stimulus.
Download figure:
Standard image High-resolution image
4. Discussion
Referring to figure 1, our goal was to monitor the input impedance at each nostril, as a representation of the resistance of the nasal valve (Rnose of figure 1). Under most circumstances the acoustic input admittance at the nasal entrance is dominated by the resistance of the nasal valve, in series with the resistance of the rest of the nasal passage, including the resistance out through the throat and mouth. We have demonstrated the AIR technique for monitoring bilateral real-time changes in this nasal resistance. The technique is reliable and reproducible, and requires remarkably little equipment. While we have not analysed the acoustic properties of the nasal passage and upper airway in detail, we have demonstrated that the input impedance to each nostril is normally dominated by the resistance of the nasal valve, and dynamic changes in the nasal valve resistance in response to various stimuli can be readily observed using the AIR technique.
While we have not determined the detailed acoustic properties of the upper airway, we can represent the major acoustic components of recording system and upper airway by a minimal small-signal acoustic circuit (figure 1; Jackson 1944). At our probe frequency of 433 Hz, the wavelength of sound is approximately 0.8 m, and the resistance of the delivery tubes is so high, that standing waves within the equipment and upper airway are of little concern, and only lumped acoustic elements are considered. Although Helmholtz resonances within the upper airway do occur (as in acoustic phonetics), we have ignored them, assuming that the dominant feature changing the magnitude of the response is the resistance of the nasal valve near the entrance of each nostril, with minimal contribution from changes in nasal volumes. If changes in the resonances of the upper airway were occurring, we would expect concomitant changes in impedance phase to occur. As shown in figure 5, even during decongestion accompanied by very large changes in measured resistance, minimal changes in phase occurred.
Like any technique for monitoring nasal congestion, AIR has its advantages and disadvantages. Its advantages are its speed, low cost, bilateral measurement, potential for a hand-held device, and its ability to measure (laminar) resistance to air flow directly while the subject breathes normally, but through their mouth. Its disadvantages are (a) it is a small-signal technique, and offers no view or insight into changes to nasal airflow at high flow rates (e.g. tissue valving); (b) it offers no insight into where along the nasal passage an obstruction might occur (unlike acoustic rhinometry), however the dominant resistance is most often the nasal valve; (c) it requires the subject to keep their mouth open and to breathe through it, with no nasal breathing possible; (d) there is the potential to confuse nasal resistance, inertance and compliance changes unless phase-sensitive measurement of acoustic impedance is performed, although under most circumstances resistance will dominate; (e) there is some cross-talk between the left and right nasal passages, largely because of the shared exit resistance through the mouth. This is minimal if subjects maintain their open mouth gape using the mouth tube, especially in subjects with high nasal resistance, although there is the potential for cross-talk if subjects are unable to accomplish this. Even so, the extent of the acoustic cross-talk is evident by sequential blocking of the left and right delivery tubes (figure 3(a)).
Overall, the AIR technique offers a chance to observe small and fast reflexive changes in nasal resistance caused by environmental and local neurological influences, hopefully enabling further research into the many inputs controlling nasal blood flow and nasal congestion. The AIR technique is suitable for short- or long-duration studies of nasal congestion, including the effects of posture, and nasal and other stimulants, as in allergic rhinitis and irritative vasomotor rhinitis. The air-tight seal around the nasal vestibule excludes unwanted airborne (and thermal) stimuli from the nasal cavity during recordings, while well-controlled airborne stimuli can be delivered to the nasal cavity via the stimulus delivery tube. The technique can monitor rapid changes in nasal resistance, within the time scale of neural responses, and may prove useful for clinical nasal provocation tests, where the monitoring of rapid changes in nasal patency is essential to distinguish time-locked responses to nasal allergen challenges (Pirila et al 1997). Overall, the AIR technique should prove invaluable in studies of the neural control of the nasal valve, and has the potential to be developed for use in a clinical setting, where a need exists for simple and inexpensive objective method of measuring nasal resistance, possibly with a small hand-held probe.