Abstract
Miniature, wearable sensor modules are a promising technology to monitor activities of daily living (ADL) over extended periods of time. To assure both user compliance and meaningful results, the selection and placement site of sensors requires careful consideration. We investigated these aspects for the classification of 16 ADL in 6 healthy subjects under laboratory conditions using ReSense, our custom-made inertial measurement unit enhanced with a barometric pressure sensor used to capture activity-related altitude changes. Subjects wore a module on each wrist and ankle, and one on the trunk. Activities comprised whole body movements as well as gross and dextrous upper-limb activities. Wrist-module data outperformed the other locations for the three activity groups. Specifically, overall classification accuracy rates of almost 93% and more than 95% were achieved for the repeated holdout and user-specific validation methods, respectively, for all 16 activities. Including the altitude profile resulted in a considerable improvement of up to 20% in the classification accuracy for stair ascent and descent. The gyroscopes provided no useful information for activity classification under this scheme. The proposed sensor setting could allow for robust long-term activity monitoring with high compliance in different patient populations.
Export citation and abstract BibTeX RIS

Content from this work may be used under the terms of the Creative Commons Attribution 3.0 licence. Any further distribution of this work must maintain attribution to the author(s) and the title of the work, journal citation and DOI.
1. Introduction
Miniature wearable sensor modules are a promising technology to monitor activities of daily living (ADL) over extended periods of time (Nyan et al 2004), especially for aspects such as activity levels (Bouten et al 1997), changes in habits (e.g. mental/physical decline in the elderly population (Hao and Foster 2008)), or functional recovery (e.g. following orthopedic or neurological injury) outside the clinical environment (Uswatte et al 2000). A variety of sensors attached at different anatomical locations have been used in activity classification studies under different settings (Bao and Intille 2004, Stikic et al 2008, Bonomi et al 2009, Atallah et al 2010, Roggen et al 2011). The investigated activities range from sedentary (e.g. eating or drinking, reading, working on a computer) to ambulatory activities (e.g. walking, running, cycling, mopping). Table 1 presents a non-exhaustive list of previous works along with the selection and placement of sensors and the achieved overall activity classification accuracy.
Table 1. Classification accuracy of previous studies which explicitly report values for stair ascent and descent.
| Ref. | Sensors on module (no.) | Placement (no. of modules) | No. of activities | Training (Testing) | Classifier | Overall acc. (%) | Ascent acc. (%) | Descent acc. (%) |
|---|---|---|---|---|---|---|---|---|
| 1 | 2D accelerometer (1), | Waist (1) | 3 | Combined | kNN | NA | 83.30 | 95.80 |
| digital compass (1), | (Combined) | |||||||
| light detector (1) | ||||||||
| 2 | 3D accelerometer (1) | Hip (2) | 4 | Combined | ICA | NA | 83.00 | 84.00 |
| (Combined) | ||||||||
| 3 | 2D accelerometer (2) | Shoulder (2), hip (2), | 5 | User | Naive Bayes | ∼85.00 | ∼80.00 | ∼80.00 |
| elbow (2), ankle (2), | (User) | |||||||
| wrist (2), knee (2) | ||||||||
| Wrist (1) | 8 | NA | ∼ 5.00 | ∼45.00 | ||||
| 4 | 3D accelerometer (1), | Wrist (1) | 6 | Combined | Decision | 87.00 | ∼55.00 | ∼80.00 |
| light sensor (1) | (Combined) | trees (C4.5) | ||||||
| 5 | 3D accelerometer (1) | Thigh (1) | 6 | Combined | Neural | 91.70 | 61.50 | 44.30 |
| (Combined) | networks | |||||||
| 6 | 3D accelerometer (1) | Wrist (1), ankle (1) | 7 | Combined | kNN | 96.98 | 86.54 | 90.38 |
| (User) | ||||||||
| 7 | 1D accelerometer (2) | Thigh (1) | 7 | NA | Konohen SOM & | NA | 42.00 | 64.00 |
| Markov models | ||||||||
| 8 | 3D accelerometer (1) | Pelvis (1) | 8 | User | Plurality voting 65.15 | 42.86 | 0.00 | |
| (User) | ||||||||
| 9 | 3D accelerometer (1) | Wrist (2), thigh (1), trunk (1) | 17 | Combined | kNN | 90.61 | 79.20 | 73.33 |
| (Combined) |
1 Lee and Mase (2001); 2 Mantyjarvi et al (2001); 3 Kern et al (2003); 4 Maurer et al (2006); 5 Kwapisz et al (2011); 6 Wang et al (2012); 7 Van Laerhoven and Cakmakci (2000); 8 Ravi et al (2005); 9 Pirttikangas et al (2006).
Despite acceptable accuracy rates, it can be seen that cases where higher accuracies are reported either covered a reduced number of activities, therefore restricting the applicability to the identification of ADL, or used a large number of sensor modules, reducing comfort and non-obtrusiveness for the user. Further, in many of these studies, accurate classification of stair walking, and even more so differentiating stair ascent from stair descent, has proven to be a challenge. Yet, in order to determine the overall activity level and independence of subjects/patients in their home environment, being able to identify and discriminate stair ascent and descent is a key aspect. Stair ascent and descent are different activities with distinct biomechanical properties, including joint loading, energy expenditure, and even balance and performance time (Riener et al 2002, Verlaan et al 2009). Stair climbing can be a useful indicator of autonomy during the early rehabilitation stages of discharged patients (Paolucci et al 2008), and is routinely assessed in the clinic (e.g. 12-Step Stair Test). Furthermore, stair-climbing-based assessments have shown moderate-to-high correlation with test scores such as the Berg Balance Scale and the Fugl-Meyer Lower Extremity Assessment (Ng et al 2013). Finally, a detailed analysis of level walking and stair ascent/descent is needed to evaluate subject's function/dysfunction during daily activities (Coley et al 2005). For example, the presence of stair ascent but absence of stair descent can be an indicator of fear of falling in the elderly population (Butler et al 2009).
Some studies have tried to tackle this problem by grouping both activities in a single 'stair climbing' activity (Bao and Intille 2004) or even by grouping these activities together with level walking (Foerster et al 1999). The works presented in table 1 considered stair ascent and descent as individual activities and explicitly reported a classification accuracy for these activities, which is, in most cases, well below the overall classification accuracy.
There are currently no guidelines as to the selection and optimal placement of sensors for such investigations. The optimal selection and placement site of sensors as well as the contribution of different sensor signal features for the classification of ADL has received little interest and therefore presents room for improvement. Optimal placement of sensor modules could reduce the required number of modules, guaranteeing good performance and compliance while minimizing discomfort for the subject. Knowing specifically which sensors provide useful information for the classification of ADL could further allow for more compact and lightweight designs, as well as optimized power management schemes for an extended runtime.
This paper investigates the optimal placement site and sensor selection using ReSense, our previously developed sensor module (Leuenberger and Gassert 2011), for the classification of 16 ADL in 6 healthy subjects under laboratory conditions. ReSense incorporates a 6 degree-of-freedom inertial measurement unit (IMU) and a barometric pressure sensors (BPS), which serves as an altimeter. Although BPSs have previously been used in combination with inertial sensors to successfully discriminate real fall events from ADL (Bianchi et al 2010) or to evaluate energy consumption of different physical activities (Ohtaki et al 2005), their specific contribution to the classification of ADL has not been investigated before. We found that the addition of the altitude information significantly increases the classification accuracy of practically all of the 16 selected ADL, specifically allowing a clear distinction between stair ascent and descent. We further show that the gyroscope information does not contribute to the classification of the selected activities. As gyroscopes are energetically the most demanding, advanced energy management could allow wearable sensor modules to acquire data for longer periods of time. We also show that these modules can optimally be worn on the wrists, maximizing user compliance.
The manuscript is organized as follows. Section 2 gives a detailed description of how the study was conducted. Section 3 presents the obtained results, which are analyzed and discussed in section 4. Section 5 closes the paper with our overall conclusions together with insights on possible future work.
2. Materials & methods
An overview of the materials and methods used in the present study is provided in figure 1.
2.1. Subjects
Six healthy subjects (4 males, 2 females; mean age 50.33 ± 21.59 years old) volunteered for this study. The study was approved by the local ethics committee. All participants provided written informed consent before being included.
2.2. Setting
The measurements took place indoors in a room and in a hall under common, everyday environmental conditions (light, noise, etc.) at the Zurich Center for Ambulatory Rehabilitation (ZAR). The room was previously prepared with all the necessary furniture (e.g. bed, chair, table) and items (e.g. toothbrush, knife, peeler) required for the procedure. The hall provided large obstacle-free spaces where the subjects could perform some activities more easily and naturally than in a reduced, confined space (e.g. walking, running, stair climbing). Both areas were close to each other, thus reducing unnecessary transfers as much as possible.
2.3. Data collection
Data was acquired with ReSense modules (figure 2), watch-sized, low-power IMUs previously developed at our laboratory, which incorporate a BPS. Data from the latter is used to calculate an absolute altitude value with a resolution of 0.5 m. The module measures  mm and weighs 10 g, including a 200 mAh battery and a microSD card. With its intelligent power management scheme, this module achieves a runtime of more than 24 h for continuous sampling of all sensors at a frequency fs of 50 Hz. If the gyroscopes are deactivated, the runtime can be extended to over 12 days (290 h). These runtimes are further doubled with and intelligent online detection of active/inactive periods. A detailed description of the sensor module and its technical specifications can be found in Leuenberger and Gassert (2011).
Each subject wore five ReSense modules to record movement on both the left (RSLW) and right wrist (RSRW), chest (RSC), and the left (RSLA) and right ankle (RSRA), as shown in figure 3. Each module was enclosed in a rapid prototyped housing, which provided protection, and was fixed to the body with an elastic band with VELCRO® straps, thereby reducing artifacts that may be caused by loose placement (Mathie et al 2004). The total weight of each module, including the housing and elastic strap, was 21 g. The modules were configured to have a theoretical fs of 50 Hz. This was sufficient for the purpose of this study since it has been shown that most human movements occur in a frequency band between 0.3 and 3.5 Hz (Sun and Hill 1993), that 99% of their energy is contained below 15 Hz (Antonsson and Mann 1985), and that frequencies within the range of human body movement below 20 Hz are sufficient to assess daily physical activity (Bouten et al 1997).
Subjects were instructed to perform a series of 16 different activities, listed in table 4, as naturally as possible. In clinical routine these activities are typically tested/observed in occupational therapy to determine the level of dependence of the patient. These were selected based on three different criteria. First, we intended to include a wide variety of activities covering the three types of movements indicative of different activity types, respectively recovery phases, which we desire to distinguish, i.e. whole body movements (e.g. walking, running, stair ascent, stair descent), gross (e.g. brushing teeth, drinking) and dextrous (e.g. writing, cutting food, peeling a carrot) upper-limb activities. We also included movements that are typically requested as part of standard clinical assessments of motor function. For example, the Box and Block Test (BBT) was included since it is a well-accepted and widely used assessment of unilateral gross manual dexterity (Desrosiers et al 1994). Stair climbing is a useful indicator for the assessment of patients undergoing rehabilitation under different scenarios (Ng et al 2013, Paolucci et al 2008). Finally, we also considered activities that have been previously used to test the performance of ADL monitoring systems, such as walking, standing, and laying down (Bao and Intille 2004, Maurer et al 2006, Pirttikangas et al 2006).
At the beginning and at the end of each data collection session (immediately before fixing the modules on the subjects and immediately after removing them), the five modules were shaken eight times together and in the same direction in order to generate a shaking-marker event (SME). SMEs would produce characteristic, notable peaks in the accelerometer recordings which would allow precise synchronization of the sensor data from the ReSense modules for post-experiment analysis.
All the performed activities (including the SMEs) were filmed with a video camera in order to obtain an objective, unbiased time-stamped reference of the movements performed by the subjects. In average, a data collection session lasted 11.24 ± 0.79 min, for a total of 67.46 min of data.
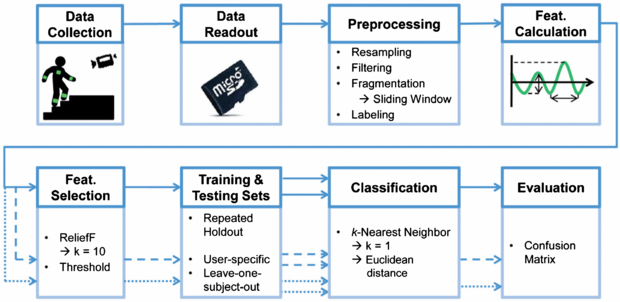
Figure 1. Overview of the materials and methods used in this study. Data were collected from six subjects each wearing five ReSense modules and were transferred to a computer for offline analysis via the integrated microSD card. The sensor signals were preprocessed before computing a set of predefined features. A reduced group of features was chosen based on the weights assigned by the ReliefF feature selection algorithm. Data were partitioned in different ways, according to the chosen validation method, and fed to the kNN classifier in the form of testing and training data sets. Finally, the performance of the system was evaluated using a confusion matrix. From the feature calculation stage, the solid arrow represents the original data set comprising all modules and all sensors (validated under the repeated holdout protocol), the dashed arrow represents the wrist module data for all sensors, and the dotted arrow represents the wrist module data excluding information from the BPS (these last two were validated additionally under the user-specific and leave-one-subject-out protocols).
Download figure:
Standard image High-resolution image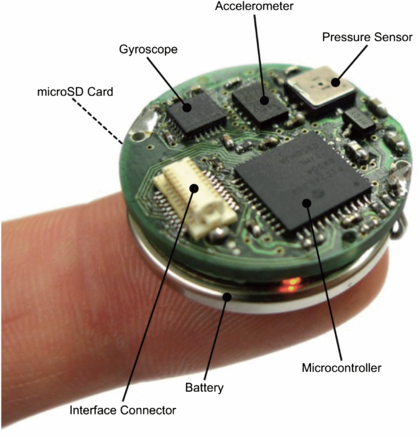
Figure 2. ReSense module with labels for the main components. The module measures  mm and weighs 10 g, including a 200 mAh battery and a microSD card.
Download figure:
Standard image High-resolution image
Figure 3. Placement site and orientation of the five ReSense modules worn during the experiment.
Download figure:
Standard image High-resolution image2.4. Preprocessing
Data from the ReSense modules were transferred from the integrated microSD card to a PC for post-experiment offline analysis. The raw sensor signals required several preprocessing steps, which are described in the following.
2.4.1. Resampling
Due to variability in the accuracy of the onboard clock, sampling was not performed at exactly 50 Hz. In order for the signals to be further analyzed (segmented), they needed to contain the same amount of information (i.e. number of samples) per second. Sensor signals were resampled at 50 Hz with the help of the SMEs and the video recordings, matching the acceleration peaks. The real fs was calculated by dividing the number of samples by the elapsed time. Resampling was done with an anti-aliasing finite impulse response (FIR) lowpass filter (LPF) with a Kaiser window of β = 25 (chosen empirically).
2.4.2. Filtering
Each of the sensor signals recorded by the ReSense modules required a particular filtering stage. The triaxial accelerometer signals were first passed through a median filter with size n = 3 in order to remove any noise spikes (Mathie et al 2002). The resulting signals contain the acceleration components due to gravity (ag) and the acceleration components due to body movement (abm) linearly combined. In order to separate them, the signals were passed through an infinite impulse response (IIR) fourth order elliptic LPF with a cut-off frequency fc of 0.3 Hz, a passband ripple of 0.01 dB, and a minimum stopband attenuation of 100 dB. Forward and time-reversed filtering was performed to avoid phase distortion (Mitra and Kuo 1998), thereby resulting in an overall eighth order LPF with a passband ripple of 0.02 dB and a minimum stopband attenuation of 200 dB. The lowpass filtered signal acc{x, y, z}posture, which contains the ag related to posture and orientation, was subtracted from the median filtered signal to yield acc{x, y, z}active, which contains the abm related to activity and motion (Karantonis et al 2006). This process is illustrated in figure 4.
Each of the triaxial gyroscope signals was passed through a highpass filter with the same specifications as the previous LPF used for the accelerometer data, including the fc. This was done in order to remove any possible undesired low frequency components inherent to gyroscope measurements (e.g. drift). Forward and time-reversed filtering was also performed.
The altitude signal was passed through an IIR second order Butterworth LPF with a fc of 0.07 Hz. Again, forward and time-reversed filtering was performed, resulting in an overall fourth order filter. These specifications were chosen empirically. As only the relative altitude change provides useful information regarding the altitude of the module, the DC component was removed. This was achieved by subtracting the arithmetic mean of the signal from itself.
Segments of the resampled and filtered accelerometer, gyroscope, and BPS signals for stair ascent/descent and level walking phases for a representative subject are shown in figure 5.

Figure 4. Filtering and decomposition of the raw acceleration signals into their postural and active components, the first containing information related to posture and orientation and the latter containing information related to motion and activity. Forward and time-reversed low-pass filtering guarantee a phase-distortion free signal.
Download figure:
Standard image High-resolution image
Figure 5. Resampled and filtered segments of accelerometer, gyroscope, and BPS signals during stair ascent/descent/ascent and level walking phases for a representative subject. The shown accelerometer and gyroscope signals correspond to the x axis.
Download figure:
Standard image High-resolution image2.4.3. Fragmentation
Each filtered signal was divided into smaller time segments using a sliding-window. With this method, the signal was fragmented into windows of fixed length with no inter-window gaps (Preece et al 2009b). This approach was selected due to the fact that the wide variety of activities performed by the subjects made it difficult to apply an event- or activity-based approach and because it is simple to implement. A window size N of 128 samples was chosen, representing 2.56 s of data with the given fs. This window length has been shown to provide better recognition rates than other window sizes (Preece et al 2009a, Wang et al 2007), allows capturing at least one complete cycle of periodic activities (e.g. a step while walking or stair climbing), and enables high-speed FFT calculations performed later. An overlap of 50% (i.e. 64 samples or 1.28 s) between windows was used, which has proven successful in previous works (Bao and Intille 2004, Preece et al 2009a).
2.4.4. Labeling
Following fragmentation, each 2.56 s window was tagged with a label corresponding to the performed activity. This was done offline by matching the beginning and end of the window with the video recordings by visual inspection, using the SMEs as references in both.
It is important to note that all the data streams of all the modules were labeled according to the activity that was being performed by the subject at a given time and not by the activity that was performed by each body part. This greatly simplified the labeling task, which is usually a very time-consuming part in this type of studies. For example, if the subject performed the BBT, sensor data from the wrists, chest, and ankles were labeled as BBT, even though the activity of the chest and ankles resembled standing.
In the end, a total of 17 different labels were applied: one for each activity plus an additional one for the transitions in between activities (including the windows which captured the SMEs). Although several previous works have focused on activity/postural transitions (Wong and Wong 2008, Najafi et al 2002, Godfrey et al 2011), this is beyond the scope of this study. Therefore, for further analysis, windows labeled as transition were discarded, leaving only the labels corresponding to the 16 activities.
2.5. Feature calculation
For each labeled window, a group of features was calculated that characterizes the data from the different sensors. Features in both time and frequency domain (the latter in the magnitude spectrum) were calculated. The features for the inertial sensors were selected based on those previously suggested in activity classification studies (Curone et al 2010, Ravi et al 2005, Maurer et al 2006, Bouten et al 1997, Karantonis et al 2006, Herren et al 1999, Baek et al 2004, Bao and Intille 2004, Stikic et al 2008). The features for the BPS (i.e. for the altitude profile), were chosen empirically with the objective of describing the potential altitude variations as well as possible. The complete feature set for each sensor is shown in table 2. Note that different features were extracted from acc{x, y, z}posture and from acc{x, y, z}active.
Table 2. Calculated features for each of the sensors integrated into ReSense.
| Domain | Feature | Acc. (post.) | Acc. (act.) | Gyro. | Alt. |
|---|---|---|---|---|---|
| Time | Mean | ✓ | |||
| SD | ✓ | ✓ | ✓ | ✓ | |
| Variance | ✓ | ✓ | ✓ | ✓ | |
| IQR | ✓ | ✓ | ✓ | ✓ | |
| Perc. {3, 10, 20, 97} | ✓ | ✓ | ✓ | ✓ | |
| P2P amplitude | ✓ | ✓ | ✓ | ✓ | |
| Mean P2P amplitude | ✓ | ✓ | ✓ | ||
| Excessive kurtosis | ✓ | ✓ | ✓ | ||
| Slope | ✓ | ||||
| RMS | ✓ | ✓ | ✓ | ✓ | |
| SMA | ✓ | ||||
| XY correlation | ✓ | ||||
| YZ correlation | ✓ | ||||
| XZ correlation | ✓ | ||||
| Frequency | Max. freq. component | ✓ | |||
| Energy | ✓ | ✓ | |||
| Entropy | ✓ | ✓ | |||
| Excessive kurtosis | ✓ |
SD: standard deviation, IQR: inter-quartile range, Perc. {3, 10, 20, 97}: percentiles 3, 10, 20, and 97, P2P: peak-to-peak, RMS: root mean square, SMA: signal magnitude area.
2.6. Data subsets
Based on the original data set, which included information from all modules and features from all sensors, two additional subsets were extracted. The first subset included data from all the sensors of the wrist modules only. The second subset is just like the first, except that all the features from the altitude sensor were discarded. This was done in order to investigate the optimal sensor selection and placement site.
The original set, the complete wrist subset, and the altitude-discarded wrist subset are represented in figure 1 by solid, dashed, and dotted arrows, respectively.
2.7. Feature selection
The overall feature set comprised 131 different features. Besides having high dimensionality, which could result in computational performance issues, the original set may contain redundant or irrelevant features, which could negatively affect the results of subsequent analysis. Therefore, it was necessary to define a reduced feature set. This new set should have a high discriminative ability, i.e. it should show little variation between the same activities across different subjects but considerable variation between different activities (Preece et al 2009b).
Feature selection was done using the ReliefF algorithm (Kononenko 1994), which in our previous experience has proven to be effective. This method is an improved version of the original Relief algorithm proposed in Kira and Rendell (1992), since it is more robust and can deal with incomplete and noisy data. The basic idea is to calculate the quality of attributes, selecting those that maximize distinction between classes. The algorithm randomly selects an instance, searches for K nearest neighbors from the same class (called nearest hit H) and for K nearest neighbors from each of the other classes (called nearest miss M). It then updates a quality estimation W[A] for all A attributes according to the values of the chosen attribute and the averaged contribution of H and M. The assigned weight ranges from −1 to 1, with large positive values given to important attributes (Robnik-Sikonja and Kononenko 2003). The algorithm iterates through all of the attributes. In this case, a value of 10 was chosen for K, as suggested in Kononenko (1994).
Finally, a subset of the positively weighted attributes was selected. This was done by setting an empirical threshold, which was calculated as the average of the positive-valued attribute weights. All the features with a below-threshold weight were discarded.
2.8. Training & testing sets
Following the reduction of the feature set, it was necessary to separate the data into training and testing sets in order to perform a robust performance evaluation and make the most out of the data. Three protocols where chosen, which are explained in the following.
2.8.1. Repeated holdout
The data of all the subjects were put together into a big pool, randomly sampled and separated into a training data set and a testing data set with a proportion of two-thirds and one-third, respectively (Witten and Frank 2011). It is important to note that even though random sampling was performed, a proper class representation in both sets was guaranteed.
2.8.2. User-specific
The data of each subject were put together as a data pool. Then again, random sampling with proper class representation was performed to generate a training data set and a testing data set with a proportion of two-thirds and one-third for each subject, respectively (Witten and Frank 2011).
2.8.3. Leave-one-subject-out
The data of all subjects except for one were put together as the training set. The data of the remaining subject were put together as the testing set. Note that in this case there is no need to perform random sampling.
2.9. Classification
In all the validation protocols, the training and testing data sets served as inputs to the classification scheme. We chose the k-nearest neighbor (kNN) algorithm for classification, since it is straightforward, flexible, simple to implement, and its good performance has been demonstrated in previous works (Foerster et al 1999, Preece et al 2009a, van den Berg-Emons et al 2000). It is an instance-based learning scheme in which a multidimensional space is constructed. In this space, each dimension corresponds to one feature. The features are normalized (usually to a range between −1 and 1) in order to avoid distortion caused by disparity in the data range for each dimension (Duda et al 2000). This space is then populated with training points. A testing point is then placed in this space and its class is predicted according to the majority of the k-nearest neighbors of training data (Preece et al 2009b). The algorithm can be tuned by choosing different values of k. Typically, k varies from 1 to a small percentage of the training data and must not be a multiple of the number of classes (Theodoridis and Koutroumbas 2003). Different metrics can be used to calculate the distance to the neighbors, e.g. Euclidean, the Manhattan or city-block, kD-tree, and ball tree metrics (Witten and Frank 2011). In our case, the best results were obtained for k = 1 with an Euclidean distance metric.
The classifier outputs a list of labels that predict each of the activity labels of the testing data. For the repeated holdout protocol, the classifier was run ten times in order to reduce the effects of random sampling. For the user-specific protocol, 10 iterations were performed per subject (for the same reason), for a total of 60 iterations. In the case of the leave-one-subject-out protocol, only 6 iterations were run, i.e. one per subject. There was no need to perform several iterations in the latter, since no random sampling was involved.
2.10. Evaluation
To quantify and evaluate the performance of each iteration, no matter the data subset or validation method, a confusion matrix was used. The total accuracy was calculated as the sum of successful classifications (elements of the main diagonal of the confusion matrix) divided by the total number of performed classifications (sum of all the elements of the confusion matrix). The reported overall accuracy and its SD correspond to the arithmetic mean and SD of the total accuracies obtained from the corresponding iterations.
The data from all five ReSense modules of all subjects were grouped as a complete set (RSLW, RSRW, RSC, RSLA, RSRA), wrist set (RSLW, RSRW), chest set (RSC), and ankle set (RSLA, RSRA). Each of these groups was evaluated under the repeated holdout validation protocol for different activity subsets: whole body (walk, run, stair descent, stair ascent, stand, sit, lie down), gross upper limb (BBT, brush teeth, don/doff jacket, drink), dextrous upper limb (butter bread, cut food, don/doff shoe, peel carrot), and all activities together. Then, the best resulting subset was chosen for a deeper analysis under the user-specific and leave-one-subject-out protocols.
3. Results
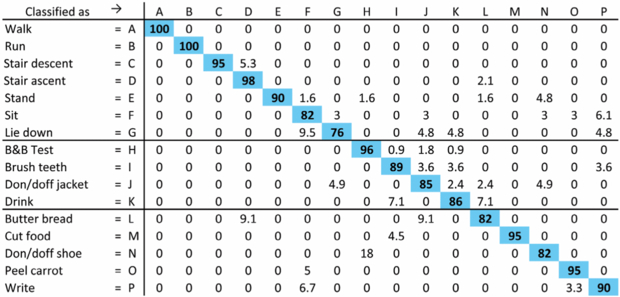
A sample (normalized) confusion matrix for one iteration of the repeated holdout protocol for the complete data set from the two wrist modules is shown in figure 6. The diagonal shows correctly classified activities, while the off diagonals show false classifications. In this case, an overall classification accuracy of 92.5% was achieved.
Figure 6. Sample confusion matrix obtained for one iteration of the repeated holdout protocol in the complete wrist data subset. Two-thirds of the total data were included in the training set, while the remaining third was included in the testing set. The diagonal (highlighted cells) indicates successful classifications, while the off-diagonals represent false classifications. Normalized results are shown for better understanding. In this case, a total classification accuracy of 92.50% was achieved.
Download figure:
Standard image High-resolution image
The activity classification accuracies for the considered module subsets are summarized in table 3. With an average classification accuracy of 96.18%, the wrist module subset outperformed the rest. Therefore, this subset was chosen for a deeper analysis under the user-specific and leave-one-subject-out protocols. These results are shown in table 4. Inclusion of the BPS data resulted in an increase of the classification accuracy of 9.5, 20, and 5 percentage points for the stair ascent, descent, and level walking phases, respectively, under the repeated holdout protocol.
Table 3. Activity classification accuracies for different module locations under the repeated-holdout validation protocol.
| Considered module | Whole body | Upper limb (gross) | Upper limb (dextrous) | All activities | Average |
|---|---|---|---|---|---|
| All modules | 96.27 ± 0.38 | 88.87 ± 0.73 | 87.61 ± 0.49 | 83.59 ± 0.53 | 89.08 ± 5.29 |
| Wrists | 97.01 ± 0.31 | 98.10 ± 0.67 | 96.86 ± 1.01 | 92.78 ± 0.37 | 96.18 ± 2.33 |
| Chest | 84.61 ± 1.21 | 94.78 ± 1.88 | 92.28 ± 2.42 | 83.66 ± 1.52 | 88.83 ± 5.53 |
| Ankles | 95.78 ± 1.16 | 91.44 ± 2.11 | 82.75 ± 3.46 | 72.70 ± 1.99 | 85.66 ± 10.20 |
Table 4. Performed activities and their classification accuracy for the wrist modules under different validation protocols.
| Classification accuracy (%) | |||||||
|---|---|---|---|---|---|---|---|
| Repeated holdout | User-specific | Leave-one-subject-out | |||||
| Type | Activity | All sensors | Alt. excluded | All sensors | Alt. excluded | All sensors | Alt. excluded |
| Whole body | Walk | 100.00 | 95.74 | 100.00 | 95.69 | 93.21 | 65.12 |
| Run | 97.22 | 92.45 | 94.50 | 87.04 | 12.90 | 12.90 | |
| Stair descent | 92.83 | 83.33 | 96.02 | 90.56 | 92.45 | 26.42 | |
| Stair ascent | 96.56 | 76.39 | 96.22 | 85.93 | 68.61 | 8.03 | |
| Stand | 89.14 | 80.98 | 91.76 | 90.25 | 70.17 | 70.17 | |
| Sit | 85.89 | 76.72 | 94.71 | 92.33 | 31.63 | 22.45 | |
| Lie down | 81.94 | 55.87 | 85.25 | 78.44 | 50.79 | 34.92 | |
| BBT | 97.35 | 93.73 | 99.03 | 96.80 | 57.06 | 64.26 | |
| Upper-limb | Brush teeth | 91.61 | 80.00 | 90.43 | 93.28 | 32.93 | 30.49 |
| (gross) | Don/doff jacket | 82.41 | 65.95 | 86.75 | 75.96 | 62.81 | 57.85 |
| Drink | 89.55 | 87.41 | 98.44 | 88.52 | 55.00 | 60.00 | |
| Butter bread | 80.17 | 76.32 | 94.74 | 89.19 | 0.00 | 2.86 | |
| Upper-limb | Cut food | 96.77 | 82.33 | 96.40 | 91.74 | 14.06 | 1.56 |
| (dextrous) | Don/doff shoe | 84.00 | 66.48 | 83.62 | 68.36 | 32.69 | 30.77 |
| Peel carrot | 93.14 | 85.44 | 98.10 | 94.37 | 1.64 | 37.70 | |
| Write | 88.41 | 81.25 | 92.36 | 91.78 | 10.00 | 15.56 | |
| Iterations | 10 | 10 | 60 | 60 | 6 | 6 | |
| No. of features | 46 | 40 | 48 | 45 | 45 | 42 | |
| Overall accuracy | 92.78 | 83.65 | 95.06 | 90.72 | 57.12 | 45.89 | |
| SD | 0.37 | 0.66 | 5.62 | 7.72 | 12.69 | 12.39 | |
To evaluate the contribution of the different features of each sensor, we looked at the attributes used for the classification of the wrist module subsets after the feature selection using the ReliefF algorithm and the empirically set threshold. On average, the number of used features was reduced from 131 to 44.33 (66.15%).
In all of the cases, none of the gyroscope features were retained by the ReliefF algorithm, not even in the data subset where the altitude information was discarded and only accelerometer and gyroscope data were available. Taking a closer look at the assigned weights, we were able to identify the features with better discriminative ability for this case. For the complete wrist data subset, the top-ranked features (i.e. the features that occupied the first 10–15 places) were the correlation coefficients between the acc{x, y, z}active signals, as well as different dispersion measurements (e.g. RMS, SD, percentiles {3, 10, 20, 97}, and P2P) of the acc{x, y, z}posture and altitude signals. For the altitude-discarded wrist subset, the top-ranked attributes were practically the same, except of course for the altitude features.
4. Discussion
Classification results for the different module subsets under the repeated holdout protocol clearly show that the wrist modules outperform other possible combinations: they provide higher and more consistent accuracies. This is especially evident when considering the complete activity set, showing an improvement of almost 10 percentage points over the second best module subset. It is important to note that grouping modules from different locations (e.g. All modules subset) can actually decrease the classification performance by diminishing the discriminative power of the features: the same features for one activity might have quite different values depending on the module site. For example, for the activity peel carrot, the SD of the acc{x, y, z}active signals of the wrist modules is very different from the SD of the same signals of the ankle modules.
Given their better performance, wrist data subsets were chosen to be analyzed in more detail. Classification was performed with the user-specific and the leave-one-subject-out protocols in addition to the repeated holdout. In the case where all sensor information was used, including the altitude data, satisfactory results were achieved with an overall accuracy of almost 93% and above 95% for the repeated holdout and the user-specific protocols, respectively. Looking at the accuracy for each activity, it can be seen that the activities that had the worst classification rate were lie down, don/doff jacket/shoe, sit, and butter bread with an accuracy between 80–85% for the repeated holdout protocol and between 83–86% for the user-specific protocol (except for butter bread and sit, which improved up to almost 95%). We believe that this is because these activities show greater intersubject variability and because they were performed by the subjects over a short period of time (e.g. in the case of lie down, the subjects only remained on their back for around 8–10 s) or for only a few repetitions (don/doff jacket/shoe was only performed twice per subject). This results in a reduced number of windows of the respective activity and thus small training and testing data sets. The classifier therefore has only little data from which to learn and even fewer data to test. Furthermore, a relatively small number of misclassifications can generate big drops in the accuracy rate.
Nevertheless, some of the activities achieved a classification accuracy of or very close to 100%: walk, cut food, BBT, and run. Specifically stair climbing, both for ascent and descent, achieved an accuracy of almost 93 and 97%, respectively, which is far superior to those previously reported in literature (table 1). We attribute this improvement to the altitude data, since this is the main difference between ReSense and other activity monitors/classifiers or devices used in previous works. This is further confirmed by the drop in accuracy rate of 9.5 to over 20 percentage points for these two particular activities under the repeated holdout and from 5 to over 10 percentage points under the user-specific protocols if the altitude data is discarded. Through visual inspection, differences can be seen in the accelerometer data between stair ascent, stair descent and walk (figure 5). However, these can partially be explained by slightly increased walking speeds during stair descent and level walking, and might therefore vary significantly from one subject to another, in contrast to the altitude profile, which shows activity specific patterns across subjects. Furthermore, these activities are not the only ones that suffer from an accuracy rate drop when the altitude data is not considered. Discarding altitude information results in a drop of classification performance for all activities in both protocols (except for brush teeth in the user-specific protocol). This is also reflected in the overall accuracy, with a performance improvement of 4–9 percentage points in the repeated holdout and user-specific protocols when all the sensor information is used.
Besides having a significant positive impact on the classification accuracy, the BPS has some other qualities that make it a suitable component for wearable sensor modules. Its power consumption is comparatively low, making up approximately 15% of the system's total power consumption (4.6 mW) if only the accelerometer is used and to only 2.5% of the system's total power consumption (28.9 mW) if the gyroscopes are used as well. Furthermore, it does not considerably increase the size or cost of the complete module. With a footprint of (5 × 5 mm2) and a cost of approximately $5 USD, the BPS is comparable to an accelerometer or a gyroscope.
For the leave-one-subject-out validation method, the results were greatly decreased as a result of the lack of user-specific data in the training set. For example, the overall accuracy dropped to a poor 46% in the worst case, where no altitude information is considered. However, it is still evident that the altitude data improves classification for 9 of the 16 ADL. For the specific case of stair ascent and descent, including the altitude information increases the accuracy by 61 and 66%, respectively. Including the altitude data not only boosts the classification accuracy of these activities, but also enhances the overall accuracy rate by more than 11 percentage points.
Investigating the differential contribution of the different sensors to the discrimination of activities, it is important to note that, ideally, in order to achieve the best performance possible, the feature subset must be chosen according to the activities to be classified. However, making this decision a priori might not always be possible (e.g. in a real-life setting, in which the exact set of activities is unknown). We found that the most relevant features for classification of ADL using ReSense are mainly those that quantify the correlation between the acc{x, y, z}active signals and those that quantify the dispersion of the acc{x, y, z}posture signals and the altitude profile. Besides, it is important to note that none of the gyroscope features ranked high enough to be considered for the classification, i.e. all the gyroscope features were discarded.
Finally, we have to acknowledge some limitations of this study. First of all, the total number of subjects was small. The results and conclusions drawn from this data would have to be confirmed on a larger population. Also, the data collection was performed in a controlled laboratory-like environment. Even though the setting was conditioned to resemble an everyday environment and although the subjects were instructed to perform the tasks as naturally as possible, there is a possibility that their activity was influenced by the knowledge that they were participating in a study and by the fact that they were being observed by the experimenter and recorded on video at the same time. However, using a video camera to validate and match the performance provides an objective time reference and is exempt of a possible bias from the experimenter or from the subject when keeping an activity log.
5. Conclusions and future work
This paper investigated the optimal sensor selection and placement site for activity classification. We obtained high classification accuracies for all 16 ADL using data from only the two wrist modules under the repeated holdout and user-specific validation protocols, and demonstrated the usefulness of including a BPS in the sensor module.
Besides resulting in better performance, placing the sensor modules on the wrists provides several advantages over other locations. Compared to the chest, where module placement would require some type of support around the trunk, or to the ankles, where the subject would need to bend down to attach the modules, the wrists are an easy to access position for the subject and require minimal effort. Moreover, portable monitoring devices on the wrists are unobtrusive and might be perceived as an additional accessory to the subject's outfit (e.g. watch, bracelet), making them more socially acceptable and, in the end, more comfortable for the subject to wear. All these facts would maximize subject compliance. This can thus provide more detailed and reliable information about the behavior of users in the home environment for unsupervised long-term monitoring. Additionally, this setting allows to distinguish between three important groups of general activities: whole body movements, gross, and dextrous upper limb activities. Furthermore, placing the sensor modules on the wrists is advantageous in terms of investigating specific conditions in a number of diseases. For example, this configuration allows a robust monitoring of activity and at the same time provides a direct way to assess and quantify laterality and to compare the movement quality of the impaired and non-impaired upper limb in stroke patients. It could also prove advantageous to monitor arm tremor in Parkinson's patients. Nevertheless, modules on the chest and ankles could still be helpful for other types of applications. For example, the chest module could help to assess the subject's balance or the trunk's posture while performing different activities; the ankle sensors would certainly provide useful information for a detailed gait analysis.
The classification results are very satisfactory and encouraging, with good competitive overall classification accuracies and significantly better rates for stair ascent and descent in the repeated holdout and user-specific validation methods when altitude data was included. This demonstrates that the BPS integrated in the ReSense modules provides crucial information for the classification of practically all the ADL included in this study. It is worth emphasizing that this study embraced a rather large number of ADL (a total of 16), including whole body movements (e.g. walking, running, stair ascent and descent) and both gross (e.g. BBT, donning/doffing a jacket, drinking) and dextrous (e.g. cutting food, peeling a carrot, writing) upper-limb activities.
We found that the data from the accelerometers and from the integrated BPS were the most valuable for the classification of ADL under different settings. The fact that none of the three gyroscopes provided useful information allows a drastic extension of the battery runtime of our ReSense modules to more than 24 days by simply putting them into sleep mode and using an intelligent online detection of active/inactive periods. This could be very valuable for the long-term monitoring mode of our module for healthy subjects as well as for different patient groups in the future. However, this does not mean that the gyroscopes are not useful. For example, prior works have used them to identify stand-sit-stand transitions (Najafi et al 2002). We would like to explore using sensor fusion techniques on data from both inertial sensors (i.e. accelerometers and gyroscopes) in combination with additional information from a 3D magnetometer to help determine the precise position and orientation of the wrist and reconstruct the movement trajectory of the upper limb in order to quantify and assess a patient's performance during motor tasks.
The results of the present study encourage further improvements and additional experiments. For example, we are interested in exploring the performance of the system using only data from one wrist module (particularly, from the dominant hand) to determine if two modules are necessary to classify these activities, or if the measurements could be performed with only one module without a significant drop in performance. For future activity classification studies, we could begin with a reduced, predefined set of features, which we now know to perform better. This may reduce computational power and time needed for this type of analysis, making it more suitable for a possible online use. We are also interested in finding a way to deal with the transition events, since these are inherent to human activities. Solving this could allow ReSense to be used for everyday conditions—in contrast to the controlled ones presented here—without a significant drop in the classification accuracy. These improvements would lead to an enhanced robustness of the activity recognition. Finally, future work will focus on applying a methodology similar to the one presented here in stroke patients, in order to track recovery and monitor the transfer of clinical therapy to ADL in the home environment.
Acknowledgments
This work was supported by the National Center of Competence in Research in Neural Plasticity and Repair (NCCR Neuro) of the Swiss National Science Foundation, as well as by a private foundation. The authors wish to thank Kathrin Campen for her support at the Zurich Center for Ambulatory Rehabilitation (ZAR) and all the subjects who volunteered for the study. The authors are members of the Neuroscience Center Zurich (ZNZ) and the Rehabilitation Initiative and Technology Platform Zurich (RITZ).