

Abstract
Although motion analysis is frequently employed in upper limb motor assessment (e.g. visually-guided reaching), they are resource-intensive and limited to laboratory settings. This study evaluated the reliability and accuracy of a new markerless motion capture device, the Leap Motion controller, to measure finger position. Testing conditions that influence reliability and agreement between the Leap and a research-grade motion capture system were examined. Nine healthy young adults pointed to 15 targets on a computer screen under two conditions: (1) touching the target (touch) and (2) 4 cm away from the target (no-touch). Leap data was compared to an Optotrak marker attached to the index finger. Across all trials, root mean square (RMS) error of the Leap system was 17.30 ± 9.56 mm (mean ± SD), sampled at 65.47 ± 21.53 Hz. The % viable trials and mean sampling rate were significantly lower in the touch condition (44% versus 64%, p < 0.001; 52.02 ± 2.93 versus 73.98 ± 4.48 Hz, p = 0.003). While linear correlations were high (horizontal: r2 = 0.995, vertical r2 = 0.945), the limits of agreement were large (horizontal: −22.02 to +26.80 mm, vertical: −29.41 to +30.14 mm). While not as precise as more sophisticated optical motion capture systems, the Leap Motion controller is sufficiently reliable for measuring motor performance in pointing tasks that do not require high positional accuracy (e.g. reaction time, Fitt's, trails, bimanual coordination).
Export citation and abstract BibTeX RIS
1. Introduction
Assessment of upper limb impairment and function is critical for diagnosis, treatment and rehabilitation of musculoskeletal and neural disorders affecting the hand and digits. Hand and digit function are commonly impaired following stroke and are among the least likely to fully recover with conventional rehabilitation (Schieber et al 2009). Assessment of upper limb function using clinical instruments, such as the Nine Hole Peg Test (Oxford Grice et al 2003) and Chedoke–McMaster Stroke Assessment (CMSA) scale (Gowland et al 1993) is fundamental to developing rehabilitation goals, monitoring recovery and adapting treatment based on progress. While such assessments are widely used, they may not sufficiently measure small, but clinically significant, changes which may better infer the state of recovery (Gladstone et al 2002). Further, these assessments require valuable time by trained therapists and are typically limited to episodic intervals. As a result, there may be suboptimal feedback to clinicians and patients in the rehabilitation process, leading to hindered or limited recovery.
In contrast, commercial motion tracking systems (e.g. Vicon, Optotrak) are capable of collecting quantitative three-dimensional (3D) kinematics across a wide range of tasks (e.g. pointing, reaching, grasping). These systems allow generation of in-depth kinematic measures, such as limb positions and velocities accurate to sub-millimeter level (Windolf et al 2008), to assess functional capabilities. For example, kinematics of reaching and pointing tasks have been used to assess upper limb impairment and recovery following stroke (Levin 1996, Kamper et al 2002, Coderre et al 2010, Kitago et al 2013). Although optical motion analysis systems (e.g. Optitrak, Optotrak, Vicon) are frequently employed in research, they are expensive (ranging from $7 500 to $415 000 USD in recent comparisons (Carse et al 2013, Thewlis et al 2013)), require training, setup time for affixing markers and calibration, are sensitive to lighting conditions, need a line of sight, and are typically only used in dedicated laboratory settings. These limitations present major barriers to the wide clinical use of data from these motion capture systems (Rosenhahn et al 2008) and to the emerging development of at-home rehabilitation technologies (Pastor et al 2012, Borghese et al 2013, Slijper et al 2014).
Advances in sensor technologies have increased accessibility and portability of upper limb kinematics assessments. Inertial measurement units (IMUs), incorporating combinations of accelerometer, gyroscope and magnetometer sensors, have gained increasing use to measure physical activity, gait and posture, and gross limb movements (Gebruers et al 2010). While the use of IMUs is validated for measuring the duration and intensity of upper limb movements, their use in capturing the quality of upper limb movements, such as kinematics, smoothness, and movement type (e.g. voluntary versus unintentional), remains limited (Lemmens et al 2014). Furthermore, IMU techniques are susceptible to artifacts due to nearby metal objects (Brodie et al 2008). While instrumented gloves (Simone and Kamper 2005, Kortier et al 2012) for the capture of hand and digit kinematics exist, their use is limited by difficulties in donning and removing the gloves, especially in patients with functional impairments. A number of robotic systems, such as the KinARM (Scott 1999), HapticMaster (Lemmens et al 2014) and BONES (Milot et al 2014) systems, have also been developed to facilitate delivery of rehabilitation training. While these systems are capable of high-accuracy position measurements, their utility is limited by relatively high costs and long setup time.
Low-cost markerless optical systems have been examined as potential upper limb assessment tools. The Kinect sensor (Microsoft Inc., Redmond, WA), which projects and detects changes in structured infrared light patterns (i.e. dot pattern) to track the movement of body segments in 3D, represents a potential alternative to measure gross body movement in a clinical setting (Kurillo et al 2013, Mobini et al 2014). However, the spatial resolution of the Kinect limits the accuracy of measuring movements of small segments (Khoshelham and Elberink 2012), such as fingers. To improve accuracy of estimating pointing position, new techniques using proximal joint (i.e. wrist, elbow) angles to calculate pointing vectors are under development (Fürntratt and Neuschmied 2014).
According to company reports, the Leap Motion controller uses two monochromatic stereo cameras and three infrared (wavelength = 850 nm) LEDs to reconstruct the scene in 3D and track hand and finger position (Colgan 2014). The system's low cost (retail $80 USD) and minimal set-up time, coupled with initial reports of high accuracy, indicates its potential for assessment of finger movement in 3D space. Independent evaluations using an industrial robot with a pen-like tip reported mean squared error between the tip position and position measured by the Leap system was <0.2 mm in static trials and <2.5 mm in dynamic trials (Weichert et al 2013). In an evaluation using a plastic arm model, Guna et al found the Leap system accurate to <0.5 mm in static conditions (Guna et al 2014), further indicating initial promise for clinical assessment. Furthermore, a recent comparison reported a considerably lower end-to-end latency of the Leap (85 ms) compared to the Kinect (170 ms) (Brown et al 2014). Considering the variability in human performance compared to robotic arms is well-documented (e.g. van der Smagt et al 2009), an important next step prior to clinical use is to evaluate the system's validity and reliability with human participants.
The purpose of this study was to evaluate the Leap system to measure finger position for clinically relevant neuromotor assessments, such as reaching and pointing, in human participants. Specifically, the objectives of this study were to: (1) examine testing conditions that influence the system's reliability to measure finger position, particularly the effect of touching external objects (e.g. targets on computer screen), and finger location relative to the sensor's field of view (FOV) and (2) evaluate the concurrent validity and limits of agreement between the Leap and a validated research-grade optical motion capture systems. It was hypothesized that reliability of the Leap system to measure finger position, indicated by % of viable trials and mean sampling rate, would be compromised when touching visual stimuli presented on a computer screen compared to a condition where the finger was not touching the screen. We also hypothesized that reliability will be high for targets located in the reported 150 degree FOV and reduced at the margins. With regards to validity and limits of agreement, it was hypothesized that correlation between the Leap and Optotrak systems, measured by r2, and accuracy, measured by root mean square (RMS) error, would be sufficient for reach and point tasks typically used in neuromotor assessments based on previously reported upper limb assessments following stroke (e.g. Levin 1996, Kamper et al 2002, Coderre et al 2010).
2. Methods
2.1. Participants
Nine healthy right hand dominant younger adults between 18 and 30 years of age (6 females; 3 males) participated in this study. Participants did not report any musculoskeletal or neurological disorders and provided informed consent. This study was approved by the Office of Research Ethics at the University of Waterloo.
2.2. Apparatus
A desktop computer was used to display a visual stimulus chosen randomly from 15 square targets via E-prime (v 1.2, Psychology Software Tools, Inc., Sharpsberg, PA, USA). Figure 1 depicts the target locations and dimensions of the experimental setup. An infrared emitting diode (Ired) was placed on the distal phalange of the index finger and an Optotrak 3020 (Northern Digital Inc., Waterloo, ON, Canada) motion capture system was used to record the location of the finger. A Leap Motion controller system (version 1.2.0, Leap Motion Inc., San Francisco, CA, US), connected to a laptop computer (Lenovo G550, Lenovo Inc., Beijing, China) was used to measure the index finger location using a custom-built C# application to collect the Leap data stream. Briefly, three infrared LEDs on the controller emit a pattern of dots which are measured using two infrared (IR) cameras and synthesized into 3D positional data using a proprietary algorithm (Leap Motion Inc., San Francisco, CA, US). Based on recommended placement in the user guide, the Leap sensor was situated 7.5 cm in front of the display monitor and 26 cm from edge of the table (see figure 1), with axes aligned with the Optotrak coordinate frame.
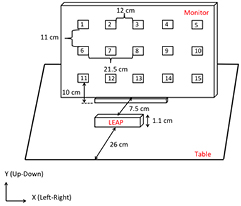
Figure 1. Schematic of the experimental design.
Download figure:
Standard image High-resolution image2.3. Procedure
From an initial starting position, participants were instructed to move their finger to one of 15 targets presented on the computer monitor (figure 1) and maintain this position. Participants were asked to perform two variations of this task: (1) touching the monitor (touch condition) and (2) holding their finger 4 cm away from the screen perpendicular to the monitor at the target location (no-touch condition). In the no-touch condition, a 4 cm diameter ball was used to control the distance between the finger and monitor and was removed prior to each trial. Once the participants' fingers were in the final position, 3 s of data were collected using the Optotrak (sampling rate: 120 Hz) and the Leap (sampling rate range: 50–120 Hz) systems. Data acquisition was synchronized by simultaneous pressing of mouse buttons by the researchers. While this procedure is not suitable for frame-by-frame comparisons, the reported static positions averaged over a 3 s trial duration is largely independent of the small variations in synchronization.
Participants performed three trials at each of 15 targets and two conditions for a total of 90 trials. Target location was randomized for each trial. The touch/no-touch conditions were tested in blocks, with order of presentation randomized across participants. After five participants were tested for both touch/no-touch conditions, it was apparent that the touch condition produced unreliable results (56% of trials with no data, see table 1). The remaining four participants were tested in the no-touch condition only.
Table 1. Descriptive statistics of RMS error, sampling rate, and viable trials by condition (Touch/No-Touch) and target number. Means (SD) are reported where available.
| Target | ||||||||||
|---|---|---|---|---|---|---|---|---|---|---|
| 1 | 2 | 3 | 4 | 5 | ||||||
| touch | No-touch | touch | No-touch | touch | No-touch | touch | No-touch | touch | No-touch | |
| RMS error [mm] | 79.5 (45.7) | 25.5 (4.1) | 23.2 (9.4) | 15.4 (3.1) | 11.1 (2.7) | 14.8 (2.8) | 15.3 (4.9) | 20.0 (7.2) | 58.8 (41.8) | 25.0 (9.7) |
| Sampling rate [Hz] | 68.1 (25.4) | 76.3 (20.1) | 52.0 (28.4) | 74.3 (13.8) | 54.8 (18.9) | 76.0 (14.3) | 55.1 (23.6) | 81.8 (15.7) | 35.8 (10.7) | 78.2 (15.1) |
| Viable data [% trials] | 4/15 (27%) | 27/27 (100%) | 11/15 (73%) | 26/27 (96%) | 11/15 (73%) | 27/27 (100%) | 13/15 (87%) | 27/27 (100%) | 8/15 (53%) | 24/27 (89%) |
| 6 | 7 | 8 |
9 | 10 | ||||||
|---|---|---|---|---|---|---|---|---|---|---|
| touch | No-touch | touch | No-touch | touch | No-touch | touch | No-touch | touch | No-touch | |
| RMS error [mm] | — | 24.1 (5.1) | 17.8 (15.1) | 12.1 (5.5) | 1.0 (0.3) | 4.1 (6.5) | 7.1 (2.7) | 7.3 (2.4) | — | 18.8 (10.3) |
| Sampling rate [Hz] | — | 64.2 (16.0) | 55.7 (16.8) | 71.2 (19.4) | 62.3 (13.0) | 63.2 (16.7) | 46.0 (13.2) | 64.2 (22.2) | — | 66.9 (20.7) |
| Viable data [% trials] | 0/15 (0%) | 25/27 (93%) | 14/15 (93%) | 26/27 (96%) | 15/15 (100%) | 24/27 (89%) | 12/15 (80%) | 21/27 (78%) | 0/15 (0%) | 21/27 (78%) |
| 11 | 12 | 13 | 14 | 15 | ||||||
|---|---|---|---|---|---|---|---|---|---|---|
| touch | No-touch | touch | No-touch | touch | No-touch | touch | No-touch | touch | No-touch | |
| RMS error [mm] | 249.6 | — | — | 27.4 (11.2) | 18.4 (8.5) | 18.7 (9.1) | — | — | 266.2 | — |
| Sampling rate [Hz] | 41.5 | 73.7 | — | 32.4 (18.2) | 48.0 (28.8) | 68.2 (20.8) | 61.9 | 30.7 | 17.2 | — |
| Viable data [% trials] | 1/15 (7%) | 1/27 (4%) | 0/15 (0%) | 11/27 (41%) | 8/15 (53%) | 12/27 (44%) | 1/15 (7%) | 1/27 (4%) | 1/15 (7%) | 0/27 (0%) |
2.4. Data processing
All data was processed using Matlab R13 (Mathworks Inc., Natick, MA, USA). Trials in which the Leap system collected 80 points or less were labeled as 'no data'. For trials with >80 points, mean sampling rate was calculated as the number of points collected over the 3 s trial duration. For anti-aliasing purposes, Leap and Optotrak data were digitally filtered using a dual low-pass Butterworth filter (third order), with a cut off of 10 Hz. To permit digital filtering, position data collected by the Leap system was resampled at a consistent 60 Hz using a piecewise cubic hermite interpolating polynomial (pchip Matlab function). To compare the Leap and Optotrak systems, the center target (target 8) was chosen as the reference origin due to the target's high reliability and consistent sampling rate (see table 1). The reference origin was calculated as the mean finger position for target 8 trials for each participant. All position data was referenced to the corresponding participants' calculated origin.
2.5. Analyses
To evaluate the influence of the touch condition on measurement reliability, the proportion of viable trials and mean sampling rates were compared to the no-touch condition. Reliability was measured by comparing the proportion (%) of viable trials (i.e. 80 or more data points) and mean sampling rate. Accuracy was measured by calculating the mean RMS error of the Leap position compared to the measured Optotrak position. Fisher's exact test was used to test the null hypothesis that touch and no-touch conditions produced the same proportion of viable trials. Similarly, task-dependent difference in mean sampling rate was compared using a paired t-test. To examine the influence of FOV, the proportion of viable trials from targets at the outside edges of the grid (targets 1, 5, 6, 10, 11 and 15) were compared to targets in the center (targets 3, 8 and 13). Fisher's exact test was used to test the null hypothesis that the outside and center targets produced the same proportion of viable trials.
Validity and limits of agreement between the Leap and Optotrak systems were examined using correlation and Bland–Altman analyses. Separate analyses were conducted for the horizontal and vertical axes. In the correlation analysis, a least-squares regression line was fitted (regress Matlab function). The coefficient of determination (r2) was used as a measure of linear fit. Used extensively to evaluate the limits of agreement between two techniques, Bland–Altman plots were constructed to examine systematic bias and estimate confidence intervals of measurement error. Plots were generated using the mean of the two methods as the abscissa (x-axis) and difference between Leap and Optotrack positions as the ordinate (y-axis) values. The mean errors and 95% confidence intervals for each plane were reported. Considering the negative impact of the touch condition on reliability, only the no-touch data were examined in the correlation and Bland–Altman analyses.
3. Results
Across all conditions and targets, the mean (±SD) RMS error of the Leap system was 17.30 (±9.56) mm, sampled at 65.47 (±21.53) Hz, with 244/450 (54.2%) viable trials. Table 1 reports descriptive statistics of means and standard deviations of RMS error, sampling rate and % viable trials by condition and target.
3.1. Touching versus no-touching
Touching the computer screen negatively impacted the proportion of trials with viable data (i.e. 80 or more data points) and mean sampling rate. As hypothesized, touching the computer monitor (touch) reduced the proportion of viable trials compared to the not touching (no-touch) condition (44% versus 64%, p < 0.001). Table 2 reports contingency tables of viable trials by condition. Mean (±SE) sampling rate was also lower in the Touch condition compared to the no-touch condition (52.02 ± 2.93 versus 73.98 ± 4.48 Hz, p = 0.003).
Table 2. Contingency tables of viable trials.
| Touching versus no-touching | |||
|---|---|---|---|
| Viable data | No data | % viable | |
| Touching | 99 | 126 | 44% |
| No-touching | 145 | 80 | 64% |
| Outside versus center targets | |||
|---|---|---|---|
| Viable data | No data | % viable | |
| Outside | 98 | 64 | 60% |
| Center | 63 | 18 | 78% |
aFisher's exact test, p < 0.001. bFisher's exact test, p = 0.009.
3.2. Outside versus center
Target location affected the ability to collect finger position data. The proportion of viable trials was greater in the center locations compared to the outside locations (78% versus 60%, p = 0.009). However, in comparing the center and outside targets, there was no difference in mean (±SE) sampling rates (65.06 ± 1.94 versus 68.21 ± 1.99 Hz, p = 0.263).
3.3. Correlation
Considering the influence of the touch condition on the reliability of the Leap system, only the no-touch condition results are reported in the concurrent validity (i.e. correlation) and limits of agreement (i.e. Bland–Altman) analyses. To evaluate the concurrent validity of the Leap and Optotrak systems, the linear correlation between measured finger positions was examined. Overall, our results show high correlation and coefficient of determination in both the horizontal (r = 0.953, r2 = 0.995, figure 2 left) and vertical (r = 0.991, r2 = 0.945, figure 2 right) directions.
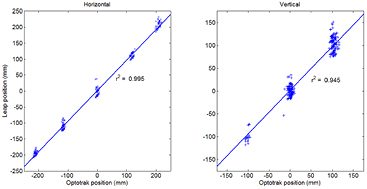
Figure 2. Correlation between Optotrak and Leap systems for horizontal (left panel) and vertical (right panel) finger position.
Download figure:
Standard image High-resolution image3.4. Bland–Altman
To examine the limits of agreement between the Leap and Optotrak systems, Bland–Altman plots were generated for the horizontal (figure 3, left) and vertical (figure 3, right) directions. Similar to the correlation analysis, only the no-touch condition data were used due to poorer reliability in the touch condition. For the horizontal axis, the mean difference between the two systems was +2.39 mm (figure 3, left, solid line), with lower and higher 95% limits of agreement between −22.02 and +26.80 mm (figure 3, left, dashed lines). In the vertical axis, the mean difference was +0.37 mm (figure 3, right, solid line), with limits of agreement between −29.41 and +30.14 mm (figure 3, right, dashed lines).

Figure 3. Bland–Altman plots for horizontal (left panel) and vertical (right panel) for the no-touching condition.
Download figure:
Standard image High-resolution image
4. Discussion
To improve care and facilitate recovery of the hand and its digits, such as paresis and digits following stroke, there is a need to develop new portable tools for rapid clinic- and home-based assessment. Towards this goal, the purpose of this study was to evaluate the utility of a new markerless kinematics capture device, the Leap Motion controller, to measure static finger position in a group of healthy younger adults. Comparison of the finger positions measured by the Leap system and a research-grade optoelectronic motion capture system demonstrate that the Leap system: (1) is less reliable when touching visual stimuli presented on a monitor, (2) is inconsistent near the ranges of the device's FOV, (3) provides valid measures of finger position indicated by high coefficients of determination (r2), and (4) has a relatively high mean RMS error and limits of agreement. While not as precise as more sophisticated systems, the overall reliability and accuracy of the Leap system is sufficient for pointing tasks that do not require high positional accuracy measures over a limited functional space and when the finger does not contact an object, such as a computer screen. However, the RMS error and limits of agreement suggest that the Leap system is not precise enough to measure impaired path deviations in motor-impaired populations.
As hypothesized, the reliability of the Leap system was significantly reduced when touching visual stimuli and approaching the periphery of the range of the FOV, indicated by a lowered proportion of viable trials and mean sampling rate. In the current study, touching targets resulted in a 20% reduction in viable trials and 21% decrease in mean sampling rate compared to the no-touch condition. This may be attributable to merging of the finger and screen by the Leap system, making differentiation of the two impossible. This limitation restricts the ability to employ assessment tasks that require tactile interaction with buttons (e.g. reaction time), screens (e.g. trail making test), or objects (e.g. blocks, tools). In the evaluation of reliability, outer targets demonstrated 18% fewer viable trials compared with targets along the center line, with no difference in sampling rate. This reduction may be attributed to occlusions or merging associated with the position and orientation of the hands and fingers relative to the sensor. At wider angles, the pointing finger was more likely to be obstructed from view by individual hand and finger orientations and anatomical dimensions.
The Leap system demonstrated a high degree of correlation and thus concurrent validity with a validated Optotrak system (r2 = 0.995 and 0.945 in horizontal and vertical axes, respectively). However, the mean RMS error (17.30 mm) in the current study is considerably higher compared to previous evaluations of the Leap accuracy. Weichert et al study (2013) reported position error was less than 0.17 mm, and Guna et al (2014) found a maximum standard deviation of 0.49 mm across a similar space. The large differences in error are likely attributable to variability in human data in the current study compared to robotic actuators (van der Smagt et al 2009). While the previous evaluations document the baseline capabilities of the technology under ideal conditions, the current study better reflects conditions for clinical use.
The limits of agreement and mean RMS error are relatively large compared to clinically-relevant measures of path deviation and active range of motion in visually-guided reaching tasks. In stroke studies, Levin reported a mean difference of 12.5 mm in end-point accuracy comparing impaired (i.e. affected) and unimpaired arms in a rapid pointing task (Levin 1996). Schaefer et al found less than 15 mm differences in constant error between healthy controls and stroke survivors (Schaefer et al 2007, 2009). Considering the limits of agreement and RMS error found in the current study are greater than these reported effect sizes, we do not recommend using the Leap system to measure positional accuracy in rapid pointing tasks.
Despite its shortcomings in positional accuracy and precision, the Leap may be suitable for a subset of motor assessment tasks, such as trail-making or bimanual coordination, with appropriate design modifications. Adapting tasks to use non-contact targets or cues, such as auditory or virtual feedback, are appropriate modifications to address contacting object limitations of the Leap system. An adapted trail-making task (Reitan 1958), for example, could simultaneously display finger position and targets on a screen to assess motor planning capabilities. Auditory cues, such as a metronome, may be used to cue bimanual motor coordination tasks such as circle-drawing (Bangert et al 2010). Considering the poorer accuracy of the Leap at the limits of the evaluation space, we recommend designing tasks in the center of the functional volume. In particular, we recommend maintaining a height of approximately 20 cm above the sensor in light of the poor reliability results at lower heights. With regards to sensitivity in the depth dimension, the current study is limited to examining Leap sensitivity across varying positions in the vertical and horizontal planes. Sensitivity to sensor placement in the depth dimension remains to be examined.
Given the Leap Motion costs significantly less relative to laboratory motion tracking devices, the findings in this study are promising despite the reduced accuracy. As a portable tool, the sensor can be used to collect data in a patient's home, integrated as a feedback system and as a clinical rehabilitation tool. The present findings were executed on the first commercially-available version of the Leap Motion sensor (version 1.2.0). Since the company is working towards improving the tracking capabilities of the device, the results presented in this study may differ from the findings in future studies, which use later, more refined device versions. Furthermore, research is needed to examine dynamic response characteristics to evaluate the Leap's ability to measure additional kinematic variables (i.e. velocities and acceleration).
5. Conclusion
The LEAP sensor successfully measured relative two-dimensional coordinates of the index finger with the highest correlations achieved in the left–right and up–down axes in the no-touch condition, using the Optotrak system as a gold standard. Overall, the Leap system's accuracy for finger location was 17.3 ± 9.56SD mm compared to criterion standard optical motion capture system (Optotrak). However, some caution is warranted considering the relatively large limits of agreement (horizontal: −22.0 to 26.8 mm, vertical: −29.4 to 30.1 mm) and limitations with contacting objects. Hence, Leap Motion should provide a portable 3D motion capture system for performing basic clinical assessments in tasks such as trail-making, Fitts, or simple/choice reaction time. One of the major advantages of Leap sensor is its ability to generate continuous data as the hands are moved in space. Thus, it is capable of collecting a greater quantity and quality of information relative to the conventional physiotherapy tools.
Acknowledgments
We acknowledge the assistance of Leah van Draanen with collection of data for this study. The authors declare no conflicts of interest in association with this study. Partial funding for this work was provided through grants to Dr Eric Roy from an ESERC Research Incentive Fund and from the Heart and Stroke Foundation of Ontario.