

Abstract
Objective: Metal exposures have been linked with many adverse health outcomes affecting nearly every system in the body. Exposure to metals has been tracked primarily using blood. Blood metal concentrations have drawbacks as biomarkers stemming from the metals' short biologic half-lives, shipping and storage requirements, and invasive collection procedures. Toenails, which capture a longer exposure period, can be collected non-invasively and stored at room temperature, and can be more feasible and cost-effective for large-scale population studies. Approach: Inductively coupled plasma mass spectrometry (ICP-MS) has been used for analysis of toenail metal concentrations, but x-ray fluorescence (XRF) has many advantages in versatility and cost effectiveness over these analyses. This study compared toenail concentrations of manganese (Mn) and lead (Pb) measured with XRF against ICP-MS, in samples collected from 20 adults in Nigeria. To do this we developed a novel calibration method that corrects XRF measurements for toenail weight and thickness to reduce the variability in XRF measurements of toenail clippings. Main results: We found a high correlation (R = 0.91) between toenail manganese metal measurements made with XRF and ICP-MS and a correlation of (R = 0.32) between toenail lead XRF and ICP-MS with over half of the lead results below the detection limit of the instrumentation. Significance: XRF can be used effectively to quantify metals at the part per million level or lower depending on the XRF equipment used in the measurements.
Export citation and abstract BibTeX RIS
1. Introduction
Environmental exposure to metals has been shown to adversely affect neurologic health, cardiovascular health, and almost every system in the body (Navas-Acien et al 2007, Weisskopf et al 2007, Navas-Acien et al 2008, Weuve et al 2013). Blood is the most common biosample used as a marker for exposure to metals, but its short half-life and invasive collection procedures can make it difficult for use in large population studies. Toenail metal concentrations have been used to show relations between metal exposures and health (Laohaudomchok et al 2011, Mordukhovich et al 2012, Grashow et al 2014, Reis et al 2015), and toenail concentrations as a biomarker can have several advantages over blood concentration measurements. Toenail collection is simpler and less invasive than blood collection. Storage and shipment of toenails does not require special freezers or procedures. The accumulation of metals in toenail typically reflects 6 months to one year of exposure with a lag of between 7 to 12 months between initial exposure and that exposure reflecting the metal levels in toenail clippings (Laohaudomchok et al 2011). The biologic half-life of most metals in blood is typically one or two months (Rabinowitz 1991, Rabinowitz 1998, Higgins 2015). The longer accumulation rate of toenails and the possibility of collecting multiple samples over time can make them a better biomarker for evaluating long-term exposures. Combined with the ease of collection, shipping, and storage they could be an ideal choice for many epidemiologic studies of metal exposures.
Currently the typical approach for analyzing metals in toenail is inductively coupled plasma mass spectrometry (ICP-MS), which can measure concentrations in the parts per billion to parts per trillion range. However, many metals accumulate in toenails on the order of about one part per million (ug g−1), which raises the possibility that alternative analysis approaches could be less expensive and aid in scaling up to measurements of large population studies. X-ray fluorescence (XRF) can be used as a non-destructive method for elemental analysis with very little analysis cost and system maintenance. The detection limit of the portable XRF device we have used in previous studies is on the order of typical metal concentrations in toenails (Specht et al 2017a, Specht et al 2017b). XRF has been used previously for toenail measurements using different calibration procedures than those discussed here with good accuracy in comparison to other methods (Gherase and Fleming 2011, Fleming et al 2013, Fleming et al 2017, Fleming and Ware 2017). Thus, we evaluated the feasibility of using this portable XRF device, and more broadly XRF in general, to measure toenail clippings.
A key problem to overcome in using XRF on clipped toenails is defining a normalization to account for the variability in the amount of clippings between individuals and the thickness of each individual's clippings. We hypothesized that the silver characteristic x-rays from the anode in the x-ray tube measured after Compton scattering from the sample could be used as an overall determination of the amount of material being sampled and could approximate the thickness and size of the nail clippings. In this study, we discuss calibration procedures to correct for thickness and clippings size to get an accurate determination of toenail metal concentrations using the portable XRF, which can likely be used with other XRF devices as well. We then validate this technique against toenails collected in Bodo, a community in the Niger Delta region of Nigeria, which were measured with the XRF and with ICP-MS.
2. Materials and methods
2.1. Toenail clippings
As part of our validation of the device we collected toenails anonymously from fishermen in Bodo, which has seen a variety of environmental pollutant events including crude oil spills (Nkpaa et al 2016). In addition, based on high levels of some metals found in fish in this region, we suspected human metal exposures would be high (Nkpaa et al 2016).
Toenail clippings from all 10 toes were collected from 20 fishermen in the community. The toenail clippings weighed on average (±standard deviation) 98.9 ± 17.7 mg. Because of concern about potential external contamination of toenails in this area, we used a more intensive cleaning process prior to measurements. First, the samples were cleaned using a 1% triton solution of deionized (DI) water and sonicated for 30 min, vortexed, and the solution removed. Then, a new 1% triton and DI water solution was added that the samples soaked in for two days. They were subsequently again sonicated for 30 min, vortexed, and the solution removed. The clippings were then rinsed with DI water and vortexed an additional three times. Acetone was then added to the clippings and they were again sonicated for 30 min, vortexed, and the acetone removed. Finally, they were rinsed three times with DI water, vortexed once more, and freeze-dried overnight. This cleaning method has been used on many studies of nail analyses in the past and has been shown to be effective at removing external contamination in cases of highly exposed occupational workers (Mordukhovich et al 2012, Grashow et al 2014, Bainter 2014).
2.2. Portable XRF device
We used a Thermo Fisher XL3t GOLDD + portable XRF to measure concentrations of manganese (Mn) and lead (Pb) in the toenail clippings (Thermo Fisher Inc., Billerica, MA). This same x-ray system has been used in previous studies measuring bone in vivo for strontium and lead (Specht et al 2016, 2017b). The system uses a silver x-ray tube target. We used a voltage of 50 kV and amperage of 40 uA with a filter of silver and iron. The measurements were taken for 3 min of real time each with the toenail clippings centered over the x-ray tube area, while the portable XRF was in its test stand.
2.3. Standard phantoms
Standard phantoms for toenails were made using epoxy resin with added salt to standardize the attenuation coefficients, similar to prior work (Roy et al 2010). Phantoms were made for calibration and measurement of each of the metals (separate sets for Mn and Pb). These phantoms were made with doped levels of 0, 5, 10, 15, 30, and 50 ppm of each metal. In total, three sets of phantoms for each metal were used in this study for validation of methods, which included duplicate concentrations to ensure validity.
First, slab phantoms were made for each metal to represent an ideal case of measurement of whole samples at a standard thickness of around 1 mm. Second, phantoms of varying thicknesses with doped levels of Mn and Pb were made to identify how toenail thickness would affect the x-ray signal for the metals with higher energy (Pb at 12.6 keV) and lower energy (Mn at 5.9 keV). These energies in theory should reflect the accuracy of the calibration over a range of characteristic energy differences. Although this is an approximation and some metals such as strontium (14.1 keV) will actually have energies higher, we believe this is a reasonable check on the effectiveness of the calibration method. The thicknesses of these phantoms were measured using a micrometer and found to be between 0.6 and 1.8 mm, which is consistent with studies of human toenail thicknesses (Johnson and Shuster 1994). To test the thickness, we made nine Pb phantoms and eight Mn phantoms of varying thickness and equal concentration.
One final set of phantoms was created at low (~0.6 mm), medium (~1.0 mm), and high (~1.5 mm) thicknesses and concentrations of 0, 30, and 50 ppm of Mn and Pb, and clipped into segments to resemble actual nail clippings. This would better reflect the geometry for actual clipped human nail. These phantoms were used to test the measurement changes associated with clipped phantoms versus slab phantoms, including variations in sample weight, which we wanted to address with our calibration method.
2.4. Spectra analysis
The spectra were analyzed using Matlab and traditional elemental fitting using a Gaussian function for the Mn and Pb elemental peaks. An exponential background was included depending on the element being fit and the spectral features in that area (Zhang et al 2017). For example, the Mn peak includes fitting for the Fe peak. Since the Fe peak is so large, it is a primary component of the background under the Mn alpha peak, and, thus, was used in the fitting to better distinguish the background counts. The alpha peak was used primarily for quantification with Mn (5.9 keV), but for the Pb analysis the alpha (10.6 keV) and beta (12.6 keV) peaks were used to identify the final concentration. The width of the Gaussian function was fixed to a value indicative of the resolution of the detector in the XRF device at the particular energy of the characteristic energy for that metal. The same fitting technique was used in three previous studies using this XRF (Specht et al 2016, 2017a, Zhang et al 2017).
2.5. Inductively coupled plasma mass spectrometry (ICP-MS) measurements
ICP-MS measurements were performed after the final cleaning and XRF measurements were completed on the nail clippings. The clippings were digested in 3 ml of nitric acid and 1 ml of hydrogen peroxide at room temperature for 48 h. Then the samples were diluted with 6 ml of DI water prior to analysis. The analysis was done using the internal standards Sc, Y, and Tb. For further quality control and assessment, we used ERM-DB001 (human hair certified reference material), several concentrations of the calibration standard for continuing calibration verification (CCV), digestion and analytical duplicate analyses, and NIST1643f reference standard for trace elements in water.
2.6. Statistical methods
Linear regression models were used to determine the relationship between XRF and ICP-MS measurements, with ICP-MS values as the independent variable. We included negative XRF measurement values in these analyses because these are point estimates of the concentration that can be influenced by measurement error. Redefining such measurements could artificially change correlations because of reduced variance. We did a sensitivity analysis including uncertainty in the correlation models, but this did not change our correlation values or beta estimates. The minimum detection limits (MDL) are calculated based on the formula

where  is the standard deviation of the signal (square root of counts at 0 ppm) and
  is the slope of the regression between counts and ppm taken from a standard curve (Gherase and Fleming 2011, Fleming et al 2017).
3. Results
3.1. Calibration
The results from the first set of Mn phantoms with standard thickness of about 1 mm are shown in figure 1 (beta = 0.37 95% CI (0.36, 0.38), intercept = 0.19 95% CI (−0.04, 0.42)).
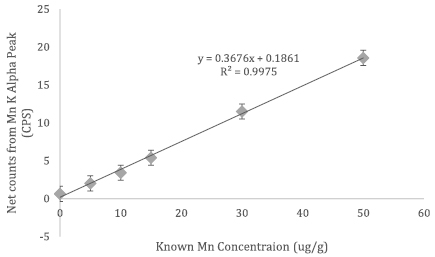
Figure 1. Mn calibration line from doped phantoms of thickness 1 mm.
Download figure:
Standard image High-resolution imageWe measured our toenail phantoms created at different thicknesses and looked for changes in XRF signal. We found that greater thickness of the phantom was associated with higher Mn and Pb signal from the XRF reading (figures 2 and 3).

Figure 2. 50 ppm Mn signal by plotted against phantom thickness.
Download figure:
Standard image High-resolution image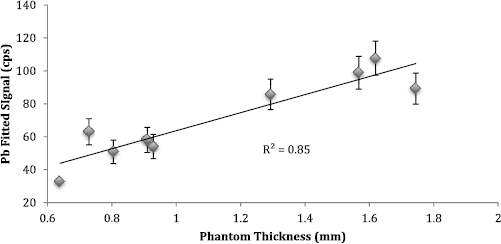
Figure 3. 50 ppm Pb signal by plotted against phantom thickness.
Download figure:
Standard image High-resolution imageWe examined the relationship between measured nail thickness and total silver fluorescence undergoing Compton scattering, and higher nail thickness led to higher silver Compton scattering counts (figure 4). The correlation between phantom clipping weight and the Compton scattering peak counts derived from the third set of phantoms indicates that the Compton scattering in the sample increases with increasing weight (figure 5) in addition to increasing thickness of the sample being measured. There was a statistically significant saturation level in the relationship between Compton scattering counts and weight as shown by a likelihood ratio test between the models with linear and quadratic terms for weight (p-value = 0.002).

Figure 4. Relationship between silver characteristic x-ray Compton scattering and phantom thickness.
Download figure:
Standard image High-resolution image
Figure 5. Relationship between silver characteristic x-ray Compton scattering and phantom clipping total weight.
Download figure:
Standard image High-resolution imageBased on the relation between Compton scattering and both thickness and weight, we corrected metal counts for toenail size and thickness by dividing the net signal for each metal by the silver characteristic Compton scattering counts. The calibration line for Mn before and after using this normalization approach are presented in figure 6. Using the Compton scattering peak normalization (beta = 0.84 95% CI (0.79, 0.89), intercept = −3.70 95% CI (−5.47, −1.92)), and using the raw signal counts (beta = 0.38 95% CI (0.33, 0.42), intercept = −0.81 95% CI (−2.17, 0.55)).
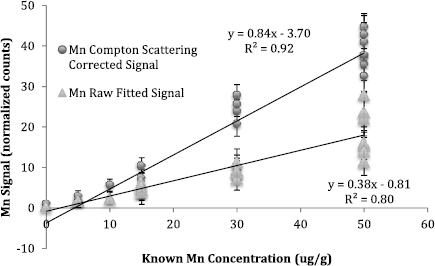
Figure 6. Mn calibration line with and without silver Compton scattering correction.
Download figure:
Standard image High-resolution imageThe validity of the normalization is distinctly shown by the lack of correlation between thickness and the Mn signal that was corrected based on the Compton scattering counts in our Mn doped phantom measurements (figure 7). The correlation and beta was non-significant for the Compton corrected Mn counts (beta = −0.04 95% CI (−0.15, 0.08) p-value = 0.765, rho = 0.07) while the beta value was significant for the raw Mn counts (beta = 0.16 95% CI (0.11, 0.22), p-value = 0.006, rho = 0.61). The chi-squared of the fittings shown in figures 6 and 7 ranged from 0.8 to 1.7 (1.2 ± 0.3).
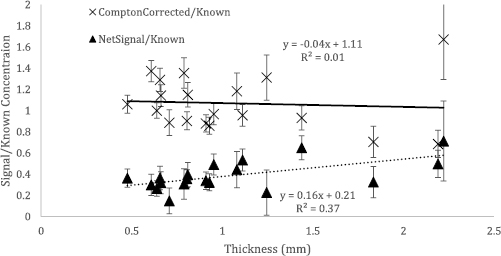
Figure 7. Relationship of normalized (Compton Corrected/Known) and non-normalized (Netsignal/Known) signal with thickness of toenail clipping in doped Mn phantoms.
Download figure:
Standard image High-resolution image3.2. Calibration for XRF metal measurements
In table 1, we present the correlations (rho) of the calibration lines for our toenail phantoms doped with different levels of each metal (0, 5, 10, 15, 30, 50 ppm), and with varying thicknesses (~0.6, 1.8 mm), using our normalization based on the silver Compton scattering peak counts. The slopes are much lower than one, since we divided our raw signal values by the Compton scattering peak counts, but remain significant (p-value < 0.001) for both Mn and Pb. Each calibration includes 10 phantoms, and one line is representative of all thicknesses.
Table 1. Calibration line results from toenail phantoms using XRF signal divided by the silver Compton scattering peak counts for normalization regressed against known concentration.
| Regressed against known added concentration | ||
|---|---|---|
| Metal signal normalized to compton scattering peak | Coefficient | P-value |
| Mn | ||
| Slope | 1.67 × 10⁻⁴ | <0.001 |
| Rho | 0.932 | |
| Min. detection limit (ug g−1) | 3.216 | |
| Pb | ||
| Slope | 1.82 × 10⁻⁴ | <0.001 |
| Rho | 0.994 | |
| Min. Detection Limit (ug g−1) | 0.581 | |
3.3. ICP-MS and XRF metal concentrations
The concentrations of the metals we measured in toenails using ICP-MS and XRF analysis are presented in table 2. The XRF concentrations are derived from the calibration lines in table 1.
Table 2. ICP-MS and Compton normalized XRF measured metal concentrations in Nigerian toenail clippings.
| ICP-MS Mn (µg g−1) | XRF Mn (µg g−1) | ICP-MS Pb (µg g−1) | XRF Pb (µg g−1) | |
|---|---|---|---|---|
| Mean | 8.04 | 10.62 | 0.98 | 1.55 |
| Standard deviation | 6.16 | 7.41 | 0.49 | 0.70 |
| Minimum | 2.72 | 2.80 | 0.20 | 0.45 |
| Maximum | 28.32 | 34.75 | 2.57 | 2.76 |
3.4. Correlation between ICP-MS and XRF metal concentrations
The correlations between ICP-MS and XRF measured Mn and Pb are shown in figures 8 and 9. These figures show the range of the concentrations measureable using the XRF technique. The correlation between the ICP-MS and XRF measured Mn gave an R of 0.91 (95% CI 0.84, 0.97) (beta = 1.10 95% CI (0.98, 1.21), intercept = 1.79 95% CI (0.63, 2.95)). ICP-MS and XRF comparisons for toenail Pb gave an R of 0.32 (95% CI −0.35, 0.57) (beta = 0.46 95% CI (0.14, 0.78), intercept = 1.09 95% CI (0.74, 1.44).
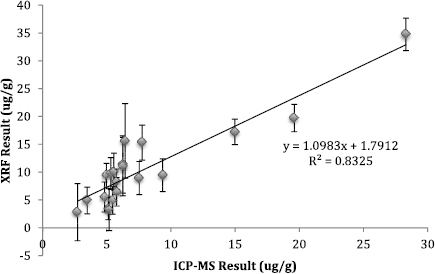
Figure 8. Correlation between ICP-MS and Compton normalized XRF measured Mn in Nigerian toenail clippings.
Download figure:
Standard image High-resolution image
Figure 9. Correlation between ICP-MS and Compton normalized XRF measured Pb in Nigerian toenail clippings.
Download figure:
Standard image High-resolution image
4. Discussion
Our results using a normalization based on the Compton scattering peak indicate that XRF can be used effectively to measure metal concentrations in toenail clippings. We found excellent correlation between XRF and ICP-MS for Mn in toenails, while the correlation for Pb was affected by overall lower concentrations in the toenails. For the results shown here, we found a detection limit of 3.2 ug g−1 for Mn and 0.6 ug g−1 for Pb, which would be similar for other metals within this energy range since their binding energies would be similarly optimized for the x-ray tube output from the portable XRF used in this study. The calibration method demonstrated in our study can easily be applied to different XRF devices with much greater detection capabilities.
A critical concern when using XRF to measure metals in toenail clippings is that the thickness and size of the clipping sample determine the signal of the sample and strongly influence the estimated quantification. Previously, studies have used the weight of nail clippings to derive calibration for XRF quantification. These studies showed calibration lines that were dependent upon the weight of the sample. This method requires extra steps in each individual analysis (Gherase and Fleming 2011, Fleming et al 2013). Calibrations based on weight have been proposed for use in XRF measurements of As, Se, Mn, Zn, and Cr (Fleming et al 2013, 2017, Fleming and Ware 2017). However, the toenail thickness will impact the signal and affect the minimum detection limit (MDL), as shown in previous calibration studies and confirmed in our results (Roy et al 2010).
The main limitation of the study was the power of the portable XRF. The maximum power output of 2 watts limited our detection capabilities to concentrations greater than 1 ug g−1 in general. The primary results of our study were to highlight the new calibration approach, which could be used with other devices, as well as the portable XRF used here. However, as shown with our Pb results, the power and measurement time of the device will restrict the detection capabilities. Increasing the measurement time could decrease our detection limits by the square root of the increase in time, but this is only feasible for small scale studies with higher toenail metal concentrations. Higher powered devices would have much lower detection limits for all metals than the portable XRF used in our study, which would also be expected to improve correlations between XRF and ICP-MS measurements.
The best evidence of the reliability of this method is in the measurement comparisons between ICP-MS and XRF for Mn. Almost all Mn concentrations were well above the detection limit of the portable XRF. We found strong correlations and a slope close to 1.0 (figure 8) between the toenail clipping concentrations obtained via XRF measurements and ICP-MS measurements for Mn, which indicates that our method for quantification worked well. A weaker non-significant correlation between XRF and ICP-MS was identified with Pb, since these concentrations were close to or below the detection limit of Pb for the portable XRF. The quantification is dependent upon the values being above the detection limit of the XRF. With a higher-powered XRF, other metals could be quantified with greater accuracy and these devices would likely be more valuable in a population study.
XRF systems are available to many labs with low initial instrumentation costs as well as ongoing costs. At the time of publication, the instrumentation used in this study cost around $50 000, and equipment with much lower detection limits would be available at most for $100 000. Typical ICP-MS systems will initially cost twice as much as this. In terms of on-going or maintenance costs, the XRF systems typically have almost none for the heavy metals discussed in this study. XRF usually will have very low maintenance costs and can last for years without significant issues. ICP-MS will have much more normal maintenance costs associated with upkeep of the system. There will likely be limited costs from sample cups and thin films, but those are very minimal in comparison to the cost of trace metal grade acids, ultra-high purity gases, and standards typical of ICP-MS. Along with the instrumentation costs, ICP-MS requires much more training in order to properly operate the system, whereas training and operation of XRF systems are generally easier with less chance of critical contamination of the system due to lack of familiarity with the analysis techniques.
5. Conclusions
Our results indicate that XRF can be used effectively to measure metal concentrations in toenail clippings with a detection limit on the order of 0.6 for Pb to 3.2 ug g−1 for Mn metals with elemental peaks spanning the energies between 5.9 and 12.6 keV. The utility of the portable XRF for toenail metal quantification increases with increasing concentration of metals. With more powerful XRF equipment, metals could be assayed with much lower detection limits. Like ICP-MS, the XRF approach can also be adapted to measure many metals simultaneously. The XRF approach is much more versatile than ICP-MS for non-destructive measurement of solid samples, and the use of this approach in the future could cut down significantly on costs and time for preparation and measurement of toenail clippings. These are potentially important advantages in large scale epidemiology studies.
Acknowledgments
This work was supported by the National Institute of Environmental Health Science (NIOSH) R21 grant R21ES024700, Rose Traveling Fellowship Program, and by Facility Access Funds (FAF) from the Harvard-NIEHS Center for Environmental Health P30ES000002. We thank Elsie Sunderland at Harvard University for making ICP-MS facilities available. The authors declare no competing financial interest.
Footnotes
- *
- †