
Abstract
The complex dielectric permittivity of single-domain BaTiO3 in the region of 30–700 cm−1 (0.90–21 THz) was directly measured using a far-infrared spectroscopic ellipsometer. The dielectric responses of the Slater, Last, Axe, and O4 torsional modes, which are all infrared-active phonon modes in BaTiO3 were clearly observed. The resonance frequencies of the phonon modes estimated in this study were in agreement with the previous data estimated by analysis of reflection spectra using a harmonic oscillator model. These results indicate that the far-infrared ellipsometric technique is effective for analyzing the phonon modes of BaTiO3 single crystals. Additionally, we examine the dielectric response and the damping of the soft mode with respect to the order–disorder model.
Export citation and abstract BibTeX RIS
1. Introduction
Barium titanate (BaTiO3) is the most widely used ferroelectrics and the most important dielectric material for multilayered ceramic capacitors (MLCCs). The excellent dielectric property of BaTiO3 has attracted much attention not only in the electroceramic industry but also in fundamental research.1–6) Even seventy years after its discovery, the fundamental understanding of the BaTiO3 system is demanded for controlling the dielectric property in device applications. For example, the precise interpretation of the grain size effect7–16) and the substitutional effect of cations17–24) in the BaTiO3 system are major issues in the improvement of the performance of MLCCs. To clarify these effects, it is essential to understand the microscopic origin of the dielectric property precisely on the basis of the polarization mechanism. In BaTiO3, ionic and dipole polarizations predominantly determine the dielectric property. The ionic polarization is related to lattice vibrations (phonons).25–29) On the other hand, the dipole polarization is governed by the ferroelectric domain-wall contributions in multi domain crystals and ceramics.11,12,30–32) Additionally, the dielectric relaxation related to order–disorder phenomenon has been reported in single-domain crystals.33,34) However, these polarization mechanisms are complicated and as yet unclarified. Thus, accurate dielectric spectra in the THz region is highly desired in the analysis of the ionic polarization and order–disorder relaxation.
In past research, because BaTiO3 is opaque in the THz region, the dielectric permittivity in the THz region has been estimated by analyzing far-infrared reflection spectra using the Kramers–Kronig relation and/or a harmonic oscillator model describing the lattice vibrations.11,12,23–29,32) However, the Kramers–Kronig transformation requires accurate knowledge of the reflectance over a wide frequency range and extrapolation beyond it; thus, it is not suitable for the estimation of the dielectric permittivity of BaTiO3, which has a multi-polarization mechanism. Moreover, the uncertainty of the analysis using a harmonic oscillator model interferes with the accurate estimation of the dielectric function of BaTiO3.
In contrast, an ellipsometric technique provides the complex permittivity of an opaque substance without any assumptions or preliminary knowledge.35,36) Recently, THz and infrared ellipsometers, which enable us to analyze ionic polarizations, have become available.37–44) However, accurate dielectric spectra of BaTiO3 in the THz region, which is exactly important for understanding excellent dielectric properties from the phononic view point, have not been measured yet.
In this study, we developed an ellipsometric system based on the Fourier transform far-infrared (FTFIR) spectrometer and measured the complex permittivity of single-domain BaTiO3 crystals at 0.90–21 THz to understand the intrinsic dielectric property in terms of polarization mechanism.
2. Basic principle and experimental procedure
Because BaTiO3 has the tetragonal symmetry at room temperature, the complex ordinary and extraordinary refractive indices were measured by the anisotropic ellipsometry35,36,45) to determine the complex permittivities along the a- and c-axes. The laboratory  axes are defined as shown in Fig. 1. The reflecting surface is the
  plane, and incidence plane is the
  plane, with the z-axis normal to the surface. The principal axes of the crystal are the unit vectors a, b, and c. The orientation of the crystal relative to the laboratory coordinate system is described by the azimuth angle φ between the y- and c-axes. When a plane wave is the incident by incidence angle θ, there are a reflected plane wave and two transmitted plane waves, the ordinary and extraordinary waves. We denote the refractive index n of the ambient, and the complex refractive indices No = no − iko of the ordinary wave and Ne = ne − ike of the extraordinary wave. The relationship between the incident wave and the reflected wave can be described using the Jones matrix R of a sample as

where Eip and Eis are respectively the p- and s-polarized components of the electric field of incident wave, Erp and Ers are respectively the p- and s-polarized components of reflected wave. In the case of an anisotropic sample, the off-diagonal elements  of the Jones matrix are generally not zero, which means that the ellipsometric equation is quite complicated. However, in some special configurations, the off-diagonal elements of the Jones matrix vanish and the Jones matrix becomes diagonal. For example, when the optic axis is parallel to the surface and incident plane (φ = 0), the reflection coefficients are given by35)


When the optic axis is parallel to the surface and perpendicular to the incident plane (φ = π/2), the reflection coefficients are given by


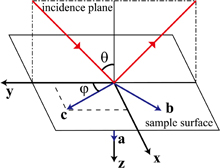
Fig. 1. Definitions of the  and
and  coordinate systems and orientation of the c-axis.
Download figure:
Standard image High-resolution imageIn this study, a far-infrared spectroscopic ellipsometer shown in Fig. 2 was uniquely developed using a FTFIR spectrometer (JASCO FARIS-1). The Michelson interferometer of Fourier-transform spectrometer is followed by a rotating analyzer-type ellipsometer,35,36) which contains a compensator (C) in the optical path after a rotating wire-grid polarizer (PR). The light source is a high-pressure mercury lamp, and the detector is a Si bolometer unit (Infrared Laboratory) which enables us to measure a far-infrared spectrum in the low-frequency region. The reflected light is elliptically polarized owing to the difference in complex reflection coefficients between the p- and s-polarizations. The light of the p- and s-polarized components is individually measured by a rotating wire-grid analyzer (AR). The rotating polarizer, rotating analyzer, sample stage, and incident angle are controlled by stepping motor controllers and software to measure the polarized state precisely. In addition, prior to the sample measurement, residual calibration46) was carried out.

Fig. 2. Schematic diagram of far-infrared spectroscopic ellipsometry setup.
Download figure:
Standard image High-resolution imageIn the rotating-analyzer-type ellipsometric measurement without a compensator, when the azimuth angle of the polarizer is set to π/4 relative to the plane of reflection, the intensity I at the detector can be written using Stokes parameters s0, s1, and s2 as38)

where α is the azimuth angle of the analyzer.17) Hence, the Stokes parameters can easily be obtained from the intensity measured under the analyzer setting of α = 0, π/4, π/2, and 3π/4 using the following equations:

In addition, the Stokes parameters are related to the ellipsometric parameters Ψ and Δ as

When Δ is close to 0 or π, the experimental error is considerably large, because the experimental errors of Ψ and Δ in the rotating-analyzer ellipsometry are proportional to (sin Δ)−1.47) In the measurement of high-permittivity materials such as BaTiO3, Δ is close to π especially at a frequency below 100 cm−1. In such cases, it is known that the accuracy of measurements can be improved by incorporation of a compensator that shifts Δ in the rotating-analyzer ellipsometric system.36) Therefore, three types of THz compensator (TYDEX WP-CQ-L20-H20-OW61.5-L/4, WP-CQ-L20-H20-OW148-L/4, and WP-CQ-L20-H20-OW496-L/4) were introduced separately between the polarizer and the sample for wideband spectral measurements. Since the ellipsometric parameters measured with a compensator contain mixed information on the compensator and sample, it is necessary to calibrate them to determine the ellipsometric parameters of the sample alone. In this study, an experimental calibration proposed by Chindaudom and Vedam48) was carried out. This method requires the intensity of light reflected on the reference mirror. The ellipsometric parameters  in the polarizer-compensator-mirror-analyzer ellipsometric configuration shown in Fig. 3(a) were measured. For such an arrangement, the ellipsometric equation is given by
where Ep and Es are respectively the p- and s-components of the light transmitted through the polarizer, E1p and E1s are respectively the p- and s-components of the light transmitted through the compensator. On the other hand, in polarizer-compensator-sample-analyzer configuration shown in Fig. 3(b), the ellipsometric equation is written by

From the definition, the p- and s-component reflection coefficients of the sample alone are rpp = E2p/E1p and rss = E2s/E1s, respectively. Therefore, the desired Δ and Ψ of the sample can be calculated using Eqs. (11) and (12):
Using this calibration method, the ellipsometric parameters  of BaTiO3 single crystal were measured for the sample orientation of φ = 0 and π/2. To determine the complex refractive indices (No = no − iko, Ne = ne − ike) of BaTiO3 single crystal, the following function
  was minimized by nonlinear least-squares calculation:
where the suffixes "exp" and "cal" indicate respectively the experimental value and the value calculated using Eqs. (2), (3), (5), (6), and (13). From the complex refractive indices obtained by least-squares calculation, the complex permittivities of BaTiO3 single crystal along the a- and c-axes were determined.
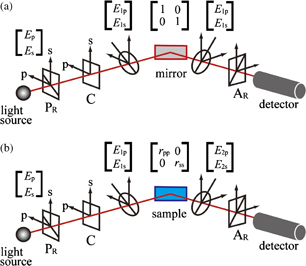
Fig. 3. Schematic diagrams of ellipsometric arrangement for the measurements with a compensator: (a) polarizer-compensator-mirror-analyzer configuration and (b) polarizer-compensator-sample-analyzer configuration.
Download figure:
Standard image High-resolution imageAs the sample, we used a crystal plate of (100) BaTiO3 purchased from Furuuchi Chemical. The crystal was grown by a top-seeded solution growth (TSSG) method and has single-domain state. The sample size was 10 × 10 × 0.5 mm3 and the surface was mirror polished.
3. Results and discussion
Figures 4 and 5 show the complex permittivity of tetragonal BaTiO3 along the a- and c-axes, respectively. Using the far-infrared spectroscopic ellipsometer, the dielectric responses of the BaTiO3 single crystal were successfully measured in the region of 30–700 cm−1 (0.90–21 THz).

Fig. 4. Complex permittivity of single-domain BaTiO3 along the a-axes.
Download figure:
Standard image High-resolution image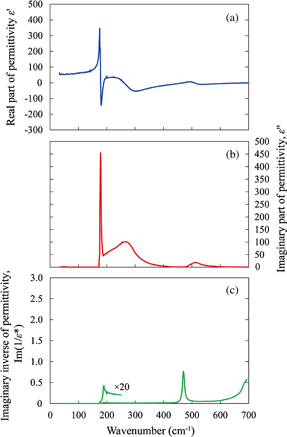
Fig. 5. Complex permittivity of single-domain BaTiO3 along the c-axes.
Download figure:
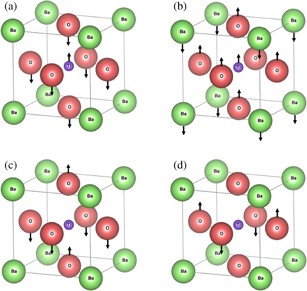
Standard image High-resolution imageNow, we shall determine the phonon modes contributing to the dielectric responses to understand the results. The cubic phase (Oh symmetry) of BaTiO3 has four optical modes (3F1u + 1F2u symmetry modes) and one acoustic mode (1F1u symmetry mode).49) The degenerate optical F1u modes are infrared active and the three eigenmodes are called the Slater,50) Last,51) and Axe52) modes, as shown in Figs. 6(a)–6(c). The Slater mode represents the mutual oscillation between the Ti cation and the rigid O6 octahedra, and is known as the soft mode, which leads to the ferroelectric phase transformation. The Last and Axe modes indicate the oscillation of Ba2+ against the TiO6-octahedral framework and the bending of O6 octahedra, respectively. The F2u mode indicates the torsion of O4 [Fig. 6(d)]. At room temperature, BaTiO3 has the tetragonal C4v symmetry in which each of the F1u modes splits into optical A1- and E-symmetry modes, the F2u mode splits into optical B1 and E modes, and the acoustic F1u mode splits into acoustic A1 and E modes. The optical A1 phonon modes are infrared-active for the extraordinary ray, whereas the optical E modes are infrared-active for the ordinary ray. The B1 mode is infrared-inactive. Each of the optical A1 and E modes further splits into transverse and longitudinal modes. The modes that contribute to the dielectric response are represented as 3A1(TO) + 3A1(LO) + 3E(TO) + 3E(LO) + 1E(TO) + 1E(LO), where the first four items are the A1–E pair modes that split from the F1u modes, the last two items are the E modes split from the F2u mode, and TO and LO indicate the transverse and longitudinal optical modes, respectively.4) On the basis of the Lyddane–Sachs–Teller relation for the optical phonon modes, the A1 and E modes contribute to the dielectric response parallel and perpendicular to the ferroelectric axis (c-axis), respectively.
Fig. 6. Lattice vibrations of BaTiO3: (a) Slater, (b) Last, (c) Axe, and (d) O4 torsional modes.
Download figure:
Standard image High-resolution image
In Fig. 4(b), there are three maxima in the imaginary part of permittivity ε'' along the a-axis. The maxima at 182 and 490 cm−1 correspond to the E(TO) frequencies of the Last and Axe modes, respectively. The maximum at 307 cm−1 corresponds to the E(TO) mode stemming from the "silent" F2u mode (O4 torsional mode).26) This mode is extremely weak,28) but can be clearly observed by ellipsometric measurement. In addition, the increase in ε'' at a low frequency comes from the Slater E(TO) mode.4,26,33) The frequency of the Slater E(TO) mode has been reported to be about 34 cm−1.26) However, the Slater E(TO) mode is known to be overdamped, in which the maximum ε'' is present at a frequency lower than the resonance frequency. Therefore, we were unable to observe the maximum ε'' due to the Slater E(TO) mode in the measurement range down to 30 cm−1, and it was impossible to determine the resonance frequency of the Slater E(TO) mode directly from the ε'' spectrum. On the other hand, the resonance frequencies of the E(LO) modes were estimated from the spectrum of the imaginary inverse of the complex permittivity, Im(1/ε*), as shown in Fig. 4(c). The E(LO) frequencies of the Slater, Last, and O4 torsional modes were 180, 306, and 465 cm−1, respectively, whereas the E(LO) frequency of the Axe mode, which has been reported as 706 cm−1, was outside the measurement range.26)
Next, we discuss the dielectric response along the c-axis, i.e., the response of the A1-symmetry mode. In Fig. 5(b), there are three maxima in ε'' corresponding to the A1(TO) frequencies of the Last, Slater, and Axe modes.4,33) The A1(TO) frequencies of the Last, Slater, and Axe modes were estimated as 178, 270, and 512 cm−1, respectively. Moreover, from the Im(1/ε*) spectrum in Fig. 5(c), the A1(LO) frequencies of the Last and Slater modes were approximately 188 and 470 cm−1, respectively, whereas the Axe A1(LO) frequency at 729 cm−1 was not observable in the measurement range.26) Table I shows a summary of the TO and LO frequencies for the E- and A1-symmetry modes. The resonance frequencies estimated in this study were in agreement with the data estimated by analysis of reflection spectra using a harmonic oscillator model in a previous study.26) These results prove that the far-infrared ellipsometric technique is effective for analysis of the phonon modes of BaTiO3 single crystals.
Table I. Resonance frequency of (a) E modes and (b) A1 modes. The resonance frequencies estimated in this study are in agreement with the frequencies estimated by analysis of reflection spectra using a harmonic oscillator model in a previous study.26)
| (a) | ||
|---|---|---|
| Frequency (cm−1) | Frequency reported by Servoin et al.26) (cm−1) | |
| Slater E(TO) | 34 | |
| Slater E(LO) | 180 | 180 |
| Last E(TO) | 182 | 181.8 |
| Last E(LO) | 306 | 305.6 |
| O4 torsional E(TO) | 307 | 306 |
| O4 torsional E(LO) | 465 | 465 |
| Axe E(TO) | 490 | 482 |
| Axe E(LO) | 706 | |
| (b) | ||
|---|---|---|
| Frequency (cm−1) | Frequency reported by Servoin et al.26) (cm−1) | |
| Last A1(TO) | 178 | 180 |
| Last A1(LO) | 188 | 187 |
| Slater A1(TO) | 270 | 280 |
| Slater A1(LO) | 470 | 469 |
| Axe A1(TO) | 512 | 507 |
| Axe A1(LO) | 729 | |
In the ε'' spectra shown in Figs. 4(b) and 5(b), the Slater E(TO) and A1(TO) modes showed broaden profiles, which means that the Slater E(TO) and A1(TO) modes are heavily damped modes, that is, the soft modes were anharmonic as a result of their coupling with other modes that are not only phonons26,27) but also the order–disorder mode.4,33,53,54) Recently, it has been considered that Ti ions are displaced along the  directions, which is the so-called "eight-site model", and hop randomly between quadruplets along the
  directions in tetragonal BaTiO. Hlinka et al.33) have reported that the order–disorder mode of the Ti flipping would contribute to the dielectric response along the c-axis. Moreover, Liu et al.4) have pointed out that the order–disorder mode would couple with the Slater A1(TO) mode. In terms of the dielectric response along the a-axis, there may be no marked difference between the Slater E(TO) mode and the order–disorder mode. Therefore, the Slater E(TO) mode is present at a low frequency and is overdamped, and the damping factor of the A1(TO) mode is considerably large. Hlinka et al. reported on the dielectric spectrum measured by terahertz time-domain spectroscopy (THz-TDS) and the order–disorder-related A1 mode relaxation at over 50 cm−1 at 298 K.33) If the order–disorder-related A1 mode relaxation is present at over 50 cm−1, the maximum ε'' along the c-axis should be observed using the far-infrared ellipsometer. However, ε'' was nearly zero in the frequency region below 170 cm−1, which means that the presence of the order–disorder mode cannot be confirmed in this study. Because the order–disorder mode would be enhanced with increasing temperature up to Currie temperature, the dielectric response at a high temperature should be measured using the far-infrared ellipsometer in further study to confirm the presence of the order–disorder mode.
4. Conclusions
In this study, the dielectric response of single-domain BaTiO3 in the region of 30–700 cm−1 (0.90–21 THz) was measured using a far-infrared spectroscopic ellipsometer. The responses of the Slater, Last, Axe, and O4 torsional modes, which are all infrared-active phonon modes in BaTiO3 were clearly observed. The TO and LO frequencies for the E- and A1-symmetry modes were in agreement with the previous data estimated by analysis of reflection spectra using a harmonic oscillator model. These results prove that the far-infrared ellipsometric technique is effective for analyzing the phonon modes of BaTiO3 single crystals. Moreover, we examined the dielectric response and the damping of the soft mode with respect to the order–disorder model. However, the evidence for the presence of the order–disorder mode could not be obtained in this study. In further study, we need to measure the dielectric response near Curie temperature to reveal this presence.