

Abstract
We have fabricated Au nanoparticle arrays on the flexible poly(dimethylsiloxane) (PDMS) film. The nanoparticles were bound to the film via a covalent bond by a ligand exchange reaction. Thanks to the strong chemical bonding, highly stable and uniformly dispersed Au nanoparticle arrays were fixed on the PDMS film. The Au nanoparticle arrays were characterized by the UV–vis, scanning electron microscope (SEM) and surface enhanced Raman scattering (SERS). The UV–vis and SEM measurements showed the uniformity of the surface-dispersed Au nanoparticles, and SERS measurement confirmed the chemistry of the PDMS film. Reflecting the high stability and the uniformity of the Au nanoparticle arrays, the plasmon wavelength of the Au nanoparticles reversely changed with modulation of the interparticle distance, which was induced by the stretching of the PDMS film. The plasmon wavelength linearly decreased from 664 to 591 nm by stretching of 60%. The plasmon wavelength shift can be explained by the change in the strength of the plasmon coupling which is mechanically controlled by the mechanical strain.
Export citation and abstract BibTeX RIS
1. Introduction
The optical response of metallic nanostructures is of fundamental scientific interest and found its potential application for a molecular sensing and optical filtering.1) For metallic nanostructures whose diameters are much smaller than the wavelength of the incident light, a localized surface plasmon (LSP) is excited in the metallic nanostructures.2–4) The excitation of LSP results in a strongly enhanced electric near field localized at the particle surface. The LSP wavelength depends on the shape and size of the metallic nanostructures. In the case of Au nanoparticles, they exhibit colours ranging from red to purple according to their sizes. When the distance between nanostructures decreases, the plasmon modes of the individual nanostructures interact each other, resulting in the plasmon coupling.2–4) The plasmon resonance causes a red shift of the LSP-wavelength with respect to that of the individual nanostructures. In solution, the Au nanoparticles can aggregate with the time, resulting in a red shift of the plasmon resonance, as evidence by colour change from red to purple.5–7) This kind of colour change has been employed to detect biomolecules including DNA and protein biomarker for cancer and other diseases.8,9) In addition to the shift of plasmon resonance, the plasmon coupling is the unique optical response appears in the metallic nanostructures, in which the electric field between metal nanoparticles can be increased by a factor of 1000. This strong electric field is applied to various measurement techniques including surface enhanced Raman scattering (SERS),10,11) surface enhanced infrared absorption spectroscopy (SEIRAS).12) Anker et al. reported that SERS signal can be detected from a single dye molecule using the enhanced filed between Ag nanoparticles in 2008.13)
The plasmon coupling depends on the distance between nanostructures. Therefore, the controlling the distance between nanostructures is the key for governing the nanooptics. In order to control the distance between nanostructures, the nanogap electrode method based on lithographic technique is most straightforward approach. The change in extinction spectra and SERS has been reported for Au nanoparticle pairs and dimer type nanogap gold structures fabricated with the electron beam lithographic technique.3,6,14) Jain et al. showed the plasmon wavelength-shift decayed nearly exponentially with the gap distance between gold nanoparticles, and that the decay length was roughly about 0.2 in unit of particle size.6) While the tuning of the plasmon coupling of a particle pair has become possible, the second step is tuning the gap distances and the plasmon couplings for nanoparticle assemblies. Based on this interest, nanostructures on the flexible substrate has been studied. Matthew et al. fabricated the Au nanoparticle mats on the poly(dimethylsiloxane) (PDMS) film, by transferring the monolayer of close-packed Au nanoparticles to the PDMS film.15) The interparticle distances of the nanoparticle assemblies were modulated by stretching the PDMS substrate. The plasmon resonance peak in the UV–vis spectra, changes with the stretching, reflecting the change in the gap size. However, there are several issues on this Au nanoparticle mats on PDMS; low homogeneity and low resistance to chemical attack. Due to the low homogeneity of the interparticle distances, the UV–vis spectra changes with the samples, and colour is changeable depending, even, on the position in the same sample. In addition, the Au nanoparticles are fragile and easily peeled off from the PDMS film, because the Au nanoparticles are bound to PDMS via the weak physical interaction.
To overcome these problems, we focused on the chemical approach to fabricate the stable Au nanoparticle arrays on the flexible substrate. The Au nanoparticles were covalently attached to substrate by the chemical reaction. This chemical approach has been already reported for the solid substrate, such as glass, indium tin oxide (ITO), SiO2/Si substrates.16) However, there are little studies with the flexible substrates. In this study, he Au nano particles were chemically bounded to the PDMS substrate functionalized with 3-mercaptopropyltrimethoxyilane via chemical bonding. The Au nanoparticles were attached to the PDMS by ligand exchange reaction. The gold nanoparticles fixed on the chemically functionalized PDMS (f-PDMS-Au) was very stable and uniform. Stretching the f-PDMS-Au proves active and reversible tuning of their plasmonic properties. The stretching induced blue shift of the plasmonic resonance.
2. Experimental methods
2.1. Sample preparation
2.1.1. PDMS film.
PDMS film was prepared by using Sylgard 184 elastomer kit (Dow Corning). The two liquid components of the kit (base and curing agent) were mixed in a ratio of  . The mixture was casted in a Petri and left 2 h. The polymerization reaction was proceeded by heating the Petri for 10 min at 100 °C using a hot plate. Then the PDMS film was cut in several pieces for further functionalization (square/rectangular shape).
2.1.2. Gold nanoparticles.
20 ml of a solution of gold precursor (HAuCl4  3H2O, Sigma Aldrich), and 5 ml aqueous solution of trisodium citrate (Na3C6H5O7 2H2O, Tokyo Chemical Industry) were preheated at reaction temperature (75 °C). The solution was magnetically stirred in a flask immersed in a temperature-controlled water bath, and the citrate solution was quantitatively added to the acid solution. The solution was heated at 75 °C for 1 h, then cooled down. The red solution of gold nanoparticles was centrifuged for 20 min at 5000 rpm, and the precipitated nanoparticles were re-dispersed in pure water (Au nano particle solution).
2.1.3. Functionalized PDMS with Au nanoparticles.
The surface of PDMS film was activated with HCl and H2O2 in water (volume ratio:  ).17) The film in the solution was heated up at 100 °C for few minutes, then washed several times with water until the pH came back at neutral value. The PDMS film was dried in air, and was inserted in a flask with dry DMF (3 ml) and 3-mercaptopropyl-trymethoxysilane (10.7 nmol), heated at 100 °C under magnetic stirring for 12 h. Then, the PDMS film was washed several times with DMF, then with acetone in order to remove unreacted silane and dry in air. The PDMS film was inserted in the Au nanoparticle solution and left there overnight.
2.2. Characterization
2.2.1. UV–vis.
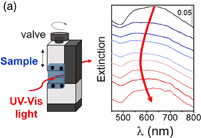
UV–vis spectra were measured at room temperature with a Jasco V-650 spectrophotometer. For the measurement of the gold nanoparticles solution, the 1 ml solution was placed in a cell. The stretch dependence measurement was performed with a home-made tool (see the schematic illustration in Fig. 5). The PDMS film was clamped with two metal plates. The distance between two plates was controlled with the wheel, and the PDMS film was stretched gradually and relaxed back to the original configuration. The film was uniaxially stretched along one axis. The polarization of light was parallel to the stretch direction.
2.2.2. Scanning electron microscopy.
Gold nanoparticles and the functionalized PDMS film were characterized using scanning electron microscopy (SEM; JEOL JSM-7500F). For Au nanoparticles analysis, a drop of Au nanoparticle solution was deposited onto a small (1 × 1 cm2) square of ITO coated glass. The sample was dried in the air. To analyse the non-conductive PDMS film, a thin layer of Pd/Pt was deposited on the substrate with sputtering.
2.2.3. Raman spectroscopy.
The SERS was measured using a NanoFinder30 Raman microprobe with 1 s integrations (Tokyo Instruments). Near-infrared (NIR) laser light (λex = 785 nm, 70 mW) was used as excitation light. The NIR beam was focused onto the sample using an objective lens with 20× magnification and a numerical aperture of 0.45. The estimated spot size of irradiation was about 1 µm.
3. Results and discussion
The surface functionalization of the PDMS film was verified by SERS. Figure 2 shows the SERS spectrum of the f-PDMS-Au. The SERS spectrum shows several peaks at 177, 490, 672, and 1409 cm−1. A broad peak at 177 cm−1 was assigned to vibrational modes of the PDMS film.18) The peaks at 490, 672, and 1409 cm−1 were assigned to the Si–O–Si stretching, stretching of thiol groups (S–H stretching), and stretching of carboxylate group (COO−) and/or methylene groups (–CH2–), respectively.19) The appearance of these vibrational modes confirmed that the PDMS film was functionalized as we expected (Fig. 1).

Fig. 1. Synthetic scheme of chemical approach to synthetize the derivative substrate. First step is an activation of the PDMS with H2O2, HCl in water solution (volume ratio  ). The silane was reacted with the substrate. Finally, Au nanoparticles were covalently bound to the thiol terminated PDMS.
Download figure:
Standard image High-resolution image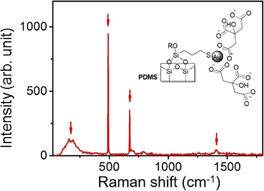
Fig. 2. SERS spectrum of functionalized PDMS with gold nanoparticles. Raman spectrum shows peaks at 177, 490, 672, and 1409 cm−1. Inset shows schematic of the functionalized PDMS.
Download figure:
Standard image High-resolution imageThe size of Au nanoparticles was characterized by UV–vis and SEM. Figure 3 shows the UV–vis spectrum of the Au nanoparticle solution. The UV–vis spectrum shows a peak centred at 524.7 nm (red color). A previously reported study discovered a relationship between nanoparticles size and extinction spectra as follows:

where Aspr and A450 represent the absorbance of the plasmonic peak and the absorbance at λ = 450 nm, respectively.20) In our sample, the value of the absorbance ratio (Aspr/A450) was 1.57, which corresponded to the nanoparticle size of 12 nm. The nanoparticle's size was also evaluated by SEM [Fig. 3(b)]. The inset of Fig. 3(b) shows the distribution of the particle size obtained from 100 nanoparticles. The average diameter was 14 nm, which agreed with the value obtained by UV–vis. The distribution was narrow, indicating that the nanoparticles were monodisperse.

Download figure:
Standard image High-resolution image
Fig. 3. (a) Extinction spectrum of gold nanoparticles solution, Inset: Photo image of Au nanoparticles solution. (b) SEM image of Au nanoparticles deposited on conductive ITO substrate. Inset: Distribution of particle diameters obtained from 100 nanoparticles.
Download figure:
Standard image High-resolution imageFigure 4(a) shows a picture of the f-PDMS-Au. The f-PDMS-Au has a shiny mirror-like metallic sheen, which was very different from the red Au nanoparticle solution. It is noteworthy that the colour was uniform, and SEM image (inset of Fig. 4) supported that Au nanoparticles distributed homogeneously. Figure 4(c) shows the UV–vis spectra of the same sample with different positions. The resonant wavelength was 650 nm, and the fluctuation of the resonant wavelength was as small as 6 nm. The resonant wavelength of nano particle arrays was obtained by fitting the spectrum with the Gaussian function in the present study. For comparison, we also prepared the Au nano particles on the PDMS film without the chemical modification, following the previously reported study.15) Monolayers of close-packed Au nanoparctiles were first self-assembled at a hexane/water interface by adding the 1-dodecanethiol. Then the Au nano particle were transferred to the non-functionalized PDMS film (n-PDMS-Au). The obtained sample was inhomogeneous [Fig. 4(b)]. We can see small blue areas, corresponding to the presence of nanoparticles, and the transparent areas, corresponding to the lacking of nanoparticles. The discontinuous coating of nanoparticles was confirmed by SEM [inset in Fig. 4(a)], showing the random distribution of nanoparticles on the surface. The extinction spectra fluctuated with the position, reflecting the inhomoginity of the sample [Fig. 4(d)]. The fluctuation of the resonant wavelength increased from 6 to 72 nm.
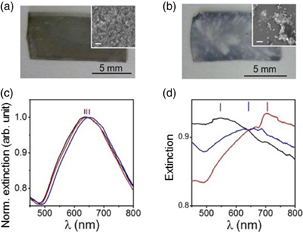
Fig. 4. Pictures of f-PDMS-Au (a) and n-PDMS-Au (b), inset: SEM images of both substrate. The white scale bar: 200 nm. (c, d) Comparison of UV–vis spectra of different area of the identical sample obtained with f-PDMS-Au (c) and n-PDMS-Au (d). UV–vis spectra of (c) are normalized to a maximum value of each spectrum.
Download figure:
Standard image High-resolution imageWe have successfully prepared the uniform and stable Au nanoparticle arrays on the flexible PDMS film. This is because the gold nanoparticles were bound to the PDMS film via a strong covalent bond. The presence of a strong interaction guarantees the stability of the system, compared with the n-PDMS-Au. In the preparation of the f-PDMS-Au, the PDMS film was washed, and thus, the Au nanoparticles not covalently bonded to the surface, was removed from the surface. Consequently, the PDMS was covered with the monolayer of Au nanoparticles, while the additional multilayer of Au nano particles were not formed on the PDMS. The uniformity of the sample can be controlled by the first step with silane derivatization of the PSMS surface, the proper concentration of silane, the correct temperature and time allowed to synthesize a sample with a very thin layer of silane without aggregation that is the base for the second step with gold nanoparticles.
We then investigated the change in the optical properties of the film by the mechanical stretching. The UV–vis spectra of the f-PDMS-Au show a blue-shift with stretching. Figure 5(a) shows examples of the UV–vis spectra during the stretching process. Figure 5(b) shows the wavelength of the peak in the spectra (λmax) as a function of stretching. During the stretching process, λmax moved from 623 to 575 nm, and returned to 624 nm by relaxing the mechanical strain. Figure 5(c) is the average peak position as a function of the stretching obtained from three samples. λmax shifted from 664 to 591 nm by stretching of 60%. Similar trend was reported by Millyard et al. using the n-PDMS-Au. They reported the plasmon shift of 40 nm for that sample with a maximum stretch of 35%.15)
Download figure:
Standard image High-resolution image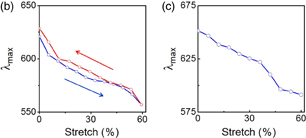
Fig. 5. (a) UV–vis spectra of f-PDMS-Au obtained under increasing and then decreasing the mechanical strain together with the experimental set-up. (b) Example of shift of λmax as a function of stretching in the stretching (blue) and relaxing process (red). (c) Average of shift of λmax as a function of stretching. Data are obtained from three different samples.
Download figure:
Standard image High-resolution image
The shift of λmax can be explained by the change in the strength of the strength of the plasmon coupling. When the light is irradiated to the Au nanoparticles, the localized surface plasmon is excited. The excitation of plasmon results in a near field localized at the particle surface. When two nanoparticles are placed next to each other, the near field on one particle interacts with that on an adjacent particle in close proximity, coupling the plasmon oscillation together. The energy of the hybridized plasmon mode is lower (red shift) with respect to that of the plasmon modes of the individual nanoparticles.2–4,21) The near field decays over a length that is roughly equal to the size of nanoparticle. In the dipole coupling model,22) the dipolar near field decays as the cube of the inverse distance. Therefore, the plasmon coupling strength becomes a function of d−3. Since the plasmon shift reflects the strength of the interparticle electromagnetic coupling, the plasmon shift decays as the cube of the inverse distance.6) Jain et al. experimentally showed the plasmon shift for the gold nanodiscs pairs fabricated with the lithographic technique on quartz slide. The plot of the plasmon shift versus the gap distance between nanoparticles followed nearly exponential decay. The decay length was roughly 0.2 times the nanoparticle size.6) Yokota et al. showed the plasmon shift from 650 to 790 nm by changing the distance between Au nanostructures from 100 to 5 nm.14)
In the present study, the plasmon wavelength was 520 nm for individual nanoparticles, while it was 650 nm for f-PDMS-Au before stretching (red shift of 130 nm). The plasmon was red shifted with respect to the individual particles. By stretching the f-PDMS-Au, the plasmon wavelength linearly decreased with stretching (blue shift) by 80 nm. The shift of 80 nm was smaller than 130 nm, and plasmon shift linearly changed with the stretching, indicating that we only observed the part on the decay curve for the plasmon shift as a function of the gap distance. Here, we assume that the Au nanoparticles are aligned parallel to the stretch direction, where the particle size and gap size are d and g, respectively. The particle size does not change with the stretching. So, when the film is stretched by 60%, d + g + Δg = 1.6(d + g), where Δg is the increase in the gap size. Δg = 0.6(d + g). The Δg increases with d, and is larger than 0.6d. In this study, d was 14 nm, and thus, Δg was larger than 8.4 nm, which is compatible to the particle size. If the film was uniformly stretched, the plasmon coupling strength should be drastically reduced, and plasmon wavelength should be close to that for individual nanoparticles. The gap distance was not changed as expected. The large discrepancy and broadening of the spectrum can be explained by several possible reasons. The inhomogeneous stretching of the film, misalignment of the gap direction with the stretching direction, ignorance of the higher order plasmon coupling (quadrupolar plasmon) quantum effect,23) and far-field interaction.24–26) The effect of the far-field interaction is clearly observed when the interparticle distance approaches the plasmon resonance wavelength. The plasmon resonance is red shifted due to the dipolar coupling.
4. Conclusions
We reported stabile and quick derivatization method to synthetize a system composed by PDMS decorated with gold nanoparticles, which were bonded to the PDMS via covalent bond. The analysis (Raman scattering, TEM, and UV–vis) demonstrated the success in chemical derivatization and the homogeneity of the sample. We succeeded to study the reversibility of tunable plasmonic properties by stretching and relaxing the substrate composed. Stretching the elastomeric PDMS film caused the interparticle distance change, consequently optical properties change. The plasmon wavelength linearly decreased from 664 to 591 nm by stretching of 60%.
Acknowledgments
This work was financially supported by Grants-in-Aid for Scientific Research (Nos. 70313020, 16K13975, and 15K17842) from the Ministry of Education, Culture, Sports, Science and Technology (MEXT) and Asahi Glass, Murata, Iketani, and Sumitomo foundations.