

Abstract
In this paper, we describe the mechanism and solution for dominating temperature effects on refractive-index-based Si optical resonator sensors such as ring resonator and photonic crystal resonator sensors. The temperature change affects the silicon refractive index and also the resonator mechanical shape. As a result, it is reported that the refractive index change is marked, whereas the mechanical deformation effect is negligible. We also demonstrated that the differential operation is effective for suppressing the temperature effect for Si ring resonator sensors.
Export citation and abstract BibTeX RIS
1. Introduction
It has been known that the refractive index (RI) of silicon greatly changes with temperature.1,2) The effective refractive index of the sensor surface changes owing to biomaterial adsorption. Thus, it becomes difficult to measure a biomaterial-induced resonance wavelength shift precisely because of thermal fluctuation that changes the silicon refractive index as well as takes part in the resonance wavelength shift. Controlling thermal effects is important to detect biomaterials perfectly as the effective refractive changes with temperature. The change in biomolecule concentration induces the change in local refractive index, including a resonant wavelength shift. However, the silicon itself has a large thermo-optic coefficient3) (dn/dT = 1.8 × 10⁻⁴/°C, where n is the refractive index and T is the temperature). Furthermore, the deformation of the device mechanical shape due to the temperature change induces the resonance wavelength shift. Owing to the large thermo-optic coefficient of Si, an active thermal controller is required to detect biomolecules precisely. However, for low-cost applications, active thermal control is often not feasible. Several thermal-effect-compensating devices that can be used without any thermal controller, were previously developed4–19) by designing a specific device structure that compensates for thermal effects. As the temperature changes, device mechanical deformations occur together with the refractive index change of Si.
In this work, the resonance wavelength shifts of Si ring and photonic crystal resonators on silicon-on-insulator (SOI) substrates were investigated. To solve the problem regarding temperature instability, we proposed a differential operation of two resonators,20) where a π phase shifter is installed in one of the two outputs before merging. In this case, the integral intensity of the differential output becomes temperature-independent because the resonance wavelengths of the two resonators shift in parallel. The schematic structures of the differential Si ring and photonic crystal (PhC)-based cavity-type resonators21) are shown in Figs. 1(a) and 1(b), respectively.

Download figure:
Standard image High-resolution image
Fig. 1. Schematics of (a) differential Si ring resonator biosensor and (b) photonic crystal cavity resonator.
Download figure:
Standard image High-resolution image2. Simulation of temperature effects of Si resonators
2.1. Effective refractive index change of Si and thermal deformation of Si resonators
The resonance wavelength shift of Si resonators by thermal change is given by

where λres, neff, and L are the resonance wavelength, effective refractive index, and size of the resonator, respectively. Δλres, Δneff, and ΔL are the changes in these parameters due to the temperature change. The right-hand first term indicates the effective refractive index (Si) effect and the latter term indicates the thermal deformation effect. This equation is easily derived from the equation λres = neffL/m, where m denotes the integer. As the temperature increases, Si and SiO2 thermally expand with different thermal expansion coefficients and the SOI wafer has a curvature shape as shown in Fig. 2. The radius of the curvature of the SOI substrate is given by22)
where h, α1, and α2 are the total thickness and thermal expansion coefficients of Si and SiO2, respectively. Moreover, p = dSiO2/dSi (where dSiO2 and dSi are the thicknesses of SiO2 and Si, respectively), q = YSiO2/YSi (where YSiO2 and YSi are Young's moduli of SiO2 and Si, respectively), and ΔT is the temperature change. The change in resonator size is expressed as

where d is the thickness of the SOI substrate. Here, d = dSi + dSiO2 and dSi ≫ dSiO2 is assumed.
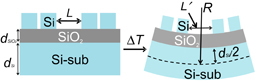
Fig. 2. Curvature shape of thin Si layer due to mechanical deformation by temperature change.
Download figure:
Standard image High-resolution image2.2. Simulation of temperature dependence of resonance wavelength of differential Si ring resonator sensor
In the differential silicon ring resonator, one ring is considered as a detection ring, on which a biomaterial is adsorbed, and the other is considered as a reference ring, which is not exposed to the biomaterial. The phase of one of the outputs is changed by π and merged again. When a biomaterial is not adsorbed on the detection ring, the differential output is zero because two resonance curves completely overlap. When a biomaterial is adsorbed on the detection ring, its resonance curve shifts and an output signal appears. Here, we discuss the output spectrum of the differential ring resonator sensor. First, for the single-ring resonator the transmission spectrum Ts is given by23,24)

where sin K is the coupling coefficient, α is the attenuation constant of the waveguide, L is the peripheral length of the resonator, and neff is the effective refractive index of the Si waveguide. The transmission spectrum of the differential Si ring resonator sensor TDS is given by20)

where θ is the phase difference between the detection and reference rings, which is usually π.
The temperature dependence is calculated as

where Δl is the length of the phase shifter, T (°C) is the temperature, n23 is the effective refractive index at 23 °C, and β is the thermal coefficient of the core and various clad layers at the above temperature. n23 and β are obtained as
where n1, n2, and n3 are the refractive indices of the core, top clad, and bottom clad, respectively. The thermal coefficients of the core, top clad, and bottom clad are dn1/dT, dn2/dT, and dn3/dT, respectively. Γ1, Γ2, and Γ3 are the electric field confinement factors of the core, top clad, and bottom clad, respectively, which were obtained by simulation using the Rsoft photonic CAD suite (Synopsys). Equation (9) is obtained using an optical simulator. The values of the bulk materials are obtained from Ref. 25 for oil and Ref. 26 for silicon, SiO2, resist, and air. The actual numerical values of coefficient β are 1.16 × 10⁻⁴/°C for SiO2, 1.14 × 10⁻⁶/°C for water, 1.09 × 10⁻⁴/°C for air, 1.15 × 10⁻⁴/°C for oil, and 1.15 × 10⁻⁴/°C for resist. The mechanical deformation effect is not included because it is negligible as discussed in Sect. 4.
In the differential mode, large-bandwidth input light can be used and the output is the integral of the light intensity within the input light bandwidth or the maximum peak height. Figure 3(a) shows the maximum differential output versus Δneff/neff or ΔL/L, which is the difference in the effective refractive index or circumferential length of the Si waveguide between the detection and reference resonators divided by the original ones, respectively. It is found that there is a linear region in the output versus Δneff/neff or ΔL/L curve. Δneff or ΔL induces Δλres, which is the difference in resonance wavelength between the two ring resonators. In the linear region even though the resonance wavelengths of both resonators are slightly different, the sensitivity defined as output/Δneff or output/Δλres becomes constant when the operation point is in the linear region.20) Figures 3(b) and 3(c) show the calculated temperature change versus maximum output change for various cladding layers (e.g., air, water, resist, oil, and SiO2).
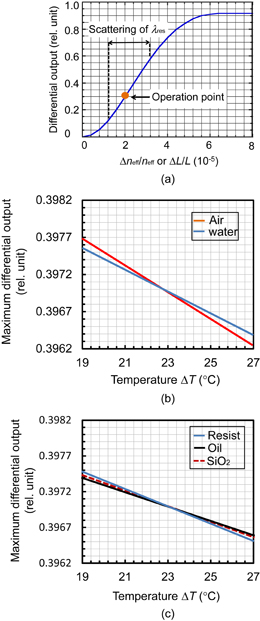
Fig. 3. Simulation results of (a) refractive index versus maximum output change (b) temperature change versus maximum differential output variation at various cladding layers such as air and water, and (c) temperature change versus maximum differential output variation at various cladding layers such as resist, oil, and SiO2.
Download figure:
Standard image High-resolution image2.3. Simulation of temperature dependence of resonance wavelength of PhC cavity resonator sensor
To simulate the temperature dependence of the PhC cavity resonator sensor, we used Eqs. (1)–(3) and (10). The length L of the PhC cavity resonator is considered the maximum electric field distributed area. The field is distributed in the Si resonator as well as in the SiO2 layer. The confinement factors Γ1, Γ2, and Γ3 are for the inside of the resonator area, Si, and SiO2, respectively. The simulated electric field distributions obtained using the Rsoft photonic CAD suites are 58, 22, and 20% of the inside of the resonator region, Si, and SiO2, respectively.
3. Experimental procedure
All the fabrication steps20) of differential Si ring resonators are shown in Fig. 4. The resonators and waveguide were fabricated on an SOI wafer (Si layer of 350 nm thickness, B-doped, p-type, with a resistivity of 14–22 Ω cm on a buried oxide layer of ∼1100 nm thickness). First, standard clean-1 (SC-1) cleaning27) was carried out to remove particles and natural oxide of Si. After that, thermal oxidization was carried out at 1000 °C for 12.5 min to form a 100-nm-thick oxide layer. Next, a positive resist (ZEP520A) was coated to expose the designed pattern by an electron beam lithography system (Elionix ELS-G100). Since it is a point beam lithography machine, both a circle and a curve can be smoothly drawn, compared with the case of a Hitachi HL-700 electron beam lithography machine, which has a variable shape.21) The dry etching of SiO2 was carried out by reactive ion etching (RIE). Si was etched by inductively coupled plasma (ICP) etching and finally the residual SiO2 is removed by hydrofluoric (HF) solution. The scanning electron microscopy (SEM) images of the fabricated Si ring and PhC cavity resonators are shown in Figs. 5(a) and 5(b), respectively. The measurement setup is shown in Fig. 6 where an infrared tunable semiconductor laser (1280 to 1320 nm), an InGaAs photodetector, and lensed fibers are used. The sample temperature was changed by using a Peltier device set in the sample holder with an accuracy of ±10−3 K.

Fig. 4. Fabrication process for Si ring or Si PhC cavity resonator with electron beam lithography and dry etching.
Download figure:
Standard image High-resolution image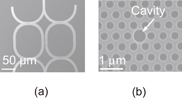
Fig. 5. SEM images of the fabricated device (a) differential Si ring and (b) PhC cavity resonators.
Download figure:
Standard image High-resolution image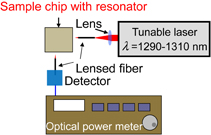
Fig. 6. Schematic of optical measurement system.
Download figure:
Standard image High-resolution image4. Results and discussion
4.1. Mechanism of thermal change in λres of Si ring and PhC resonators
The temperature dependences of the differential Si ring and PhC cavity resonators are shown in Figs. 7 and 8, respectively. In Fig. 9(a), the measured results for the differential Si ring resonator at different temperatures are shown together with the simulation results obtained by the method described in Sect. 2. It is found that the measured data well fit the simulation results and it is clearly observed that the Si refractive index change effect is marked. The mechanical deformation effect is negligible (Δλres/ΔT ∼ −10−4 nm/°C). The result for the PhC cavity resonator is also shown in Fig. 9(b), and the same conclusion as for the ring resonator is derived. For both types of devices, we performed simulation by using Eq. (10) and considering core, top clad, and bottom clad individually. The calculated field distributions in the core (Si), top clad (air), and bottom (SiO2) clad are 80, 8, and 12% respectively.
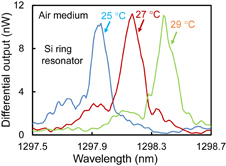
Fig. 7. Measurement results of differential Si ring resonator at different temperatures. The top cladding layer is air.
Download figure:
Standard image High-resolution image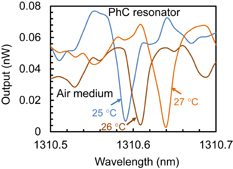
Fig. 8. Resonation spectra of PhC cavity resonator at various temperatures.
Download figure:
Standard image High-resolution image
Download figure:
Standard image High-resolution image
Fig. 9. Effect of temperature on resonance wavelength shift for (a) Si ring resonator and (b) PhC cavity resonator [where silicon effective refractive index change (Ref. index effect) and mechanical effect (Mech. effect) are abbreviated].
Download figure:
Standard image High-resolution image4.2. Thermal stability of differential Si ring resonator sensor
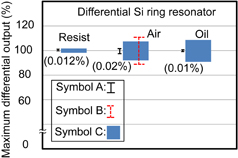
In Fig. 10, the maximum differential output change for ΔT = 4 °C from 25 to 29 °C for the Si ring resonators with different top cladding layers are plotted. In the differential detection, only the maximum differential output, which corresponds to the difference between the resonance wavelength shifts of two rings, is counted. The spectral shift of the differential output is not considered. Theoretically, the maximum differential output change for ΔT = 4 °C is calculated under three different top cladding layer conditions, and the simulated changes for resist, air, and oil are 0.012, 0.02, and 0.01% respectively, as indicated by symbol A. The measured results are also shown in Fig. 10, where the changes in maximum differential outputs for the differential Si ring resonators with different top cladding layers for ΔT = 4 °C are plotted. The measured scatter error for multiple measurements in the air clad is represented by symbol B (reproducibility under the same condition), and the measured data deviation with the temperature changes (from 25 to 29 °C) is expressed by symbol C. The theoretical calculation suggests that the differential operation is temperature independent.
Fig. 10. Comparison of integrated light output variations in different media at temperatures between 25 and 29 °C. The theoretical calculation for thermal change (for ΔT = 4 °C) is represent by symbol A and the value is placed in parentheses. The measured scatter error for multiple measurements in the air clad at 25 °C is expressed by symbol B. Multiple measured scatters for resist and oil were not observed. However, a similar scatter is expected for resist and oil because the scatter occurred for the measurement system error, and the measured data deviation with the temperature changes (from 25 to 29 °C) is expressed by symbol C.
Download figure:
Standard image High-resolution image
In our research, we targeted to detect a 1 ng/mL prostate specific antigen (PSA) as the practical level of sensitivity. We used various concentrations of sucrose solutions and converted the equivalent refractive index using Refs. 28 and 29. The sucrose solution of 10−2% concentration corresponds to 1 ng/mL PSA. The change in effective refractive index for 1 ng/mL PSA is equivalent to Δneff ≈ 1.7 × 10⁻⁵ (Ref. 20) and Δneff/neff is 6.5 × 10⁻⁶, which corresponds to the differential output of 0.186 from Fig. 3(a). This is in the linear region of this graph. As the differential output is in the linear region, output/Δλres could be constant even though the temperature increases.
5. Conclusions
The effects of temperature on Si-based biosensors are described in this paper. The effects of temperature on the resonance wavelength shift are dominated by the refractive index change of Si and these effects are sufficiently suppressed by the differential operation. This type of differential operation could also be applied to optical switching, modulation, and so on where thermal effects should be prevented.
Acknowledgement
This work was supported by a Grant-in-Aid for Scientific Research (B) (246360136, 2012) from the Ministry of Education, Culture, Sports, Science and Technology of Japan.