
Abstract
Plasma-activated water (PAW) is receiving much attention in biomedical applications because of its reported potent bactericidal properties. Reactive oxygen and nitrogen species (RONS) that are generated in water upon plasma exposure are thought to be the key components in PAW that destroy bacterial and cancer cells. In addition to developing applications for PAW, it is also necessary to better understand the RONS chemistry in PAW in order to tailor PAW to achieve a specific biological response. With this in mind, we previously developed a UV–vis spectroscopy method using an automated curve fitting routine to quantify the changes in H2O2, NO2−, NO3− (the major long-lived RONS in PAW), and O2 concentrations. A major advantage of UV–vis is that it can take multiple measurements during plasma activation. We used the UV–vis procedure to accurately quantify the changes in the concentrations of these RONS and O2 in PAW. However, we have not yet provided an in-depth commentary of how we perform the curve fitting procedure or its implications. Therefore, in this study, we provide greater detail of how we use the curve fitting routine to derive the RONS and O2 concentrations in PAW. PAW was generated by treatment with a helium plasma jet. In addition, we employ UV–vis to study how the plasma jet exposure time and treatment distance affect the RONS chemistry and amount of O2 dissolved in PAW. We show that the plasma jet exposure time principally affects the total RONS concentration, but not the relative ratios of RONS, whereas the treatment distance affects both the total RONS concentration and the relative RONS concentrations.
Export citation and abstract BibTeX RIS
1. Introduction
With the increasing concerns over the emergence of antibiotic-resistant bacterial strains in the healthcare and food industries, it is paramount to develop new innovative strategies that are more effective and efficient at combatting bacterial infections.1,2) Plasma-activated water (PAW) is being investigated for the treatment of bacterial contamination on food products3) and for medical applications.4) The procedure is simple: water is treated with an electrically generated atmospheric plasma discharge before it is applied to the target. Plasma-activated liquid (PAL) including PAW is bacteriostatic against a number of microorganisms.1–15) Its proposed high level of effectiveness in killing bacteria has earned it the nickname "water of death".10) PAL has a good shelf-life with a reported retention of its antibacterial activity from days to weeks7,15) to even years.16) Apart from water, plasma-treated aqueous buffer and cell culture media are being investigated for cancer therapy.17–20)
It is without question that the bacteriostatic activity of PAW and other aqueous plasma-treated solutions is predominantly governed by reactive oxygen and nitrogen species (RONS).21) RONS initially generated by plasma–air interactions in the gas phase subsequently dissolve into the solution. In addition, plasma treatment lowers the pH of the solution. RONS combined with an increased acidity of PAW are thought to act in synergy, providing a strong oxidative attack against bacteria.15) The reported high sensitivity of bacteria cells to PAW might arise from the higher surface area-to-volume ratio of these prokaryotic cells than of eukaryotic cells, which increases the RONS concentrations in these cells.22) Within bacteria, RONS can destroy the cell through increased oxidative stress5) or DNA damage.23) The main RONS in PAW that are thought to be responsible for its antimicrobial action are hydrogen peroxide (H2O2), nitrite (NO2−), and nitrate (NO3−).5) However, the plasma–liquid chemistry is much more complex than this, particularly at the plasma–liquid interface where many other (highly reactive) RONS are generated including the hydroxyl radical (OH ), nitric oxide radical (NO), superoxide anion radical (O2−), hydroperoxyl radical (HOO), nitric dioxide radical (N2O), singlet oxygen (1O2), and ozone (O3). The initial liquid chemistry generated by plasma treatment may strongly affect the longer-term chemistry and antimicrobial property of PAW. Therefore, it is important to monitor and control the plasma and liquid chemistries of PAW in order to achieve desired processing outcomes for specific biological or medical applications. For a comprehensive account of plasma–liquid interactions, the reader is referred to the "Topical Review" and "Review and Roadmap" by Bruggeman and coworkers.24,25)
Plasma discharge chemistry has been studied in detail,26–28) and is thought to significantly affect the resultant chemistry of PAW. Electron spin resonance (ESR) has been employed to measure short-lived (highly reactive) RONS in PAW.29) Other techniques are more broadly utilized for the measurement of longer-lived RONS (such as H2O2, NO2−, and NO3−) and include the use of dyes that react with RONS to give colorimetric or fluorescent signals that can be quickly measured on a plate reader or under a microscope.30,31) We have found that UV–vis spectroscopy is a relatively simple and cost-effective technique for the measurement of the longer-lived RONS concentrations of PAW, with the added advantage of being able to perform multiple measurements during plasma treatment.32) We have recently shown that we can curve-fit the UV–vis spectrum to derive the RONS concentrations in PAW with good accuracy, reproducibility and sensitivity.33,34) However, we have yet to explain the curve fitting procedure in detail.
In this paper, we provide a detailed study of UV–vis spectroscopy for analyzing the concentrations of longer-lived RONS (H2O2, NO3−, and NO2−) and molecular oxygen (O2) in PAW. We explain how the curve fitting procedure is performed to derive the RONS and O2 concentrations in PAW, and how the plasma exposure time and treatment distance affect these concentrations.
2. Experimental methods
2.1. Helium plasma jet
A dielectric barrier discharge (DBD) helium plasma jet was used (see Fig. 1).35–38) The plasma jet apparatus consisted of a 150-mm-long glass tube with a 3.7 mm inner diameter and was slightly tapered at the nozzle. Helium gas was fed into the glass tube at a fixed gas flow rate of 3 slpm through a flowmeter controller (FCON 1000). A high-voltage bipolar square pulse of 7 kV (peak to peak) at 10 kHz was applied to a metallic external electrode. The high voltage and discharge current were measured as previously reported,26,28,39,40) employing a high-voltage probe (Tektronix P6015A) and a conventional current monitor (Pearson 2877), respectively. Figure 2 shows the bipolar high voltage and discharge current waveforms. Positive and negative current pulses per period were detected. A peak discharge current of 1.68 mA was measured for the positive current pulse with a pulse width of ∼5 µs, while −0.88 mA was measured for the negative pulse current with a relatively broad pulse width of ∼9 µs. The peak and average input powers (Pin) were 4.18 and 0.41 W, respectively, calculated using

where T is the time for half a period (50 µs), V is the applied voltage, and ID is the discharge current. Both V and ID are time-dependent.

Fig. 1. Experimental setup of the He plasma jet used to prepare PAW, and the location where the voltage and current were measured.
Download figure:
Standard image High-resolution image
Fig. 2. Voltage and discharge current waveforms for the He plasma jet.
Download figure:
Standard image High-resolution image2.2. Plasma-activated water
Deionized water (DI water) (18.2 MΩ·cm at 25 °C) was obtained from a Millipore Direct-Q 3UV system. 500 mL of DI water was stored in a container in ambient atmosphere for one day. This storage procedure enabled the concentrations of dissolved gases within the DI water to equilibrate with the air, which ensured that the concentrations of dissolved gases were constant between experiments. For the plasma treatment, 3 mL of DI water was transferred to a 60-mm-diameter petri dish. Exposure time and treatment distance were varied up to 30 min and 80 mm, respectively.
2.3. UV–vis spectroscopy
Double-beam UV–vis–NIR spectrophotometers (Hitachi U-4100 and U-3900) were used in the transmittance measurement mode. The U-4100 model was for the measurement of a broad wavelength range from 200 to 2500 nm; the U-3900 model was used for shorter wavelength measurements up to 190 nm over a narrower range of 800 nm. The spectrophotometers were operated with a fixed spectral resolution of 0.2 nm and a fixed scan speed of 120 nm/min. Measurements were performed in quartz cuvettes (Hellma Analytics QS-101). The quartz cuvette guaranteed a high transmittance of over 87% on average over the whole visible and near-infrared wavelength ranges. At the shortest wavelength of 190 nm, the transmittance was 82% through the quartz cuvette. The optical path of light through the cuvette (l) was 10 mm.
The measurements presented in this study are sensitive to fluctuations in the intensity of the light from the lamp of the spectrophotometer. Thus, we measured background transmittance T(λ), recorded using empty cuvettes in both the reference I0(λ) and sample I(λ) analysis chambers, to account for fluctuations in the intensity of the light sources of the spectrophotometers:

Next, the transmittances of DI water and PAW were measured in the sample analysis chamber with the empty cuvette as reference. The transmittance spectra of untreated DI water (T) and PAW (T') were converted into absorbance using

All UV–vis measurements were taken 5 min after the preparation of PAW. Owing to their short half-life of less than 1 s, the highly reactive molecules generated by atmospheric plasma in water, such as the OH, peroxynitrite (ONOO−), and other radicals, were expected to be extinguished in PAW before measurement. The longer-lived molecules such as H2O2, NO2−, and NO3− will remain in PAW at stable concentrations owing to their much longer half-life; previously, these RONS were detected in PAW even days after plasma treatment.7)
3. Results and discussion
3.1. Transmittance of PAW
In Fig. 3, the transmittances for DI water and PAW (plasma exposure time = 30 min; treatment distance = 15 mm) were measured using the U-4100 spectrophotometer over a wavelength range of 200–2500 nm. The UV–vis–NIR spectra were almost identical in the range of 340–2500 nm. Below 340 nm, the spectra were different. This difference is due to the concentrations of RONS and O2 in PAW being different from those in DI water. Therefore, our subsequent measurements using the U-3900 model spectrophotometer focused on shorter wavelengths.

Fig. 3. UV transmittance of PAW and DI water over a wavelength range of 200–2500 nm. Measurements were taken with a UV–vis–NIR spectrophotometer (Hitachi U-4100). It is clearly seen that the transmittance of PAW is lower at wavelengths below 300 nm.
Download figure:
Standard image High-resolution image3.2. Effect of exposure time on total RONS and O2 concentrations
Figure 4(a) shows typical spectra of PAW prepared with plasma exposure times of 10, 20, and 30 min at a fixed treatment distance of 25 mm. As expected, the intensity of the absorption spectra increased with increasing plasma exposure time. The profiles were similar but not identical. On closer inspection of the spectra, the central peak position slightly shifted from 205.8 nm after 10 min of plasma exposure to shorter wavelengths after prolonged plasma exposure (203.6 nm at 20 min and 203.0 nm at 30 min). In addition, the width (FWHM) of the peaks slightly varied from 31 nm at 10 min to 30 nm at 20 min and 36 nm at 30 min. These small differences in peak profiles indicate that not only did the concentration of RONS and O2 change with plasma exposure, but so did the composition of RONS in PAW. The concentrations of RONS and O2 were determined from the spectra using the Beer–Lambert law,

where ε is the molar absorptivity of the chemical species at a certain wavelength λ, l is the optical path length, and c is the concentration of RONS and O2.

Download figure:
Standard image High-resolution image
Fig. 4. (a) Typical UV–vis spectra between 190–340 nm of PAW prepared using different plasma exposure times. Treatment distance was fixed at 25 mm. The absorption peak shifted slightly from 205.8 nm after 10 min to 203.6 nm after 20 min and to 203.0 nm after 30 min. (b) Total UV–vis absorbance plotted as a function of plasma exposure time.
Download figure:
Standard image High-resolution imageAssuming that the total absorbance in the UV–vis spectra corresponds to the total RONS and O2 concentrations, we suggest that the total RONS and O2 concentration is equal to the total absorbance range of 190–340 nm. This wavelength range takes into consideration the peak shifts and the increase in the FWHM in PAW after prolonged plasma exposure. Therefore, the total RONS and O2 concentration in PAW can be calculated according to the following equation:32)

Using this equation, we plotted the total RONS and O2 concentration in PAW following plasma exposure times of 1 to 30 min at a fixed treatment distance of 25 mm. Under these parameters, it is seen in Fig. 4(b) that the total RONS and O2 concentration increased linearly as a function of plasma exposure time. Although the total RONS and O2 concentration increased linearly, the relative concentration ratio of  changed with treatment time. This is because the neutral helium gas flow during plasma treatment purges O2 out of the DI water at the initial stages of treatment (up to 5 min) before the O2 concentration begins to increase, whilst the plasma always increases the RONS concentration. Despite a decrease in the O2 concentration in DI water, a linear increase is still seen in the total RONS and O2 concentration in Fig. 4(b) because O2 does not affect the total absorbance as much as RONS.41)
3.3. Effect of treatment distance on total RONS and O2 concentration
The plasma-induced aqueous liquid chemistry has been shown to be sensitive to small (mm) changes in treatment distance, i.e., the distance between the plasma jet nozzle and the surface of the target solution.40) In this study, we further investigated how the treatment distance influences the plasma jet generation of RONS and O2 in DI water. The treatment distance was varied from 15 to 80 mm. Figure 5(a) shows the typical absorption spectra of PAW prepared using treatment distances of 15 mm (plasma plume in contact with the surface of the DI water), 25 mm (plasma plume not in contact but in close proximity to the DI water), and at a much larger distance of 80 mm (no contact, remote) for a fixed exposure time of 5 min. The intensity of the absorbance peak was highest in PAW prepared at 25 mm with a lower absorbance peak at 15 mm and the lowest at 80 mm. This indicates a nonlinear correlation between the total RONS and O2 concentration in PAW and the treatment distance. The profile of the UV–vis absorption spectra were similar, but not identical. The central peak position shifted: 206.6 nm at 15 mm, 206.2 nm at 25 mm, and 206.8 nm at 80 mm. This indicates that the concentration of RONS and O2 in PAW is influenced by treatment distance. We have identified four possible contributing factors to explain this.

Download figure:
Standard image High-resolution image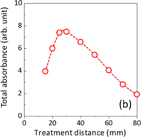
Fig. 5. (a) Typical UV–vis spectra at 190–340 nm of PAW prepared at different treatment distances. Exposure time was fixed at 5 min. The absorption peak shifted from 206.6 nm at 15 mm to 206.2 nm at 25 mm and to 206.8 nm at 80 mm. (b) Total UV–vis absorbance plotted as a function of treatment distance.
Download figure:
Standard image High-resolution image- (1)There is an increase in mixing of the plasma effluent with ambient air at longer treatment distances that changes the RONS chemistry in the gas phase — Ito et al. showed that gas mixing enhances the plasma generation of NO2− in DI water.42)
- (2)Closer treatment distances result in a greater level of evaporation creating a more humid atmosphere that may affect the RONS concentration — e.g., Winter et al. showed that the Ar plasma jet generation of H2O2 in solution significantly increases with humidity.43)
- (3)A higher gas velocity impinging on the surface of the DI water at shorter treatment distances will significantly deoxygenate the DI water. This is due to the inert gas from the plasma jet purging dissolved O2 in a process referred to as "sparging".41)
- (4)Evaporation decreases the temperature of the DI water, which changes the solubilities of RONS and O2.44)
Figure 5(b) shows the total absorbance (total RONS and O2 concentration) plotted as a function of treatment distance. The trend follows a parabolic relationship: the absorbance increased between 15 and 30 mm and then decreased from 30 to 80 mm. This trend can be explained by the different processes occurring at different treatment distances (as discussed directly above), which affect the plasma generation of RONS and O2 in the DI water. However, in addition to enhanced mixing of the plasma effluent with ambient air at longer treatment distances, we also consider that moving the plasma jet (relative to the DI water surface) changes the solubility of RONS. Norberg et al.45) showed in their computational study that the concentrations of dissolved charged species and certain neutral RONS increase when the plasma is in contact with the water surface.
3.4. RONS UV–vis spectra profiles
In order to quantify the concentrations of RONS and O2 in PAW, it is necessary to perform a curve fitting routine to derive the contributions of the different RONS and O2 to the UV–vis spectra. We have shown that the reference spectra of RONS and O2 can be used to accurately and reproducibly curve-fit the UV–vis spectra of plasma-treated DI water.34) Since the accuracy of the reference spectra significantly affects the accuracy of the curve fitting routine, we compared our reference spectra of H2O2, NO2−, and NO3− to the reference spectra kindly provided by Professors Katsuhisa Kitano (Osaka University) and Petr Lukeš (Institute of Plasma Physics CAS).46) The results are shown Figs. 6(a)–6(c). The spectra of H2O2, NO2−, and NO3− in our work are in very good agreement with the spectra provided by Kitano and Lukeš. The peak of H2O2 is not shown in the graph because it is outside the wavelength range of the spectrophotometers — it was measured to be at 160 nm.47,48) In addition, our earlier reports have shown that plasma treatment also changes the O2 concentration in DI water.33,34,49) Therefore, in order to curve-fit the changes in O2 concentration, we obtained the reference spectrum of O2 in Fig. 6(d). The absorption spectrum and concentration of O2 were obtained by purging with He, as previously described.33) We were unable to find other O2 spectra with which to compare our reference spectrum.

Fig. 6. Our UV–vis absorption reference spectra for (a) H2O2, (b) NO2−, and (c) NO3− with reference spectra provided by Kitano and Lukes (private communications). (d) Reference spectra of O2 in DI water taken after purging with He gas. Blue curves indicate our own spectra; red open circles (Refs.) are reference spectra provided by Kitano and Lukes.
Download figure:
Standard image High-resolution imageWe further investigated how the concentrations of H2O2, NO2−, and NO3− might affect the UV–vis spectra (see Figs. S1–S3 in the online supplementary data at http://stacks.iop.org/JJAP/57/0102B9/mmedia). The concentrations of these RONS were varied: H2O2, 9.65–9666 mg/L; NO2−, 1.66–1000 mg/L; and NO3−, 2.5–10000 mg/L. The central peak of H2O2 was below 190 nm [Fig. S1(a) in the online supplementary data at http://stacks.iop.org/JJAP/57/0102B9/mmedia]. Therefore, we used the intensity of the peak position at the shortest wavelength of 190 nm to investigate how changes in H2O2 concentration affect the UV–vis absorption. The absorbance increased linearly as a function of increasing H2O2 concentration [Fig. S1(b) in the online supplementary data at http://stacks.iop.org/JJAP/57/0102B9/mmedia]. For NO2−, the major peaks were observed at 209.8 nm (for lower concentrations of up to 33.2 mg/L) and at 354 nm (for higher concentrations of over 66.5 mg/L) [Fig. S2(a) in the online supplementary data at http://stacks.iop.org/JJAP/57/0102B9/mmedia]. The intensities of both absorption peaks at 209.8 and 354 nm increased linearly as functions of increasing concentration [Fig. S2(b) in the online supplementary data at http://stacks.iop.org/JJAP/57/0102B9/mmedia]. For NO3−, we observed an absorption peak at 200.6 nm corresponding to the π–π* electron transition up to 10 mg/L. Higher concentrations resulted in absorbances above the detection limit of the spectrophotometer. A peak at 302 nm (corresponding to the n–π electronic transition) emerged at higher concentrations of over 66.6 mg/L [Fig. S3(a) in the online supplementary data at http://stacks.iop.org/JJAP/57/0102B9/mmedia]. The intensities of both absorption peaks at 200.6 and 302 nm increased linearly as functions of increasing concentration [Fig. S3(b) in the online supplementary data at http://stacks.iop.org/JJAP/57/0102B9/mmedia]. For O2, we only compared the spectra between DI water equilibrated with ambient air (cf. 8 mg/L) and 100% deoxygenated DI water.33)
On the basis of the above measurements with the three reference solutions of H2O2, NO2−, and NO3−, we determined a linear relationship between peak intensity and RONS concentration. This linear relationship was observed at any given wavelength. However, in PAW, it is difficult to accurately use the UV–vis spectra over the entire wavelength range. The reason for this is that, at low RONS concentrations, the intensity of the UV–vis spectra is too low (below the noise level) at long wavelengths. On the other hand, at high RONS concentrations, short wavelengths are not suitable because the intensity over this range is too high (above the detector saturation level). Therefore, we used the intensity measurements taken at both long and short wavelengths to determine the RONS concentration in PAW.
3.5. Absolute concentration of plasma-generated RONS and O2 in PAW
Using the reference spectra of H2O2, NO2−, NO3−, and O2, we curve-fitted the experimentally obtained UV–vis spectra of PAW by the following steps.
- (1)The spectrum tail above 245 nm is first fitted with the reference H2O2 spectrum [Fig. 7(a)].
- (2)The absorption shoulder between 230 and 240 nm is fitted with the reference NO2− spectrum [Fig. 7(b)].
- (3)The peak between 200 and 210 nm is fitted using the NO3− reference spectrum [Fig. 7(c)].
- (4)The peak below 200 nm is fitted with the reference spectrum of dissolved O2 [Fig. 7(d)].

Fig. 7. Overview of the UV–vis curve fitting procedure. (a) The spectrum tail over 245 nm is first fitted with the reference H2O2 spectrum. (b) The absorption shoulder between 230 and 240 nm is fitted with the reference NO2− spectrum. (c) The peak between 200 to 210 nm is fitted using the NO3− reference spectrum. (d) The peak below 200 nm is fitted with the reference spectrum for dissolved O2. PAW was prepared at a plasma exposure time of 20 min and a treatment distance of 25 mm.
Download figure:
Standard image High-resolution imageThe curve-fitting procedure for PAW prepared with 20 min of plasma treatment is relatively simple to fit. However, the method is too time-consuming for analyzing large datasets. Therefore, we developed an automated curve fitting program at Kochi University of Technology (Jun-Seok Oh and Akimitsu Hatta). This automated curve fitting program simultaneously calculates the concentrations of H2O2, NO2−, NO3−, and O2 at four different wavelengths using a 4 × 4 matrix data structure.
The absorbance at the wavelength λ for molecule X is given by

When four different molecules (A, B, C, and D) contribute to the absorption spectra, the total absorbance per unit optical path length is given as the total sum of absorptivity multiplied by the concentration:

Here, we chose four different wavelengths, λ1 to λ4, where the ratios between the absorptivity differed markedly for each molecule. The total absorbance at a given wavelength was defined as the product between the matrix for absorptivity and the vector for concentration as
From the measured Abs(λ), the concentrations were directly determined using the inverse matrix for absorptivity:
To improve the signal-to-noise ratio, instead of using four points at specific wavelengths, four different wavelength ranges were used to determine the absorbance and absorptivity. After calculating the concentration of each type of molecule, the correctness of the fitted curve was monitored by comparing the difference between the experimental data and the theoretical data obtained using Eq. (7).
In Sects. 3.5.1 and 3.5.2, we utilized the automated curve fitting routine to analyze how the RONS and O2 composition changes depending on the exposure time and treatment distance.
3.5.1. Influence of exposure time.
Figure 8 shows the curve fitting results of PAW for plasma exposure times of 1, 10, and 30 min. After 1 min, a prominent negative absorbance was observed below 195 nm. The reduced absorbance is attributed to a reduced concentration of dissolved O2 caused by the inert He gas of the plasma jet purging the DI water. When we took into account the He purging effect into the absorption spectra of PAW,33) the simulated curve was fitted with very good agreement with the measured spectrum, as shown in Fig. 8(a). (See Fig. S4 in the online supplementary data at http://stacks.iop.org/JJAP/57/0102B9/mmedia without consideration of O2 in supporting information. This results in a poor curve fit. Therefore, we always fit the shorter wavelength region with O2.) From the curve fitting results, we determined that the major RONS (for the specific RONS measured in this study) produced by the plasma jet was H2O2 at 0.132 mg/L with NO2− at 0.097 mg/L and NO3− at 0.021 mg/L, which are much lower concentrations. The O2 concentration was 5.28 mg/L. Figure 8(b) shows the measured absorption spectrum and curve fitting results after 10 min of plasma exposure. The intensity of the spectrum significantly increased, corresponding to an increase in the RONS concentrations (H2O2: 1.132 mg/L; NO2−: 0.752 mg/L; NO3−: 0.208 mg/L) and a further decrease in the O2 concentration to 3.670 mg/L. In Fig. 8(c), the intensity of the peak tripled, which directly corresponded to an increase in plasma exposure time from 10 to 30 min. Apart from the difference in the intensity, the 10 and 30 min spectra were identical. The change in the peak intensity corresponded to marked increases in each of the RONS concentrations, as determined by the curve fitting routine (H2O2: 3.429 mg/L; NO2−: 1.689 mg/L; NO3−: 0.787 mg/L). At 30 min, the O2 concentration was higher at 5.52 mg/L; this increase is presumably due to the conversion of some of the plasma-generated RONS to O2.
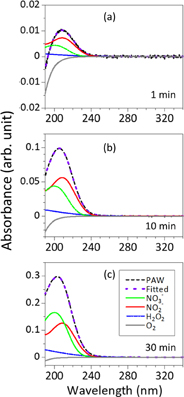
Fig. 8. Curve fitting results of NO3−, NO2−, H2O2, and O2 of the UV–vis spectra for PAW with various plasma exposure times. The plasma exposure times were (a) 1, (b) 15, and (c) 30 min at a fixed treated distance of 25 mm.
Download figure:
Standard image High-resolution imageThe trends in the changes in RONS and O2 concentrations as functions of plasma exposure time are summarized in Fig. 9. The plasma exposure time was varied from 1 to 30 min at a fixed distance of 25 mm. The RONS concentration increased linearly (R2 = 0.9992) as a function of plasma exposure time. The H2O2 concentration always remained higher than the NO2− and NO3− concentrations. Conversely, the O2 concentration decreased as a function of plasma exposure time up to 5 min, but it increased after that time point, presumably owing to the formation of O2 by-products from the chemical reactions of the plasma-generated RONS in the DI water. The results show that the RONS concentrations (i.e., concentrations of H2O2, NO2−, and NO3−) could be adjusted by simply varying the plasma exposure time without significantly affecting the RONS composition of PAW (i.e., the concentration ratio of  ).
).

Fig. 9. Absolute concentrations of NO3−, NO2−, H2O2, and O2 in PAW as functions of plasma exposure time at a fixed distance of 25 mm.
Download figure:
Standard image High-resolution image3.5.2. Dependence of treatment distance on RONS and O2 concentrations.
Figure 10 shows a summary of the curve fitting results for treatment distances of 15, 25, and 80 mm with a fixed exposure time of 5 min. In Fig. 10(a) for the distance of 15 mm (plasma in contact with DI water), the concentrations of H2O2, NO2−, and NO3− were 0.377, 0.220, and 0.055 mg/L, respectively. At 25 mm (plasma not in contact with the DI water), as shown in Fig. 10(b), the H2O2, NO2−, and NO3− concentrations were significantly higher at 0.550, 0.421, and 0.094 mg/L, respectively. At the farthest distance of 80 mm shown in Fig. 10(c), the concentrations of all RONS were lower: H2O2, 0.126 mg/L; NO2−, 0.130 mg/L; and NO3−, 0.012 mg/L. At 15 mm, the O2 concentration was 5.02 mg/L. The lowest O2 concentration of 3.55 mg/L was measured at 25 mm. However, a higher O2 concentration of 7.44 mg/L was measured at 80 mm. The O2 concentration was higher in PAW prepared at 15 mm than in PAW prepared at 25 mm because He gas purging of the DI water was not as effective at the shorter treatment distance. This is because the contact area of the He gas with the surface of the DI water increases up to a treatment distance of 35 mm, as shown by the Schlieren images in Fig. S5 in the online supplementary data at http://stacks.iop.org/JJAP/57/0102B9/mmedia.

Fig. 10. Curve fitting results for NO3−, NO2−, H2O2, and O2 of the UV–vis spectra of PAW with various treatment distances of (a) 15, (b) 25, and (c) 80 mm at a fixed exposure time of 5 min.
Download figure:
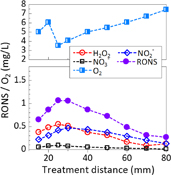
Standard image High-resolution imageThe RONS concentrations are plotted as a function of treatment distance from 15 to 80 mm in Fig. 11. We see that the RONS chemistry is tunable by simply changing the treatment distance. At closer treatment distances of 15–30 mm, the concentration of H2O2 far exceeds those of NO2− and NO3−. At 40–80 mm, the concentration of NO2− is higher than that of H2O2. The NO3− concentration was always lower than the H2O2 and NO2− concentrations.
Fig. 11. Absolute concentrations of NO3−, NO2−, H2O2, and O2 in PAW as functions of plasma treatment distance at a fixed exposure time of 5 min.
Download figure:
Standard image High-resolution image
Overall, the results show that the treatment distance affects not only the RONS (H2O2, NO3−, and NO2−) concentration but also the concentration ratio of these RONS. Although we have no direct evidence of the effect of treatment distance on the RONS composition, we can make reasonable assumptions on the basis of what we know from the literature. Firstly, H2O2 is the major RONS at closer distances of up to 30 mm. At such closer treatment distances, the rate of water evaporation is higher, creating a more humid environment. Humidity is known to significantly enhance the plasma jet generation of H2O2 in aqueous solution.43) We also expect that treatment at closer distances with the plasma jet in contact with the liquid surface will enhance the generation of ROS, including aqueous OH and H2O2.50) In addition to diffusion and solvation processes, OH can also be formed in the DI water through UV photolysis.43,51,52) Recombination of OH can lead to further generation of H2O2 in the water via the following reaction:13)

We expect the contributions of humidity and UV photolysis to decrease as the treatment distance increases. At longer treatment distances, there will be more mixing and reactions of the plasma effluent with ambient air before the solvation of RONS into the water. Since air comprises mainly N2, we speculate that the generation of RNS is favored. Therefore, we see higher proportions of NO2− and NO3− and a concomitant decrease in the H2O2 concentration.
However, the concentration of NO3− peaked at a treatment distance of 25 mm compared with that of NO2− at 30 mm. We once again attribute this to greater humidity at the closer treatment distance. Humidity may also be an important parameter for the plasma jet generation of NO3−, as shown in the following reactions:13)


In addition, a higher concentration of H2O2 generated at closer treatment distances might also facilitate the generation of NO3− and the consumption of NO2− via13)


At longer treatment distances of >30 mm, the concentrations of all RONS decrease.
4. Conclusions and future directions
We described in detail a UV–vis spectroscopy method and a curve fitting routine for studying the chemistry of long-lived RONS (H2O2, NO2−, and NO3−) and O2 in PAW. PAW was generated by the treatment of water with a helium plasma jet. Two treatment parameters were varied: plasma jet exposure time and treatment distance. Both parameters significantly affected the RONS concentration. In addition, the RONS composition changed with treatment distance for the experimental parameters used in this study. Closer treatment distances favored the formation of H2O2, whereas longer treatment distances of up to 30 mm favored the formation of NO2− and NO3−. Therefore, in the future, it should be possible to tailor the RONS composition of PAW for specific applications simply by adjusting the treatment distance.
Acknowledgments
This work is mainly supported by a Priority Research Grant (2013–2015) of Kochi University of Technology. JSO acknowledges a JSPS KAKENHI Grant Number JP17K05099. JSO and MI acknowledge the MEXT-Supported Program for the Strategic Research Foundation at Private Universities (S1511021) and a project for Promoting Research Center in Meijo University. EJS and RDS acknowledge the support of the Australian Research Council through the Discovery Project DP16010498. All the authors thank Mr. Kodai Sakuramoto and Miss Satsuki Ito for their contribution of the reference absorption spectra of H2O2, NO2−, and NO3−.
Biographies

Jun-Seok Oh received his B.S. and M.S. degrees from Kwangwoon University, Seoul, Korea, in 2001 and 2003, respectively. He joined the International Doctoral Program in Engineering in October 2003 and received his Ph.D. degree from Kyoto University, Kyoto, Japan, in November 2006. In May 2016, he joined Meijo University. His current research interests are in the development of new atmospheric-pressure plasma technology based on optical and electrical plasma diagnostic techniques. Recently, he has become interested in plasma biomedical applications. He is a member of the Japan Society of Applied Physics and a member of the Institute of Physics, UK.

Endre J. Szili is a Research Fellow at the Future Industries Institute, University of South Australia. He completed his Bachelor of Biotechnology (Honours) and Ph.D. in chemistry (Dec 2008) at Flinders University. He is interested in plasma medical sciences, particularly, more detailed knowledge of the mechanisms of plasma in biology and medicine. He is applying this fundamental knowledge to the development of new plasma treatment methods for wound healing and cancer therapy. He is serving as an Associate Editor for IEEE Transactions in Radiation and Plasma Medical Sciences, he is also part of the Editorial Board for Journal of Physics Communications.

Kotaro Ogawa received his B.E. degree in 2017 from the School of Systems Engineering, Kochi University of Technology, where he is now working toward his M.E. degree. He is currently investigating the chemical composition of atmospheric-pressure plasma-jet-activated water using UV absorption spectroscopy.

Robert D. Short studied Chemistry (B.Sc.) and Physical Chemistry (Ph.D.) at the University of Durham, UK, and joined the University of Sheffield in 1988, where, from 2001 until joining the University of South Australia (UniSA) in 2006, he held the Chair of Material and Biomaterial Chemistry. During this period, he was a founding director of two spin-out companies, CellTran Ltd. and Plasso Technology. At UniSA, he has held the positions (2006–2015) of Director of the Mawson (Research) Institute, Dean of Research of Science and Engineering, and Pro Vice Chancellor of Science and Engineering. In August 2016, he took up the new role of Director of the Material Science Institute at Lancaster University (UK), whilst retaining a research group in Australia. Over the past 20 years, he has published over 200 peer-reviewed articles, and won and managed research grants exceeding A$200M. In 1992, he was awarded the CR Burch Prize (IOP, RSC, UK) for outstanding work in Physical Chemistry for Thin Films or Vacuum. In 2004, he was awarded the UK Society for Biomaterials' second highest prize, the Biocompatibles Endowed Lecture (for midcareer achievement). In 2013, he was elected a Fellow of the Australian Academy of Technological Sciences and Engineering (FTSE).

Masafumi Ito received his B.E., M.E., and Ph.D. degrees in electronic mechanical engineering from Nagoya University, Nagoya, Japan, in 1986, 1988, and 1992, respectively. In 1991–1997, he belonged to the Department of Electronic Information Engineering and Quantum Engineering of Nagoya University as a research associate and an assistant professor, studying laser sensing and plasma diagnostics. In 1997–2009, he belonged to the Department of Opto-mechatronics of Wakayama University as an associate professor and a full professor, studying optical sensing systems for controlling plasma and plasma inactivation of spores. Since 2009, he has been with the Department of Electrical and Electronic Engineering of Meijo University, Nagoya, Japan. His current research interests are in plasma bioapplications and basics and optical sensing. He is a member of the Japan Society of Applied Physics, the Institute of Electrical Engineers of Japan, and the Optical Society of Japan.

Hiroshi Furuta received his Ph.D. degree in Science (Physics) from Osaka University, Osaka, Japan, in 1999. In 1998, he was a Japan Society for the Promotion of Science Research Fellow engaged in research on porous silicon and ESR applications. In 2001, he was a New Energy and Industrial Technology Development Organization Fellow engaged in research on carbon nanotubes with Frontier Carbon Technologies, Tokyo, Japan. In 2002, he was with Nitta Haas, Tokyo, developing CNT applications. In 2004, he was a lecturer with the Research Institute for Nanodevices, Kochi University of Technology, and he became an associate professor in the Department of Electronic and Photonic Systems Engineering in 2011. Since 2002, he has been involved in the research and development of low-temperature insulator and CNT applications. His current research interests are in the application of carbon nanotubes, the growth process of carbon nanomaterials, the plasma process for thin-film technology, and metamaterials. He is a member of the Japan Society of Applied Physics.

Akimitsu Hatta received his B.E. and M.E. degrees from Kyoto University, Kyoto, Japan, in 1987 and 1989, respectively, and his Ph.D. degree in Engineering from Osaka University, Osaka, Japan, in 1996. He completed his Ph.D. program coursework at Kyoto University in 1992. From 1992 to 1998, he was an assistant professor in the Department of Electrical Engineering, Osaka University. In 1998, he became an associate professor with the Department of Electronic and Photonic Systems Engineering, Kochi University of Technology (KUT), Kochi, Japan, and a full professor in 2003. In 2015, he became the Dean of the Graduate School of Engineering, KUT, and the Chair of the Center for Nanotechnology of the Research Institute, KUT. He has been involved in Energy and Environmental Education. His current research interests are in gas discharge and plasma application to material syntheses, ultraviolet light sources, and spectroscopic analysis. He is a member of the Japan Society of Applied Physics, the Institute of Electrical Engineering of Japan, the Illuminating Engineering Institute of Japan, the Institute of Electrostatics Japan, and the Japan Association of Energy and Environmental Education.