

Abstract
Stable structures of polar, nonpolar, and semipolar GaN surfaces undergoing oxide vapor phase epitaxy (OVPE) growth were examined with first-principles calculations. The relationships between temperature and pressure growth conditions and stable surface structures are described in surface phase diagrams. The results revealed that an O atom was stably incorporated into the N vacancy site in the N-polar and nonpolar surfaces. The desorption energy of the O atom from the GaN surfaces was estimated to be about 7 eV or higher. This indicates that the O atom did not readily desorb from the GaN surfaces under OVPE growth conditions at 1500 K. The desorption energy from the  surface was the highest and that from the
  surface was the smallest among the calculated values. There was no significant difference in desorption energy among other surfaces.
Export citation and abstract BibTeX RIS
1. Introduction
Oxide vapor phase epitaxy (OVPE) is used for growing bulk GaN crystals because solid by-products that disturb prolonged continuous crystal growth do not form.1–9) However, OVPE-grown GaN crystals have not yet approached the growth rate and crystal quality achieved with hydride vapor phase epitaxy (HVPE).10,11) The growth rate and dislocation density of OVPE-grown GaN are typically ∼180 µm/h5) and ∼1 × 107 cm−2,4) respectively. In addition, high oxygen concentrations, such as ∼1 × 10¹⁸ atoms/cm3,4) are a major problem. However, recent OVPE growth techniques have greatly improved. For example, Yamaguchi et al. reported a growth rate of 232 µm/h, and the crystal quality was improved by modification of how to synthesize Ga2O gas.8)
Details of GaN growth during OVPE, such as crystal surface structure, chemical reactions in the gas phase and near the crystal surface, and impurity incorporation, have not been investigated. Knowledge of stable surface structures is important when examining crystal growth. Therefore, stable GaN surface structures during OVPE growth were investigated here by first-principles calculations.
GaN growth by OVPE has generally been performed on the Ga-polar (0001) surface, although growth on the N-polar  and the nonpolar
  surfaces have also been attempted.7,9) Other surfaces appearing during crystal growth are the semipolar
  and
and  surfaces.9) We calculated the structures of the polar (0001) and
  surfaces previously, and we found that OH groups adsorbed on the topmost Ga atoms on the (0001) surface and O atoms adsorbed on Ga atoms or were incorporated into the Ga monolayer on the
  surface.12)
We carried out the above investigation assuming that there are numerous O impurities (O atom, OH group, and H2O molecule) near the crystal surface because GaN is formed by the reaction Ga2O(g) + 2NH3(g) → 2GaN(s) + H2O(g) + 2H2(g), and many molecules that include O atoms exist in the growth environment. However, we need to pay attention to the experimental finding that the O impurity concentration decreases with increasing H2 gas pressure.4) Oxygen impurities may be removed by reduction with H2 gas. Considering that the OH group becomes H2O by the reduction reaction and it desorbs from the GaN surfaces, adsorption of the OH group may not markedly affect the incorporation of O impurities. Instead, we need to examine the adsorption of O atoms on the GaN surfaces. In addition, we have investigated the adsorption of the O impurities basically on an ideal surface; however, incorporation of O atoms into N vacancy sites also needs to be examined because an O atom is typically incorporated into N sites.13)
In this study, stable structures of the polar (0001) and  , nonpolar
  and
and  , and semipolar
  and
and  GaN surfaces during OVPE growth were investigated with first-principles calculations. We calculated about 40 surface structures of each surface orientation. Here, we assumed that an O atom was adsorbed on the crystal surfaces or was incorporated into a N vacancy site in the topmost layer because this made comparison of the stability of O-incorporated surface structures easier. Surface phase diagrams show the relationships of stable surface structures with growth temperature and Ga pressure. We also estimated the desorption energy of an O atom from the GaN surfaces and discuss the surface orientation dependence of O impurity incorporation.
2. Simulation methods
2.1. First-principles calculations
The first-principles molecular dynamics simulation program STATE-Senri,14) based on density functional theory with norm-conserving/ultrasoft pseudopotentials and a plane-wave basis set, was used to calculate the total energies of surface structures and isolated atoms or molecules. Ultrasoft pseudopotentials were used for the H 1s and O 2p states, while norm-conserving pseudopotentials were used for other states. The cutoff energies for the wave functions and charge densities were 64 and 400 Ry, respectively. The generalized gradient approximation by Perdew et al. for the exchange–correlation function was used.15)
2.2. Simulation models
We used slab models of the polar, nonpolar, and semipolar GaN surfaces. They consisted of four bilayers of the wurtzite structure and a 15 Å vacuum region. The Ga and N atoms in the bottom surface of the slabs were terminated by pseudo-hydrogen atoms with atomic numbers of 1.25 and 0.75, respectively.16) For the polar GaN surface models, the surface area of the Ga monolayer and Ga bilayer models was about 9.5 × 5.5 Å2 (3 × 1 unit cells), and the surface area of the other models was about 6.3 × 5.5 Å2 (2 × 1 unit cells). Figures 1 and 2 show examples of the structures of the polar surfaces. These figures were generated using the visualization program XCrysDen.17) The surface areas of the nonpolar  and
and  models were about 11.0 × 5.1 Å2 (2 × 1 unit cells) and 6.3 × 10.2 Å2 (2 × 2 unit cells), respectively, and that of the semipolar
  and
and  models was about 6.3 × 11.6 Å2 (2 × 1 unit cells). Examples of the nonpolar surface structures are shown in Fig. 3. Structures of the semipolar surfaces are shown in Figs. 4 and 5. The topmost layer of the
  and
and  surfaces consists of N and Ga atoms, and they were N-polar and Ga-polar, respectively, in semipolar surfaces. Either atoms or molecules composed of Ga, N, H, and O atoms were adsorbed on top of the slab models. For example, the O_ad+H model in Fig. 1 had an O atom and a H atom adsorbed on the topmost Ga atoms. When we examined the
  ,
,  ,
,  , and
, and  surfaces, we constructed surface structures with an O atom incorporated into a N vacancy site. We removed a N atom from the topmost layer of the ideal surface structures and incorporated the O atom into the N vacancy site. The expression Nv+O in Figs. 2 and 3 indicates that the structures have an O atom at the N vacancy site. In addition, for the semipolar
  and
and  surfaces, we considered structures that have the Ga vacancy (Gav) and N vacancy (Nv) because two-coordinated N and Ga atoms in the topmost layer are not stable (indicated by blue dashed line in the ideal surface models in Figs. 4 and 5). For example, the 4Nv+3N–H+O model in Fig. 4 means that four two-coordinated N atoms are removed, three H atoms are adsorbed on three-coordinated N atoms, and an O atom is incorporated into the N vacancy site. First, we calculated surface structures without the O atom (no-oxygen condition). Previous studies on the surface structures of GaN were used as references.18–25) Then, we calculated surface structures that include an O atom on the basis of the results of the no-oxygen condition. Structural optimization calculations were performed using quenched molecular dynamics to obtain the total energies of the surface models.
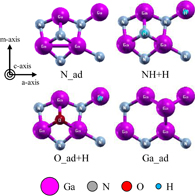
Fig. 1. Calculated surface structures of GaN(0001). These figures were generated using the visualization program XCrysDen.17)
Download figure:
Standard image High-resolution image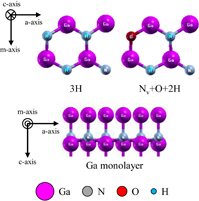
Fig. 2. Calculated surface structures of GaN .
.
Download figure:
Standard image High-resolution image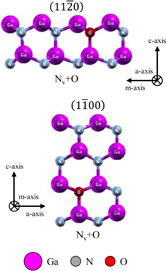
Fig. 3. Calculated surface structures of GaN and
and  .
.
Download figure:
Standard image High-resolution image
Fig. 4. Calculated surface structures of GaN .
.
Download figure:
Standard image High-resolution image
Fig. 5. Calculated surface structures of GaN .
.
Download figure:
Standard image High-resolution image2.3. Surface formation energy
Surface phase diagrams revealed stable surface structures as a function of temperature and gas pressure. The stable structures were determined by comparing the surface formation energy ΔEf values obtained using19)

where Etot and Eref are the total energy of the surface structure under consideration and the total energy of the reference surface structure, respectively. Here, the reference surface structure was the ideal surface structure. ni is the number of atoms of the ith species added to the reference surface. μi is the chemical potential (free energy of ideal gas per one particle) of the ith species. The specific equation for OVPE growth is given by

Here, we assumed the equilibrium condition expressed as

thus, we used the chemical potentials of NH3 and H2 molecules instead of N and H atoms, respectively.26) Because Eq. (2) does not consider the equilibrium condition of GaN ( , where
  is the chemical potential of bulk GaN),19,23) the calculated surface phase diagrams include surface structures under two conditions, that is, GaN grows and does not grow. The gas-phase chemical potential is the sum of the total energy of the isolated atom or molecule and the free energy μgas given by27)

where kB is Boltzmann's constant, T is the gas temperature, g is the degree of degeneracy of the electron energy level, and P is the gas pressure. ζtrans, ζrot, and ζvibr are the partition functions for translational, rotational, and vibrational motions, respectively. The effects of temperature and pressure are included in this equation.
3. Results and discussion
3.1. Surface phase diagrams
The following discussion is based on the assumption that the temperature and Ga pressure for typical OVPE growth are about 1500 K and 1 × 10⁻³ atm, respectively.6) We discuss stable surface structures at around the above-mentioned temperature and Ga pressure. Surface phase diagrams are described as a function of temperature and Ga pressure. The O pressure was half the Ga pressure. The NH3 and H2 pressures were set to 0.1 atm in all cases.
Figures 6(a) and 6(b) show phase diagrams of the (0001) surface under (a) no-oxygen and (b) OVPE growth conditions, respectively. The contour plots show surface formation energies per unit area, where smaller values indicate more stable states. Figure 6(a) shows that the stable surface structures under the no-oxygen condition were the N_ad, Ga_ad, and NH+H models. These structures are shown in Fig. 1. The stabilities of these surface structures can be explained on the basis of the electron counting (EC) rule:28) the dangling bonds of the topmost Ga and N atoms are generally empty and filled by electrons. Although surface structures that satisfy the EC rule are not always the most stable, it helps us to consider candidate structures. We found in Fig. 6(b) that the stable surface structures under the typical OVPE growth conditions were the O_ad and O_ad+H models. An O atom bonded to three Ga atoms and was in the H3 site above the hollow center of hexagon. The O_ad+H model was stable because it satisfies the EC rule. The O_ad model appeared in the higher temperature range because the chemical potential of H increased with temperature and the O_ad model was more stable than the O_ad+H model.

Download figure:
Standard image High-resolution image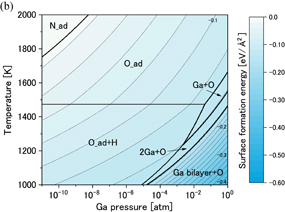
Fig. 6. Phase diagrams of the GaN(0001) surface under (a) no-oxygen and (b) OVPE growth conditions.
Download figure:
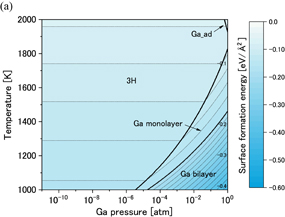
Standard image High-resolution imageFigures 7(a) and 7(b) show phase diagrams of the  surface under (a) no-oxygen and (b) OVPE growth conditions, respectively. Figure 7(a) shows that the 3H model (three H atoms were adsorbed on the topmost N atoms) appeared in a wide range and the Ga monolayer model became stable in the high Ga pressure range under the no-oxygen condition. The 3H model satisfies the EC rule. On the other hand, we see in Fig. 7(b) that the Nv+O+2H model (an O atom was incorporated into the N vacancy site and two H atoms were adsorbed on the topmost N atoms) was stable. The number of adsorbed H atoms of the Nv+O+2H model was smaller than that of the 3H model, which was influenced by the difference in the number of electrons between N and O atoms. The Nv+O+2H also satisfies the EC rule.
Download figure:
Standard image High-resolution image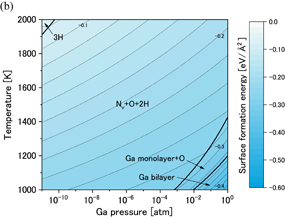
Fig. 7. Phase diagrams of the GaN surface under (a) no-oxygen and (b) OVPE growth conditions.
Download figure:
Standard image High-resolution imageFigures 8 and 9 show phase diagrams of the  and
and  surfaces, respectively. Because the stable structures of these surfaces were almost the same, we explain them together. Figures 8(a) and 9(a) show that the ideal surfaces were stable under the no-oxygen condition, which satisfies the EC rule. We found from Figs. 8(b) and 9(b) that the Nv+O models were stable under the typical OVPE growth conditions; however, these structures do not satisfy the EC rule. We also see that the Ga adlayer+O and the Ga monolayer+O models were stable at low temperatures and high Ga pressures. Here, the Ga adlayer model means that four Ga atoms were adsorbed on the topmost N atoms, the Ga monolayer model had eight Ga atoms, which equals the number of Ga atoms included in one GaN bilayer in the a-axis direction, and an O atom was included in the Ga layer. Because an O atom stably bonds to Ga atoms, surface structures with Ga layers are unfavorable for decreasing the O impurity concentration. However, we consider that the Ga adlayer+O and Ga monolayer+O models may not significantly affect the O impurity incorporation in the OVPE-grown GaN because these surface structures do not appear under the typical OVPE growth conditions.
Download figure:
Standard image High-resolution image
Fig. 8. Phase diagrams of the GaN surface under (a) no-oxygen and (b) OVPE growth conditions.
Download figure:
Standard image High-resolution image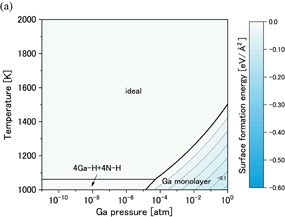
Download figure:
Standard image High-resolution image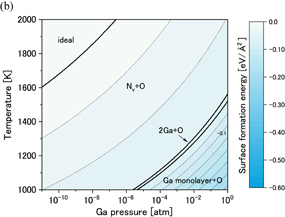
Fig. 9. Phase diagrams of the GaN surface under (a) no-oxygen and (b) OVPE growth conditions.
Download figure:
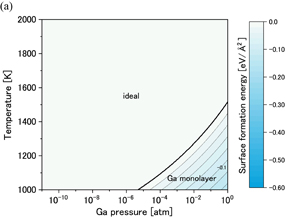
Standard image High-resolution imageFigures 10(a) and 10(b) show phase diagrams of the  surface under (a) no-oxygen and (b) OVPE growth conditions, respectively. Typical surface structures are shown in Fig. 4. The results show that the 4Nv+N–H model was stable under the no-oxygen condition. The surface structures with N vacancies were stable because two-coordinated N atoms are unstable. The 4Nv+N–H model had an H atom that was adsorbed on the three-coordinated N atom, and two Ga–Ga dimers were formed. This surface structure satisfies the EC rule. We see in Fig. 10(b) that the 4Nv+3N–H+O model was stable under the typical OVPE growth conditions. The O atom was incorporated into the N vacancy site and two Ga–Ga dimers were formed (not shown in Fig. 4 because they can be seen by periodically displaying the surface model). This surface structure satisfies the EC rule. In addition, the Ga monolayer+O model was stable at low temperatures or high Ga pressures.

Download figure:
Standard image High-resolution image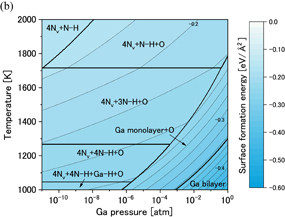
Fig. 10. Phase diagrams of the GaN surface under (a) no-oxygen and (b) OVPE growth conditions.
Download figure:
Standard image High-resolution imageFigures 11(a) and 11(b) show phase diagrams of the  surface under (a) no-oxygen and (b) OVPE growth conditions, respectively. Figure 11(a) shows that the 4Gav+3N–H and 2Gav+N–H models were stable under the no-oxygen condition. They had Ga vacancies, and H atoms were adsorbed on the N atoms. The 4Gav+3N–H model is shown in Fig. 5. This surface structure satisfies the EC rule but the 2Gav+N–H model does not satisfy the EC rule. We found from Fig. 11(b) that the 2Gav+N–H+O model was stable under the typical OVPE growth conditions but it does not satisfy the EC rule. An O atom was adsorbed to two-coordinated Ga atoms and an H atom was adsorbed on the N atom. The O_ad (an O atom was adsorbed to the two-coordinated Ga atoms) and Ga monolayer+O models were also stable at low temperatures or high Ga pressures. We examined other surface models that satisfy the EC rule, but they were not stable compared with the 2Gav+N–H and 2Gav+N–H+O models. Because structures of the semipolar surfaces are very complex and there is a probability of other appropriate structures existing, further investigation of this surface orientation is needed.

Download figure:
Standard image High-resolution image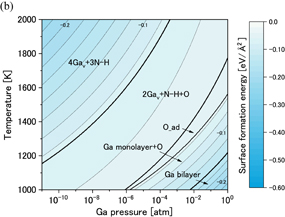
Fig. 11. Phase diagrams of the GaN surface under (a) no-oxygen and (b) OVPE growth conditions.
Download figure:
Standard image High-resolution image
3.2. Desorption of oxygen impurity
When GaN growth proceeds, O atoms on the crystal surfaces should migrate or desorb from the crystal surface. If they remain on the surface, they may impede GaN growth and potentially be the origin of O impurities. We therefore calculated the desorption energy of O atoms to determine whether they could be desorbed from the crystal surface. Calculated desorption energies are listed in Table I. For example, the desorption energy of the O_ad model on the (0001) surface was calculated by subtracting the total energy of the O_ad model from that of the ideal surface and the isolated O atom. We assumed that there were no energy barriers during the desorption. From the results, we estimate that an O atom does not readily desorb from all surfaces at a growth temperature of about 1500 K because the desorption energies were so high. It was reported that the oxygen impurity concentration decreases at a high H2 gas pressure,4) possibly because O atoms could be removed by reduction with H2. We calculated the desorption energies of OH and H2O from the (0001) surface to be about 5.31 and 1.63 eV, respectively.12) These results indicate that H2O easily desorbs from the GaN surfaces. On the other hand, we estimated from the surface phase diagram shown in Fig. 6(b) that the surface structures with an OH group were more unstable than those with an O atom. When we examined the phase diagram of the (0001) surface, we considered surface structures with an OH group; however, they were more unstable than those with an O atom and thus surface structures with an OH group are not shown in Fig. 6(b). It might be deduced from the result that the reduction reaction does not easily occur. Therefore, high-temperature and high-pressure H2 gas conditions are required to enhance the reduction reaction.
Table I. Desorption energies (in eV) of O atoms from GaN crystal surfaces.
| Surface orientation | Structure model | Desorption energy |
|---|---|---|
| (0001) | O_ad | 7.41 |
| (0001) | O_ad+H | 7.46 |
 |
Nv+O+2H | 8.10 |
 |
Nv+O | 7.34 |
 |
Nv+O | 7.81 |
 |
4Nv+3N–H+O | 7.53 |
 |
Ga monolayer+O | 7.46 |
 |
2Gav+N–H+O | 6.90 |
 |
O_ad | 6.71 |
Next, we discuss the surface orientation dependence of O impurity concentration. There are some papers about the dependence of O impurity concentration on surface orientation in GaN crystals grown by HVPE,10,11) metalorganic chemical vapor deposition (MOCVD),13,29–32) Na-flux,33) and OVPE,5,34) and it was also estimated by first-principles calculation.35) Regardless of the differences in growth methods, the surface orientation dependence of O impurity concentration shows a similar tendency. In the polar surfaces, the  surface contains higher O impurity concentrations than the (0001) surface.29,30) We show in Table I that the desorption energy of the O atom from the
  surface was larger than that from the (0001) surface, which means that an O atom is more stably adsorbed on the
  surface than on the (0001) surface. Our result therefore agreed with the experimental results in regard to this point. Comparison of the polar, nonpolar, and semipolar surfaces showed that the O impurity concentrations in the nonpolar and N-polar semipolar surfaces are higher than that in the (0001) surface.10,11,13,32,34) In particular, it was described that the presence of the
  surface increases the O impurity concentration.3,31,33) Because an O atom is stably incorporated into the N site, GaN surfaces whose topmost layer is composed of N atoms, for example, the N-polar, nonpolar, and N-polar semipolar surfaces, are more likely to incorporate O atoms. However, there was no significant difference in desorption energy among the (0001), the nonpolar, and the
  surfaces in Table I. We speculate that surface roughness and surface diffusion as well as the desorption energy of O atoms actually affect the surface orientation dependence of O impurity concentration. We can imagine that if the crystal surface is rough, O atoms are more readily incorporated into kinks, steps, and vacancy sites. In that sense, growth with a smooth surface is also effective for reducing the incorporation of O impurities. The desorption energy from the
  surface was the smallest in Table I. Therefore, it is considered in terms of only desorption energy that the O impurity concentration in the
  surface is low. Experimental results supporting this consideration have also been reported.13) Because there are few experimental reports on the Ga-polar semipolar surfaces, verification by experiments is necessary. We deduce that the O impurity concentrations in the Ga-polar surfaces, that is, the (0001) and
  surfaces, are lower than those in the N-polar, nonpolar, and N-polar semipolar surfaces.
4. Conclusions
Stable structures of the polar, nonpolar, and semipolar GaN surfaces during OVPE growth were investigated with first-principles calculations. We described surface phase diagrams as a function of temperature and Ga pressure. In the (0001) and  surfaces, an O atom stably bonded to the topmost Ga atoms. In the
  , nonpolar, and
  surfaces, an O atom was stably incorporated into the N vacancy site. The desorption energies of O atoms from the GaN surfaces were so high that the O atoms did not readily desorb from the GaN surfaces under OVPE growth conditions at 1500 K. The desorption energy from the
  surface was about 8.10 eV and was the highest among the calculated results. On the other hand, that from the
  surface was about 6.71 eV and was the lowest. There was no significant difference in desorption energy among the (0001), nonpolar, and
  surfaces. Considering the surface orientation dependence of O impurity concentration, it was difficult to explain the experimentally understood tendency on the basis of only the calculated desorption energies. For further understanding, we need to investigate the influence of surface roughness and surface diffusion as well as desorption energy of O impurities.
Acknowledgments
This work was supported by JSPS KAKENHI Grant Numbers JP15K17459, JP18K04957, JP26105010, and JP16H06418, and by the Collaborative Research Program of the Research Institute for Applied Mechanics, Kyushu University.