

Abstract
The temperature dependence of the scintillation intensity of Cs2HfCl6 was measured and found to increase monotonically from 10 to 300 K, whereas no significant dependence on temperature was observed for the scintillation decay. A simple three-state model in which two excited levels are slightly different in their energies and have similar radiative rates was able to describe the experimental trends. The model is consistent with the experimental observation of two kinds of Vk centers and with theoretical predictions of two types of self-trapped excitons reported in the literature.
Export citation and abstract BibTeX RIS
1. Introduction
Scintillators are phosphors used for radiation detection and emit photons upon irradiation with ionizing radiation. Most scintillators are composed of an insulator host and dopants, such as rare-earth elements that act as the luminescence centers. On the other hand, some insulator crystals exhibit efficient scintillation without dopants, and these crystals are classified as self-activated scintillators. A famous example is Bi4Ge3O12 (BGO),1) which is one of the heaviest scintillators. Halide crystals such as BaF22,3) and CsI4,5) are also known to exhibit efficient scintillation without dopants. Fast scintillation of BaCl26,7) and highly efficient scintillation of TlMgCl38) has been previously reported. However, research on self-activated-type scintillation is still needed to develop approaches for novel scintillation materials.
Previously, A2MCl6 (A = Cs or Rb, M = Hf or Zr) compounds9–11) has been proposed as novel scintillators. Self-activated type scintillation occurs in these non-luminescent-center compounds, and is attributed to a charge-transfer transition from O2− to M4+. The photoluminescence spectrum of Cs2HfCl6 was similar to that of scintillation and is also attributed to the charge-transfer transition.12) On the other hand, quantum chemical calculations of Cs2HfCl6 show several types of self-trapped excitons (STEs) as the origin of the luminescence and scintillation.13)
Analysis of the temperature dependence of a scintillator material is one way to elucidate the characteristics of electronic transitions responsible for scintillation, particularly in the case of self-activated scintillators which exhibit the emissions from STEs or charge-transfer-type excited states. For example, STE emission processes have been analyzed in detail for BGO.14) As for Cs2HfCl6, Kurosawa et al. measured the scintillation light yield at temperatures between −20 to 30 °C.15) From the electronic transition characteristics, Kral et al. reported the temperature dependence of the photoluminescence properties in the temperature range from 8 to 500 K and in combination with the EPR spectra, the electronic energy level diagram was proposed.16) The objective of this work was to measure the thermal variation of the scintillator material, Cs2HfCl6, and to develop a phenomenological model for describing the trends.
2. Experimental methods
A single crystal of Cs2HfCl6 was grown via Bridgman–Stockbarger method. The crystal contained Zr at ca. 0.12 mol %.10) The sample was placed on a Cu sample holder in a closed-cycle type cryostat. The scintillation spectra at different temperatures were obtained under X-ray irradiation. The X-ray source was an X-ray tube operated at 80 kV and 1.2 mA. The scintillation was guided with an optical fiber to a CCD detector (Andor DU-420-BU2) equipped with a monochromator (Oriel Instruments SR163). The measurement setup is similar to that in a previous paper.17) The photoluminescence spectra at different temperatures were also measured with the same detector. The excitation source was a Xe lamp. The excitation wavelength was set at 253 nm.
The scintillation transient profiles were obtained using a pulsed electron beam as the excitation source. The pulsed electron beam was obtained using an electron linear accelerator at Nuclear Professional School, School of Engineering, The University of Tokyo. The sample was placed on a Cu sample holder in a vacuum chamber and was irradiated with the pulsed electron beam. The sample was cooled with a closed-cycle-type cryostat. The scintillation photons were guided to a multichannel-plate-mounted photomultiplier tube (MCP-PMT; Hamamatsu R3809U-50) outside of the chamber with a couple of optical lens and a mirror. The signals of the MCP-PMT were delivered to a digital oscilloscope (DSO; HP Infinium 54845-A). The trigger signal of the DSO was supplied from the accelerator. The signal was averaged over 16 electron pulses, and the averaged signal was obtained as the scintillation transient profile. The time resolution of the measurement system was ca. 0.3 ns. The details of the measurement system is described in a previous paper.18)
3. Results
Figure 1 shows the photoluminescence spectra at different temperatures. A prominent band is observed at 440 nm; the weak band at 270 nm corresponds to the scattered excitation light. The effect of the temperature could be seen only in the intensity of the band at 440 nm and there was no apparent change in the spectral shape. The photoluminescence spectra can be fitted with sums of two Gaussian functions centered at ca. 440 and 320 nm. Unfortunately, the origin of the weak band at 320 nm is unknown. Figure 2 shows the photoluminescence spectrum at 299 K along with the fitted function. Figure 3 shows the temperature dependence of the integrated peak intensity of the 440-nm band. The intensity is almost constant at temperatures below 100 K, and increased monotonically at temperatures at higher than 100 K. Considering the excitation wavelength of 253 nm in our study, a photoluminescence band was present possibly owing to Zr impurities.16)

Fig. 1. Photoluminescence spectra of Cs2HfCl6 at different temperatures. The excitation wavelength was 253 nm.
Download figure:
Standard image High-resolution image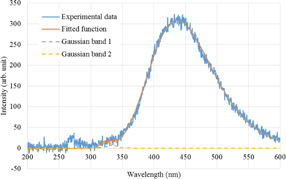
Fig. 2. Photoluminescence spectrum of Cs2HfCl6 at 299 K with the fitted function and two Gaussian bands.
Download figure:
Standard image High-resolution image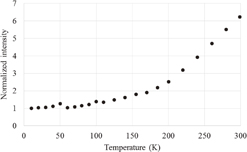
Fig. 3. Luminescence intensity of the 440-nm band as a function of temperature.
Download figure:
Standard image High-resolution imageFigure 4 shows the scintillation spectra at different temperatures. A dominant band is observed at 390 nm. In addition, the band became broad at high temperatures and a small shoulder appeared at ∼340 nm. The scintillation spectra can also be fitted with sums of two Gaussian functions centered at ca. 390 and 320 nm. Again, the origin of the weak band at 320 nm is unknown. Figure 5 shows the scintillation spectrum at 299 K along with the fitted function. Figure 6 shows the temperature dependence of the integrated peak intensity of the 390-nm band. In contrast to the case of photoluminescence, the peak intensity did not change significantly.
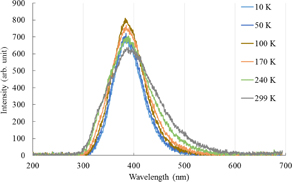
Fig. 4. Scintillation spectra of Cs2HfCl6 at different temperatures.
Download figure:
Standard image High-resolution image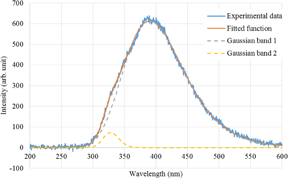
Fig. 5. Scintillation spectrum of Cs2HfCl6 at 299 K with the fitted function and two Gaussian bands.
Download figure:
Standard image High-resolution image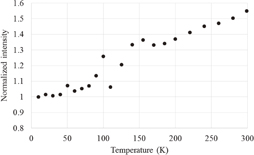
Fig. 6. Scintillation intensity of the band at 390 nm as a function of temperature.
Download figure:
Standard image High-resolution imageFigure 7 shows the scintillation transient profiles of Cs2HfCl6 at 25, 200, and 295 K. Because of the low signal-to-noise ratio owing to the pulse sampling measurement in a relatively long time scale, it is difficult to judge how many components are present in the decay. In this study, the decay behavior was fitted with a sum of a single exponential decay function and a time-independent contribution of noise to derive quantitative data. The decay time constants are estimated to be 5.9, 4.8, and 6.0 µs at 25, 200, and 295 K, respectively.
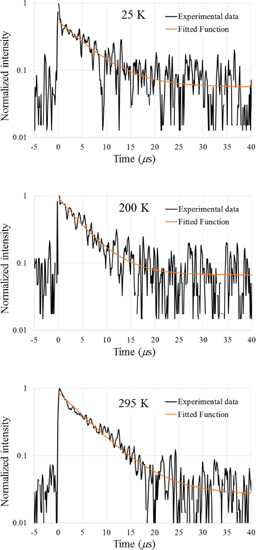
Fig. 7. Scintillation transient profiles at 25, 200, and 295 K.
Download figure:
Standard image High-resolution image4. Discussion
As shown in Figs. 3 and 6, the luminescence and scintillation intensity monotonically increased with temperature, except for some scattered points at 50 and 110 K. The temperature dependence of the photoluminescence intensities with excitations at 200 and 260 nm reported by Kral et al.16) is qualitatively consistent with our results, although the intensity increased more significantly with temperature and a decrease at around 100 K was not observed. They also reported that thermal quenching occurred at temperatures higher than 300 K, which is over the range of the present measurements.
A two-level model is not appropriate for the monotonic increase in the photoluminescence and scintillation intensities shown by the materials in this work. In such a model, the luminescence process is described as competition between the radiative and nonradiative decay of the excited states. The nonradiative decay process is generally described as a thermally activated one. Hence, a monotonic decrease in the intensity with temperature is derived in a two-level model. According to trends of the data, at least two excited levels are required to explain the temperature dependence.
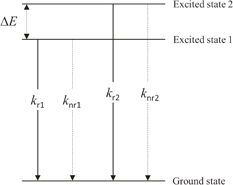
A simple model can be prepared by assuming that the two excited levels are in quasi-equilibrium for the analysis of the temperature dependence of the scintillation intensity (Fig. 8). Suppose that the two excited levels 1 and 2 are separated by ΔE. The populations of these excited states, n1 and n2, follow the Boltzmann distribution because they are supposed to be in quasi-equilibrium, i.e.,

where kB is the Boltzmann constant and T is the temperature. The radiative and nonradiative transition rates to the ground state are expressed with subscripts r or nr, respectively, with levels 1 or 2, for example, kr1. The radiative rates are assumed to be independent of temperature and the nonradiative transitions are assumed to be thermally activated processes with their rates being expressed as follows:


where A1 and A2 are the frequency factors, Ea1 and Ea2 are activation energies of the nonradiative process of levels 1 and 2, respectively. With Eqs. (1)–(3) all the temperature-dependent terms are explicitly expressed so that the temperature dependence of the emission intensity, I(T), is given as follows:
where the first and the second terms correspond to the emission intensities of the levels 1 and 2, respectively. The first term decreases monotonically with temperature, which is the opposite trend to the experimental results. As for the second term, the first and the second factors monotonically increase and decrease with temperature, respectively. The second term tends to zero at T → 0 and increases to a maximum at a certain temperature and subsequently decreases. Either of the terms cannot describe the experimental results. However, the temperature dependence can be described with the contributions of the two terms, i.e., the two excited levels proposed in Fig. 8. The first and the second terms mainly contribute to the scintillation at low and high temperature, respectively. This phenomenological model is consistent with two kinds of STEs which have different energies according to quantum chemical calculations13) and Vk centers which have different thermal stabilities observed with EPR.16) These considerations lead to the conclusion that the scintillation and photoluminescence occurs predominantly from the higher excited level (level 2 in Fig. 8).
Fig. 8. Schematic diagram of proposed three-level model for a non-luminescent center (Cs2HfCl6) scintillation material.
Download figure:
Standard image High-resolution image
As for the scintillation decay behavior, in contrast to the scintillation intensity, no significant change in the decay time constant is observed. Based on the above considerations, the emission from the lower excited level (level 1 in Fig. 8) is dominant at 20 K, whereas the emission from the higher excited state (level 2 in Fig. 8) is dominant at 200 and 295 K. Assuming that the nonradiative transition is not so active for level 1 at 20 K and for level 2 at 200 and 295 K, respectively, the radiative rates for the levels 1 and 2 are similar.
Summarizing the discussion, the scintillation of Cs2HfCl6 at different temperatures is described as the emissions from two excited levels which have slightly different energies and similar radiative rates. The two excited levels may be related to STEs which have different configurations.13,16)
As for the temperature dependence of the photoluminescence intensity shown in Fig. 3, as well as the temperature dependence of the scintillation intensity, a monotonic increase in the photoluminescence intensity with temperature is observed. The photoluminescence with excitation at 253 nm is attributed to Zr impurities. The temperature dependence of the photoluminescence can also be explained qualitatively with the three-level model as proposed above. In this case, the two excited states may be related to two kinds of STEs perturbed by Zr.
5. Conclusions
A phenomenological model was developed to describe the temperature dependence of the scintillation properties of Cs2HfCl6. A monotonic increase in the scintillation intensity with temperature is observed whereas the scintillation decay behavior did not change significantly with temperature. The three-level model in which emissions from two excited levels are assumed to contribute to the scintillation allows qualitative discussion of the two excited levels and shows that slightly different energies and similar radiative rates are present. The model is consistent with the predicted self-trapped excitons by quantum chemical calculations and experimental observations of the Vk centers with EPR.
Acknowledgments
Part of this research is based on the Cooperative Research Project of Research Center for Biomedical Engineering, Ministry of Education, Culture, Sports, Science and Technology. This work was carried out as a collaborative research project at Nuclear Professional School, School of Engineering, The University of Tokyo. We thank Professor M. Uesaka and Mr. T. Ueda, The University of Tokyo for providing support in the experiment.