
Abstract
A fluoropolymer membrane filter with through-holes was fabricated by photolithographic patterning and the dry etching method. 380,000 highly packed through-holes, each with a diameter of 7 µm were able to cover a whole area with a diameter of 13 mm. Ethylene tetrafluoroethylene (ETFE) was used as the membrane, which was suitable for the fluorescence detection of rare cells such as circulating tumor cells (CTCs) in human blood. The device fabrication for the size based capture of rare cells in blood such as CTCs is realized in this study.
Export citation and abstract BibTeX RIS

Content from this work may be used under the terms of the Creative Commons Attribution 4.0 license. Any further distribution of this work must maintain attribution to the author(s) and the title of the work, journal citation and DOI.
This article was made open access on 10 September 2018
1. Introduction
Membrane filters have been commonly used for separation purposes in analytical biochemistry. Commercial polymer membrane filters are generally opaque and have been fabricated by opening randomly pores for filtration.
With the rapidly increasing demands for trapping circulating tumor cells (CTCs) from whole human blood, it is necessary to develop methods of rapidly and precisely filtering biological cells for medical diagnostics and therapies. Membrane filters are candidates for cell separation whose mechanism is based on size exclusion. To diagnose captured cells rapidly and precisely, target cells are usually stained using fluorescent molecules of cell-surface expression markers.1)
A size-exclusive microfiltration device made of poly(ethylene terephthalate) (PET) for CTCs was successfully developed by our group.2) It was fabricated using photolithography-patterned metallic masks and plasma etching. A PET filter could isolate cells precisely by size exclusion, but suffers from auto-fluorescence issue in microscopy. The materials and fabrication method used for the size filter method for the isolation of CTCs are as follows: photoresists by photolithography,3–5) metals by electro-deposition,6–9) poly(dimethylsiloxane) (PDMS) by soft lithography,10) polycarbonate (PC) by track etching11–13) and parylene by vaccum evaporation.14–17) Photoresists have auto-fluorescence.18) Metals such as Ni6–8) and Pd9) provide only opaque membranes. PDMS is a transparent material but it has a problem in chemical resistance and dissolves in organic solvents.18) PC has good transparency and low-autofluorescence compared with PET. Thus far, PC membrane filters are fabricated by the track etching method and have diameters that show a narrow dispersion; however, their positions are random and their density is low. Their connected plural holes unfortunately act as relatively large holes.13,19) Parylene has good transparency and low-autofluorescence.14,15) Generally, it is coated by a specialized vacuum evaporation method, and its deposition rate is limited, below approximately 4.5 µm/h for deposition with high transparency in the UV region.16) In the fabrication of parylene membrane filters with a thickness of 10 µm,14) over 2 h deposition time is needed. Thus, the productivity of a thick parylene coating is beset with issues.
Ethylene tetrafluoroethylene (ETFE) is a copolymer characterized by its excellent chemical durability to both acid and alkali, its transmittance to UV and visible light,20,21) and its solution to the auto-fluorescence problem. Its optical transmittance is approximately 90% at a wavelength of 400 nm with a thickness of 25 µm. ETFE films are fabricated by a roll-to-roll process and have already been commercialized. They are also high heat-resistant polymers compared with PET and PC. In the use of ETFE, the large thermal expansion of ETFE is taken into account for plasma etching (Table I). We have optimized the fabrication method and etch-mask material of ETFE.
Table I. Thermal expansion coefficients of PET and ETFE. MD stands for machine direction. TD for transverse direction in unit of ppm.
| Temperature (°C) | PET | ETFE | ||
|---|---|---|---|---|
| MD | TD | MD | TD | |
| 50 | 500 | 400 | 1800 | 4500 |
| 80 | 500 | 1000 | −6000 | 9000 |
| 100 | 400 | −1500 | −14000 | 12000 |
In this paper, we report an optically transparent ETFE membrane filter with several tens of millions of bored through-holes. The filter was fabricated using photolithography-patterned metallic masks and plasma etching. It was fabricated with a high etching rate (1.35 µm/min) and was realized with high etching selectivity of the Ti mask and with 380,000 precisely aligned holes. The holes, each with a diameter of 7 µm, were precisely fabricated. The filter can be used for the filtration of CTCs in whole blood.
2. Experimental methods
2.1. Fabrication of ETFE membrane filters
A silicon wafer with a diameter of 150 mm (Kunshan Sino Silicon Technology) was used as the substrate. To paste an ETFE film with a thickness of 25 µm (AGC Asahi Glass 25N) to the Si wafer, a double-coated polyimide tape (Okamoto Industries WD1030) of 100 mm square: one side of weak adhesive force of 0.2 N/25 mm and the other side of strong adhesive force of 5 N/25 mm was pasted on the Si substrate using a hand roller. Subsequently, the ETFE film was pasted on the front face of the double-coated adhesive tape [Fig. 1(a)].

Fig. 1. Fabrication scheme of an ETFE membrane filter.
Download figure:
Standard image High-resolution imageA titanium (Ti) film with a thickness of 150 nm was deposited on the ETFE surface using a DC magnetron sputtering apparatus (Tokki SPL-711V). A sputtering power of 500 W was applied using a DC pulse power supply (Advanced Energy Pinnacle+). The size of the Ti target of the sputtering apparatus was 63 × 457 mm2. The distance between the target and the substrate was kept at 50 mm. The base pressure of the deposition chamber was about 8 × 10⁻⁴ Pa. During the sputtering, an ultra high-purity Ar gas with a flow rate of 80 sccm was introduced into the chamber. The Ar pressure was kept at 0.7 Pa. The substrate was not heated intentionally [Fig. 1(b)]. The thermal expansion coefficients of PET and ETFE were measured and are listed in Table I. Very large thermal expansion coefficients of ETFE for thermal expansion are required to choose a mask material. Metallic Ti used in this study has good resistance against in thermal cracking and insolubility in alkaline in photolithography.
Resist patterns were prepared by photolithography. A positive tone photoresist resin (Merck Performance Materials AZ P1350) was coated on the ETFE-pasted and Ti-deposited substrate using a spin coater (Mikasa MS-A100). The coating was carried out at a rotation speed of 500 rpm for 30 s. The coated resin was baked at 80 °C for 5 min in a furnace (Collet Kogyo ADT-102). The photomasks had a diameter (d) of 7 µm arrayed with a fixed distance (p) of 20 µm. Photolithographic patterns were exposed to 40 mW/cm2 at 365 nm for 1 s using a photolithographic aligner (SUSS Microtech MA8). The exposed patterns were then developed for 60 s using a developing machine (Mikasa AD-1200) with a developer (Tokyo Ohka Kogyo NMD-W). In an area with a diameter of 13 mm, 0.38 million hole patterns were formed [Fig. 1(c)].
The photolithographic resist patterns were transferred to the Ti film by plasma etching. A commercial inductively coupled plasma (ICP) etcher (ULVAC CE-300IN) was used for Ti etching. An RF power of 13.56 MHz was applied to an antenna coil in order to produce ICP. The antenna power was 100 W. An RF bias power of 12.5 MHz was applied to the wafer stage of the ICP etcher. The bias power was 40 W. Chlorine (Cl2) gas was used at a flow rate of 20 sccm. The pressure was fixed at 1 Pa. The etching time was 480 s. The substrate was held on the wafer stage by an electrostatic chuck. The substrate temperature was controlled by introducing helium gas to the back of the substrate. The temperature of the cooling water of the stage was 12 °C [Fig. 1(d)].
Next, the patterns on the Ti mask were transferred to the ETFE film by plasma etching. A commercial ICP etcher (ULVAC NE-550) was used. The antenna power was fixed at 200 W. The bias power, flow rate of pure O2 gas, process pressure, and etching area were varied as follows: 50–250 W, 20–100 sccm, 0.5–4.0 Pa, and 1.3–5.3 cm2, respectively. The temperature of cooling water of the stage was 12 °C. The back of the Si substrate was filled with helium gas with a pressure of 1000 Pa for temperature control [Fig. 1(e)].
After the ETFE etching, the Ti film was removed by exposure to Cl2 plasma [Fig. 1(f)]. The bored ETFE film was peeled off using tweezers [Figs. 1(g) and 2], from the front of the double-coated adhesive polyimide tape on the Si substrate.

Fig. 2. Photograph of peeling of the ETFE film.
Download figure:
Standard image High-resolution image2.2. Characterizations of ETFE membrane filters
The etch features were observed by scanning electron microscopy (SEM; Hitachi High-Technologies S3400). The etching rate was calculated using the hole depth. The Ti mask thickness was measured using X-ray fluorescence (XRF; Rigaku ZSX100e). Optical absorption was measured with an UV-VIS spectrometer (Shimadzu UV-3100). The auto-fluorescent property was evaluated using a fluorescence spectrophotometer (Hitachi High-Technologies F-7000). The excitation and detection wavelengths were 360 and 460 nm, respectively. The chemical composition of the surface was analyzed by X-ray photoelectron spectroscopy (XPS; Ulvac-Phi QuanteraII) and the auger electron spectroscopy (AES; Ulvac-Phi PHI-710).
2.3. Cell culture
The NSCLC cell line NCI-H358 was cultured in RPMI 1640 medium containing 2 mM l-glutamine (Thermo Fisher Scientific), 10% (v/v) FBS (Biowest), and 1% (v/v) penicillin/streptomycin solution (Thermo Fisher Scientific) for 3–4 days at 37 °C in a humidified atmosphere containing 5% CO2. Immediately before each experiment, confluent cells were trypsinized and resuspended in PBS.
2.4. Blood sample preparation
Normal human blood samples were collected from healthy donors at the Nagoya University. The samples were collected in a collection tube with EDTA to prevent coagulation and used within 12 h.
2.5. Fabrication of CTC isolation systems
Figures 3(a) and 3(b) show a photograph and schematic image of the CTC isolation system. The fabricated ETFE filter was put in a commercial filter holder (SWINNEX SX0001300), and an input syringe (TERUMO ss-10ESz) was set on the upper side of the filter holder. A waste syringe was set on a commercial syringe pump (KS Scientific Legato) and the lower side of the filter holder were connected by a commercial tube (TERUMO SF-ET1725).

Download figure:
Standard image High-resolution image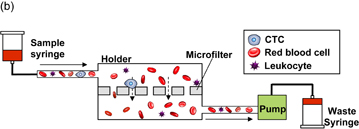
Fig. 3. Size-based CTC isolation system. (a) Photograph. (b) Schematic image.
Download figure:
Standard image High-resolution image2.6. Cell entrapment operation
Each blood sample (7.5 mL) was diluted two times with PBS (7.5 mL). Then, the H358 cell suspension of 1000 cells was spiked in the blood sample. The blood sample was added to the reservoir. Subsequently, negative pressure was applied to the cell suspension with a syringe pump. The sample was passed through the filter at a flow rate of 1 mL/min for 15 min. To remove blood cells that remained on the filter, PBS was added to the reservoir and passed through the filter at a flow rate of 1 mL/min for 5 min.
2.7. Immunostaining and microscopic imaging
A cell staining solution was introduced into the reservoir and passed through the filter with a syringe pump after washing. To identify CTCs and leukocytes, 200 µL of cell staining solution containing 1 µg/mL Hoechst 33342 (Wako Pure Chemical Industries), a cocktail of PE-labeled anti-EpCAM antibodies (1:3 dilution; BD Biosciences), and an anti-CD45 antibody (Alexa Fluor® 647, 1:40 dilution; BioLegend) was passed through the filter at a flow rate of 4 µL/min for 50 min. Finally, the filter was washed with 3 mL of PBST to remove excess dye. Fluorescence images were obtained with a fluorescence microscope (Keyence Biorevo BZ-X700), integrated with DAPI, TRITC, and Cy5 filter sets.
3. Results and discussion
3.1. Auto-fluorescence property of ETFE film
Figure 4(a) shows the auto-fluorescence property of the ETFE films and PET films. The auto-fluorescence intensity of the ETFE films was higher than that of the PET films in the wavelength range of 430–480 nm in the DAPI region. The optical absorption spectrum of the ETFE films was measured to determine why the auto-fluorescence of ETFE was lower than that of PET. The optical absorption of ETFE was smaller than that of PET at a wavelength range of 340–370 nm, which was the laser excitation wavelength used in the DAPI filter set [Fig. 4(b)]. Thus, the auto-fluorescence of the ETFE films was low since the optical absorption in the excitation laser region of DAPI was small.

Download figure:
Standard image High-resolution image
Fig. 4. (a) Auto-fluorescent spectra of ETFE and PET films. (b) Absorption spectra of ETFE and PET.
Download figure:
Standard image High-resolution image3.2. Etching characteristics in O2 plasma
An ETFE membrane filter with precisely aligned through-holes was fabricated by photo-lithographic patterning and the dry etching method. The etching characteristics of both ETFE and Ti in O2 plasma are shown in Fig. 5. The etch rates of both ETFE and Ti increased similarly with an increase in the substrate bias power; the selectivity of ETFE over Ti remained constant at 670 [Fig. 5(a)]. The etch rates increased in an ion-enhanced physical sputtering manner. For pure Ti in O2 plasma, the physical sputtering determined the selectivity of ETFE over Ti. However, the relatively high etching rates were further chemically enhanced by fluorine. Namely, the ETFE etch byproducts remediated the Ti etch rates. The selectivity for the Ti mask decreased with an increase in processing pressure [Fig. 5(b)] and ETFE-exposed etch area [Fig. 5(c)] and with a decrease in O2 flow rate [Fig. 5(d)]. In order to clarify why the Ti etch rate increased, the as-etched Ti surface was analyzed using XPS, and fluoride species such as Ti–F and C–F were detected [Figs. 6(a) and 6(b)]. The result indicated that the etch byproducts of ETFE in O2 plasma reacted with the Ti surface. The fluorides were considered to generate volatiles such as TiF4. In order to maintain the Ti mask after etching, a high-selectivity or thick Ti mask was required. Since a thick Ti mask causes cracks and worse productivity, a high-selectivity mask was required. The high-selectivity mask resulted in a lower pressure and a higher O2 flow rate. In other words, the lower fluorine partial pressure improved selectivity. As a consequence, the use of the 150 nm Ti mask for the ETFE etch processes enabled us to fabricate through-hole membranes on the 25-µm-thick ETFE film.

Fig. 5. Dependences of etch rates of ETFE (middle) and Ti masks (bottom) and selectivity (top) in O2 plasma on (a) bias power at 0.5 Pa, 1.3 cm2 etching area and 100 sccm O2 flow rate, (b) pressure at 200 W bias, 1.3 cm2 etching area, and 100 sccm O2 flow rate, (c) etching area at 200 W bias, 0.5 Pa, and 100 sccm O2 flow rate, and (d) O2 flow rate at 200 W bias, 2 Pa, and 1.3 cm2 etching area.
Download figure:
Standard image High-resolution image
Download figure:
Standard image High-resolution image
Fig. 6. XPS spectra of Ti mask after ETFE patterning. (a) Survey and (b) narrow scan for F 1s.
Download figure:
Standard image High-resolution image3.3. Sidewall film deposition and etching parameter
SEM images of ETFE films subjected to through-hole etching by O2 plasma at 0.5 and 4 Pa, and Ti removed by Cl2 plasma are shown in Figs. 7(a)–7(j). Focusing on the side wall of the hole entrance [Fig. 7(h)], adhesion and peeling of the film were observed for sample S2; the pressure of 4 Pa. The gas residence times for 0.5 and 4 Pa were 0.09 and 0.70 s, respectively; the gas residence time was about 8 times longer for 4 Pa. Although only reference values, the mean free paths of oxygen are 21.1 and 2.6 mm, respectively, which are about 1/10 shorter than that at 4 Pa. At a high pressure 4 Pa, the probability that ETFE etching byproducts generated inside the hole will adhere to the side wall is high. Therefore, it is thought that the adhesion of a thick film occurred.

Fig. 7. SEM images of the fabricated through holes: (a)–(e) SEM images of sample S1 and (f)–(j) SEM images of sample S2.
Download figure:
Standard image High-resolution imageNext, XPS was performed on sample S2 after though-hole etching of the film attached to the side wall. The XPS profiles of the measurement part including the holes [Fig. 8(b)] and the measurement part not including the holes [Fig. 8(c)] were almost the same. The composition of the film attached to the holes is considered to be equal to that of the film attached to the Ti surface. The composition of the film attached to the holes and Ti surface was CF, and "Carbonized"22) decomposed from CF2 and CH2, which are the composition of ETFE [Fig. 8(c)]. Yamamoto et al. reported that the ETFE is easily decomposed by argon ion beam etching.22) Indeed, the decomposed ETFE appeared in the chemical shift in the CF2 and CH2 peaks in the XPS profiles. These modifications were also found in various fluoropolymers such as ETFE,23) poly(vinylidene fluoride) (PVDF),24) PTFE–PE copoplymer,25,26) PTFE–perfluoro(propyl vinyl ether) copolymer,27) PTFE–PVDF copolymer,28,29) and other halogenated polymers such as poly(vinyl chloride) (PVC).30)

Fig. 8. Results of XPS. (a) ETFE, (b) Ti surface including hole, and (c) Ti surface not including hole.
Download figure:
Standard image High-resolution image3.4. Back hole shape and etching parameter
Since the cells are separated by size, control of the hole diameter and shape is needed. Figure 7 shows SEM images of the front and back surfaces of the fabricated ETFE filters processed at 0.5 Pa [Figs. 7(a)–7(e)] and 4 Pa [Figs. 7(f)–7(j)]. The front hole shape was a circle reflecting the pattern of the photomask regardless of the processing pressure [Figs. 7(a) and 7(f)]. Next, the hole shape on the back was smooth and circular like the surface of high-pressure (4 Pa) sample [Fig. 7(g)]. On the other hand, for the low-pressure (0.5 Pa) sample, rough figures that were jagged were obtained [Fig. 7(b)]. The jaggedness on the back surface was not an etching residue of the ETFE film, but the roughness of the side wall of the hole generated from the hole surface side exposed on the back surface, as shown Figs. 7(e) and 7(j). The roughness on the inner wall increased as the etching proceeded.
The mechanism of the occurrence of the sidewall roughness of the inner wall is considered as follows: (1) something adheres to the inner wall surface of ETFE and becomes an etching mask, and (2) results in the reflecting roughness of the Ti mask. Results of the composition analysis of the hole entrance [Fig. 9(a)] by AES are shown in Table II. For the samples processed at a low pressure of 0.5 Pa [Fig. 9(b)] and a high pressure of 4 Pa [Fig. 9(c)], Ti estimated to be derived from the Ti mask was detected for both samples. It is reported that fine metal particles sputtered from the etching chamber walls serve as an etching mask.31) Here, fine Ti particles adhere to the inner wall of the hole, which may serve as an etching mask. The amount of Ti adhering to the inner wall (Ti/F or Ti/C) was significantly higher under the low pressure condition than under the high pressure condition (Table II). Under the high pressure condition, it is considered that the sputtering rate was low because the amount of gas in the chamber was large, and the oxygen ions accelerated by the bias lost energy owing to collision with the gas before reaching the Ti surface. The reason why the shapes of the back surface are different, while both Ti adhere under the low pressure condition (0.4 Pa) and high pressure condition (4 Pa) is considered as follows. Under the low pressure condition (0.5 Pa), it is estimated that the scattering is small because the mean free path of oxygen is as long as 21.1 mm, and the shape of the Ti film adhering near the entrance of the hole is magnified and projected. On the other hand, under the high pressure condition (4 Pa), the mean free path of oxygen is as short as 2.2 mm and there is much scattering, so it is presumed that a smooth circular shape was obtained without reflecting the shape of the Ti film adhering near the hole inlet. Next, SEM observation results of the ETFE surface before and after etching are shown in Fig. 10. Surface roughness arises owing to the difference in etching rate between crystal and amorphous samples. This phenomenon has also been reported in an other paper.32) It is also conceivable that the Ti film was coated on such a surface roughness, thereby forming an etching mask. Finally, with regard to (2), in a previous paper,33) it has been reported that a surface roughness on the order of 50 nm due to the material of the resist mask is transferred to Si during dry etching. In this study, it is possible that the surface roughness generated in the resist is transferred to the Ti mask, which is enlarged and projected to cause sidewall roughness. In the future, to verify this hypothesis, it is necessary to evaluate the surface roughness of the inner wall of the photoresist pattern and to observe in detail the Ti adhesion state of the inner wall of the ETFE.

Fig. 9. SEM images of ETFE film. (a) Before etching and (b) after etching.
Download figure:
Standard image High-resolution imageTable II. Results of AES of ETFE sample processed under different pressure conditions.
| Sample | Process pressure (Pa) | C (at.%) | O (at.%) | F (at.%) | Ti (at.%) | Ti/C | Ti/F |
|---|---|---|---|---|---|---|---|
| S1 | 0.5 | 37.3 | 33.2 | 12.0 | 17.5 | 0.47 | 1.46 |
| S2 | 4 | 58.5 | 22.5 | 13.8 | 5.2 | 0.09 | 0.38 |

Download figure:
Standard image High-resolution image
Download figure:
Standard image High-resolution image
Fig. 10. Results of AES. (a) Analysis point of sample S1 and AES spectra profiles of (b) sample S1 and (c) sample S2.
Download figure:
Standard image High-resolution image3.5. Fabrication of ETFE membrane filters
Figures 11(a)–11(c) show a photograph and SEM images of the fabricated ETFE membrane filters. The holes were straight and precisely aligned 380,000 holes each with a diameter of 7 µm covered an area of 13 mm diameter. An example of failure is shown in Fig. 11(d). The etch selectivity of the Ti mask played important roles for the fabrication of through-holes. Inappropriate etching conditions caused the disappearance of the Ti mask after processing, and a rough ETFE surface was obtained. Although lower process pressure condition improves the selectivity of the Ti mask and suppresses sidewall film deposition and delamination, the shape of the back hole was rough. In this study, we choose a lower process pressure condition in order to protect the sidewall deposition from contamination at the genetic analysis.

Fig. 11. Fabricated ETFE membrane filter; (a) Photograph of the fabricated ETFE membrane filter. (b) SEM image of front side. (c) Cross-sectional SEM image. (d) Example of failure SEM image of front side.
Download figure:
Standard image High-resolution image3.6. Cell entrapment
A separation test of CTC model cells spiked into whole blood was performed using our fabricated microfiltration system. Tens of billions of blood cells in 15 mL of sample were able to pass through the filter without clogging, and CTC model cells were trapped on the filter [Fig. 12(a)]. The trapping efficiency of CTC model cells was over 96%. In contrast, almost all leukocytes were depleted [Fig. 12(b)], partly because leukocytes include cells that differ in size and deformability. Our system has potential as a tool for isolating CTCs from whole blood with high efficiency and selectivity.

Download figure:
Standard image High-resolution image
Fig. 12. Results of trapping test. (a) Fluorescent image and (b) trapping efficiency for CTC model cells and leukocytes.
Download figure:
Standard image High-resolution image
4. Conclusions
Optically transparent and extremely low auto-fluorescent ETFE membrane filters with several tens of millions of through-holes were developed by photolithography and plasma etching. The etch selectivity of the Ti mask played important roles in the fabrication of through-holes. The etch byproducts of ETFE in O2 plasma reacted with the Ti surface. The lower fluorine partial pressure condition such as low pressure and large O2 flow improved selectivity. The low pressure condition suppressed sidewall film deposition and delamination. However, the shape of the back hole was rough under low pressure condition. A very high trapping efficiency of over 96% was obtained in the separation test of CTC model cells spiked into whole blood using our fabricated microfiltration system. The method of fabricating device for the size-based capture of rare cells in blood such as CTCs was established in this study.
Acknowledgment
This research was in part supported by the Center of Innovation Program of Nagoya University (Nagoya University-COI) from the Japan Science and Technology Agency (JST).