


Abstract
We present a detailed analysis of the systematic errors that affect single-shot carrier envelope phase (CEP) measurements in experiments with long acquisition times, for which only limited long-term laser stability can be achieved. After introducing a scheme for eliminating these systematic errors to a large extent, we apply our approach to investigate the CEP dependence of the yield of doubly charged ions produced via non-sequential double ionization of argon in strong near-single-cycle laser pulses. The experimental results are compared to predictions of semiclassical calculations.
Export citation and abstract BibTeX RIS

Content from this work may be used under the terms of the Creative Commons Attribution-NonCommercial-ShareAlike 3.0 licence. Any further distribution of this work must maintain attribution to the author(s) and the title of the work, journal citation and DOI.
1. Introduction
The electric field of a short laser pulse can be described as E(t) = E0 cos2(t/τ) cos(ωt + ϕ), where E0 is the field amplitude, ω is the carrier frequency, τ is the pulse duration and ϕ is the carrier envelope phase (CEP). When the pulse duration enters the few-cycle regime, the value of the CEP strongly influences the temporal shape of the electric field. For frequencies in the visible range, the control of the CEP allows shaping the electric field waveform on attosecond timescales [1, 2] and allows efficiently control of ultrafast strong-field-driven electron dynamics [3–5].
Except for some intrinsically CEP-stable optical parametric chirped pulse amplification systems [6], where the CEP was demonstrated to remain stable for many hours [7], the CEP of pulses generated in few-cycle laser systems that are not actively CEP stabilized is changing from pulse to pulse, impeding exact knowledge of the temporal shape of the electric field E(t). Stabilization of the CEP usually involves feedback loops to actively control the dispersion inside the laser oscillator [8]. Such active stabilization schemes, however, are very sensitive to small drifts in the laser parameters, and only practicable for a few hours, thus precluding measurements with long acquisition times.
A way around the difficulties related to active CEP stabilization is the recently introduced single-shot phase-tagging technique [9–11], where instead of being stabilized the CEP is measured for every single laser shot. In this way, each laser pulse and all physical quantities measured synchronously on a single-shot basis can be tagged with the CEP of the pulse. Recently, the combination of phase tagging with a coincidence spectroscopy technique [12] allowed the gaining of new insights into the attosecond dynamics of the non-sequential double ionization (NSDI) of argon atoms exposed to few-cycle [13] and near-single-cycle [14] laser pulses. NSDI of atoms [15] is characterized by the correlated emission of two electrons. According to the present understanding, a first electron liberated from the atom via tunnel ionization triggers the ionization of a second electron by laser-induced recollision with the parent ion. While the intensity dependence of NSDI yields in the long pulse regime has been investigated in numerous experimental and theoretical studies [15], only a limited number of experimental [12] and theoretical [16, 17] studies have addressed the CEP dependence of the total NSDI yield. The results of [16] indicate that the CEP dependence of the NSDI yield increases with the peak intensity of the laser. However, a more recent work [17] based on the use of refined inelastic scattering cross-section predicts a decrease of the CEP dependence with increasing intensity. Both theoretical studies are in reasonable agreement with the experimental data at about 1.8 × 10¹⁴ W cm−2 reported by Johnson et al [12]. From the experimental point of view, the precision of this initial measurement [12] was limited by unavoidable long-term drifts of the laser parameters such as peak intensity, beam pointing or beam profile. In the present study we show how CEP tagging is affected by such drifts and quantify the systematic errors they introduce to the measurement. We then present a scheme for minimizing the effects of slow laser drifts and apply it to re-inspect the experimental results of [12] and further investigate the CEP dependence of the NSDI yield from argon as a function of intensity.
2. Experimental approach
The experimental setup used in the present study is described in detail in [12]. Briefly, linearly polarized near-single-cycle laser pulses (full-width at half-maximum of the intensity envelope of 4 fs) with a carrier wavelength of 750 nm are generated at a repetition rate of 3 kHz or 10 kHz in an amplified laser system [18].
A fraction of the laser beam is focused with a spherical mirror (f = 25 cm) into a cold supersonic gas jet of argon atoms in the center of a reaction microscope (REMI) [19]. Ions and electrons generated in the laser focus are directed by weak electric and magnetic fields towards time- and position-sensitive detectors on either side of the REMI. The 3D momentum vectors of the fragments are reconstructed from their time of flight (TOF) and impact position on the detectors.
Another fraction of the laser beam (25 μJ) is focused into a single-shot stereographic above-threshold ionization (Stereo-ATI) phase-meter [9]. There the TOF spectra of electrons produced via above-threshold ionization of xenon are recorded to the left and right of the focus along the laser polarization direction. The CEP is inferred from the asymmetry between the left and the right TOF spectra. The basic principle of CEP retrieval is illustrated in figure 1. A more detailed description of the stereo-ATI phase-meter can be found in [20] and references therein. In figure 1(a), the left–right asymmetry of the photoelectron yield is plotted as a function of TOF and CEP. In the stereo-ATI phase-meter the ionization yield is integrated over two regions Rx and Ry (denoted by the dashed lines in figure 1(a)) of the left and right TOF spectra to calculate the asymmetries Ax/y for each region Rx/y as

Here, Nleft,x/y (Nright,x/y) are the photoelectron yields in the left (right) TOF spectrum integrated over Rx/y. Plotting Ay versus Ax yields the parametric asymmetry plot (PAP) shown in figure 1(c). The polar angle θ in the PAP defined as  is related to the CEP ϕ via a continuous monotonic function ϕ(θ). The function ϕ(θ) is determined using the fact that the CEP of laser pulses from a kHz pulse train is uniformly randomly distributed when the laser is not CEP-locked [21]. In practice, the polar angle θ of a PAP with N entries is discretized to form b intervals [θk,θk + Δ(θk)], each containing the same number n = N/b of entries. The discrete angles θk are calculated as
  , where (Ax,k, Ay,k) are the coordinates of the entry with the smallest angle θ in the interval k. By construction, the steps Δ(θk) = θk+1 − θk correspond to equidistant steps Δϕ in CEP. Finally, the continuous function ϕ(θ) is obtained by interpolation of the values ϕ(θk) = k2π/b. Note that the CEP measured with the stereo-ATI phase-meter is only determined up to a constant offset [20].
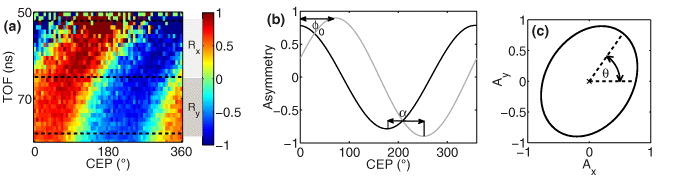
Figure 1. (a) Example of an asymmetry map obtained by plotting the left–right asymmetry of the single ionization yield of a rare gas as a function of TOF and CEP. In this specific example we present a REMI measurement of argon exposed to 4 fs laser pulses with a peak intensity of (2.6 ± 0.4) × 1014 W cm−2. Replacing argon by xenon would lead to qualitatively very similar results. The dashed lines mark the two TOF regions Rx and Ry over which the ionization yields in the left and right TOF spectra are integrated to calculate the CEP-dependent asymmetries Ax and Ay plotted as gray and black curves in panel (b), respectively. The parameter α denotes the phase shift between the two asymmetry curves Ax and Ay and ϕ0 denotes the common phase offsets of Ax and Ay. Plotting Ay versus Ax for all CEPs yields the PAP shown in panel (c).
Download figure:
Standard image3. Effect of slow laser parameter drifts on carrier envelope phase measurements
In order to avoid saturation of the data acquisition system, only the data from laser pulses leading to a detected ionization event in the REMI were acquired. In the initial experiment [12], the function ϕ(θ), relating the polar angle of the PAP to the CEP, was determined using a reference PAP, i.e. a PAP recorded independently of the REMI data acquisition just before the beginning of the experiment. This prevents any bias of the function ϕ(θ) by our trigger scheme. NSDI events in this initial experiment were recorded over 3.5 h. In experiments with much longer acquisition times, slow drifts of the laser parameters, unaccounted for by the single reference PAP scheme, become problematic as they lead to distortions of the PAP. In order to discuss the distortions of the PAP we introduce the phase density

where N(ϕ) is the number of laser shots with a CEP ϕ in [ϕ,ϕ + dϕ] measured by the stereo-ATI phase-meter and N0 is the total number of laser shots. Equivalently, the ρ(ϕ) can be calculated as

where ϕref(θ) was determined using a reference PAP measured at the beginning of the experiment. For non-CEP-locked pulses, a constant phase density of ρ(ϕ) = 1 is expected in an ideal experiment. Drifts of the laser parameters, however, introduce modulations of the measured phase density as demonstrated in figure 2, where we show the evolution of ρ(ϕ) over the course of an experiment lasting 19 h (amounting to about 2 × 10⁸ laser shots). The phase density is not constant over time and exhibits strong deviations from 1 even though these changes correspond to only small variations in the shape of the PAP as shown in figure 2(b), where a PAP with 20 000 laser shots is displayed at the beginning and the end of the experiment. The observed modulations of ρ(ϕ) are likely to be caused by variations of the laser intensity.

Figure 2. (a) Evolution of the phase density over the course of 19 h. The changes in the shape of the PAP with time are reflected by the appearance of inhomogeneities in the phase density. (b) The PAP measured by the stereo-ATI phase-meter at the beginning (solid) and the end (dashed) of the experiment. Here, the angle and radius were averaged over 200 adjacent points.
Download figure:
Standard imageIn order to quantitatively investigate how distortions of the PAP affect the CEP measurement, we describe the asymmetries Ax(ϕ) and Ay(ϕ) by

which is a parametric equation of an ellipse centered at the origin. Changes of the laser parameters affect not only the asymmetry amplitudes ax and ay but also the parameters ϕ0 and α. This is illustrated in figure 3(a), where schematic asymmetry maps are shown for two laser intensities. The maxima (red) and minima (blue) of the asymmetry are displayed as a function of TOF (solid line for the lower intensity and dashed line for the higher intensity). While a change in the CEP offset ϕ0 affects the phase tagging of the quantities measured in the experiment, it has no effect on the shape of the PAP, so it cannot be determined from the PAP alone. Any laser parameter drift will thus result in a transformation of the initial PAP into another ellipse centered at the origin with (−1 ⩽ Ax,Ay ⩽ 1).
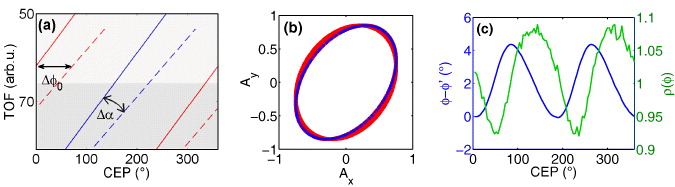
Figure 3. Illustration of the effect of intensity drifts on the CEP measurement. (a) Schematic asymmetry maps of ionization yields for two different intensities. The solid (higher intensity) and dashed (lower intensity) lines indicate the maxima (red) and minima (blue) of the asymmetry. The shaded areas represent the two TOF regions Rx, Ry used to calculate the asymmetries Ax and Ay. Δϕ0 denotes the shift of the parameter ϕ0 induced by an intensity change in the stereo-ATI phase-meter. The notation Δα indicates the change in slope between the solid and dashed lines that is causing a variation of α. (b) Simulated set of distorted PAPs (red). The initial (reference) PAP is shown in blue. The variations of the parameters ax, ay and α (defined in the text) used to calculate the distorted PAPs were inferred from experimental data where the intensity slowly decreased by 7%. (c) The CEP error and the resulting phase density for the distorted PAP when the conversion function ϕ(θ) is determined from the reference PAP of panel (b).
Download figure:
Standard imageTo give a concrete example, we simulate the effect of parameter drifts that correspond to realistic experimental conditions. In the first step we calculate an initial PAP (blue dots in figure 3(b)) using the parameters ax = 0.75, ay = 0.85, α = 67° and a set of uniformly distributed CEP values ϕk (k = 1,...,360). The conversion function ϕ(θ) is determined from
In the next step, modified PAPs (red dots in figure 3(b)) are calculated by gradually changing the PAP parameters to a'x = 0.79, a'y = 0.89 and α' = 75°. Applying ϕ(θ) to the polar angles
obtained from the modified PAP yields the apparent CEP ϕ'k = ϕ(θ'k).
Figure 3(c) shows the CEP error Δϕk = ϕ'k − ϕk (blue line) and the phase density ρ(ϕ'k) (green line) of the modulated PAP as a function of ϕk. The error Δϕk oscillates around a generally non-zero value but remains of the order of only a few degrees. In contrast, these relatively small distortions of the PAP strongly affect the phase density. The apparent yield  of ions of the species X relates to ρ(ϕ) as
where YX(ϕ) is the true (CEP-dependent) ionization yield of X. Therefore, the relative error of the measured CEP-dependent ionization yield is
The retrieval of CEP dependences of ionization yields thus requires ρ(ϕ) − 1 to be much smaller than the expected modulations of YX(ϕ). To demonstrate how modulations of ρ(ϕ) can hamper the measurements of YX(ϕ), the apparent CEP-dependent yield Y 'Ar+(ϕ) of Ar+ ions measured in our experiment is shown along with the calculated CEP dependence of the Ar+ yield in figure 4.

Figure 4. Apparent CEP-dependent yield of Ar+ ions generated in 4 fs laser pulses with a central wavelength of 750 nm and a peak intensity of 3.0 × 10¹⁴ W cm−2 (open circles). The solid line represents the calculated CEP dependence of the Ar+ yield for the experimental laser parameters using a semi-classical approach. For visual convenience, the modulations of the predicted curve are multiplied by a factor of 30.
Download figure:
Standard imageA solution to minimize the modulations of ρ(ϕ) is provided by updating the function ϕ(θ) in sufficiently small time intervals throughout the measurement. Based on the results of our calculations we neglect the CEP dependence of the single ionization yield of argon and use the subset of laser shots for which an Ar+ ion was detected to update ϕ(θ). In the present case, ϕ(θ) was updated every 30 min each time using 1 million laser shots.
Although updating ϕ(θ) reduces the modulations of ρ(ϕ) to a large extent, this scheme cannot correct for the shift Δϕ0 of the CEP offset. In our experiment we measure a new asymmetry curve for Ar+ every 30 min and observe CEP shifts of a few degrees between two such curves. Similarly to the phase density, the shifts of the CEP evolve over the course of hours and reach values up to 10° in the present experiment. Using the Ar+ asymmetry curves measured at regular time intervals during the experiment, CEP offset variations can be corrected.
We would like to remark that our method can be applied to reduce the impact of laser fluctuations with frequencies smaller than 0.1 Hz. A stabilization scheme such as that demonstrated in [22] would allow one to further improve the precision of CEP tagging by reducing the effects caused by much faster power fluctuations.
4. Carrier envelope phase dependence of the non-sequential double ionization yield
The strength of our improved analysis is demonstrated in figure 5, where we compare CEP-dependent yields of doubly charged argon ions obtained with (green crosses) and without (red line) a continuous update of the function ϕ(θ). It can be clearly seen that for the data presented in figure 5(a), recorded over 19 h, the improved analysis becomes indispensable for obtaining a meaningful result. The result of the new analysis of the data obtained in the initial proof-of-principle experiment [12] is shown in figure 5(b). Since the Ar+ ions were not recorded in that experiment, we used the background of singly ionized H2O to update the function ϕ(θ). Because the data were acquired for only 3.5 h, there is still qualitative agreement between the results of both analyses. However, even for this rather short acquisition time, systematic errors in the CEP measurement considerably affect the experimental result, precluding a quantitative comparison with theoretical results. With our improved analysis these errors can now be eliminated to a large extent. The results of both experiments indicate that for both the presented data sets, the modulation of the normalized NSDI yield

is consistent with sinusoidal model functions

where ϕY is a CEP offset and ANSDI is the modulation amplitude of the oscillation.
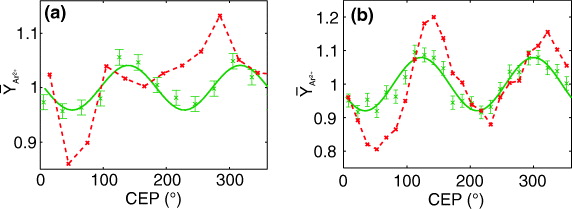
Figure 5. CEP-dependent yields of doubly charged argon ions obtained with (green crosses) and without (red line) a continuous update of the function ϕ(θ). The solid green lines represent a sinusoidal model function:  , where ϕY
is a CEP offset and ANSDI is the modulation amplitude of the oscillation. (a) For the 19 h long measurement described in the text. (b) For the data from [12]. The red line represents the Ar2+ yield obtained by the previous (uncorrected) analysis.
, where ϕY
is a CEP offset and ANSDI is the modulation amplitude of the oscillation. (a) For the 19 h long measurement described in the text. (b) For the data from [12]. The red line represents the Ar2+ yield obtained by the previous (uncorrected) analysis.
Download figure:
Standard imageModulation amplitudes of (4.8 ± 0.8) and (8.0 ± 0.6)% are found for the CEP-dependent yield shown in figures 5(a) and (b), respectively.
In the following, we apply our new scheme to investigate the dependence of ANSDI on the laser intensity.
In figure 6, we compare the measured values for ANSDI obtained from the double ionization of argon with 4 fs laser pulses at intensities ranging from about 0.2 to 0.4 PW cm−2 with the predictions of semiclassical calculations that are described in the appendix. The peak intensity of the laser pulses was determined from the width of the Ar+ momentum spectra. In the intensity range under study, we clearly observe a decrease of ANSDI with increasing intensity up to about 4 × 10¹⁴ W cm−2 where no significant CEP dependence of the NSDI yield was observed. Our experimental results and calculations thus confirm the predictions reported in [17]. While our model correctly predicts the slope of the intensity-dependent modulation amplitude ANSDI, the absolute values for ANSDI differ from the measured ones by a constant offset of about 5%. While at first glance the discrepancy would also be explained by a systematic underestimation of the measured intensity, we believe that this hypothesis is rather unlikely. Instead, it is more probable that the disagreement is due to the limitations of the semiclassical model. Further investigations are required to elucidate the exact reasons for the observed discrepancies.
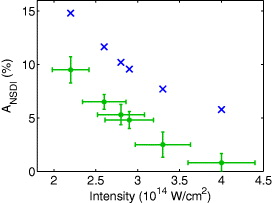
Figure 6. Measured (green dots) and calculated (blue crosses) CEP-induced modulation amplitudes ANSDI of the NSDI yield of Ar in 4 fs laser fields of different intensities. Each point represents the ratio of the amplitude of the modulation to the CEP-averaged NSDI yield at a specific intensity. The y-errors are statistical error bars of the NSDI yield modulations. The x-error is an estimated 10% uncertainty in the intensity determination.
Download figure:
Standard image5. Conclusion
In conclusion, we have presented a detailed analysis of systematic errors in single-shot CEP measurements with a stereo-ATI phase-meter. We demonstrated that these errors, which are essentially due to slow drifts of the laser intensity, can dramatically affect the results of phase-tagged ionization yield measurements with long acquisition times. We showed how these systematic errors can be eliminated to a large extent in spite of the unavoidable slow drifts of the laser parameters and applied our new scheme to retrieve the accurate CEP dependence of the total NSDI yield of argon at various intensities. While the measured intensity dependence of the CEP-induced modulation amplitude is qualitatively reproduced by our classical calculations, more involved theoretical models are certainly needed to reach quantitative agreement with the experimental data.
Acknowledgments
We acknowledge Ferenc Krausz for his support and for making specialized equipment available to us. We are grateful for support from the DFG via Kl-1439/2, Kl-1439/3, Kl-1439/5 and the Cluster of Excellence: Munich Center for Advanced Photonics (MAP). We acknowledge support from the EU via the ITN ATTOFEL and LaserLab Europe. NGJ and MFK were partially supported by the Chemical Sciences, Geosciences, and Biosciences Division, Office of Basic Energy Sciences, Office of Science, US Department of Energy under DE-FG02-86ER13491 and the National Science Foundation under CHE-0822646 and EPS-0903806.
Appendix.: Theoretical modeling
The semiclassical calculations used for describing our experimental data are outlined in our previous study [14]. It was shown there that the experimental results for NSDI in argon are well described by the rescattering-induced excitation and subsequent ionization mechanism. Briefly, tunnel ionization rates are calculated using a corrected Ammosov–Delone–Krainov (ADK) formula [24, 25] that adequately accounts for over-the-barrier ionization [23]:

Here, wADK is the instantaneous ADK rate, IP the ionization potential, E(t) the electric field of the laser, Z the charge of the parent ion and α a numerical factor adjusted such that the rate, w(t), fits the result obtained by solving the Schrödinger equation numerically. The value of parameter α is 9 for Ar and 8 for Ar+ [23]. After tunnel ionization at t = t0, the electron is propagated as a free classical particle in the electric field of the laser. Upon recollision at t = t1, the parent Ar+ ion is assumed to be instantaneously excited to its lowest excited state, Ar+*: [Ne]3s13p6, provided the recolliding electron carries enough energy for the excitation (13.5 eV). The electron energy dependence of the excitation cross-section is neglected. A second electron is then emitted from the excited ion in another tunneling process described by the corrected ADK formula using the appropriate parameters for the excited Ar+ (IP = 14.1 eV , Z = 2, α = 8) ion. The final momenta of the electrons are calculated for every initial ionization time t0. The CEP-dependent single and double ionization yields of argon are obtained by performing the calculations for different CEPs. Focal volume averaging and depletion of the Ar and Ar+* populations are taken into account.