


Abstract
The nitrogen–vacancy centre (NV) has drawn much attention for over a decade, yet detailed knowledge of the photophysics needs to be established. Under typical conditions, the NV can have two stable charge states, negative (NV−) or neutral (NV0), with photo-induced interconversion of these two states. Here, we present detailed studies of the ionization dynamics of single NV centres in bulk diamond at room temperature during illumination and its dependence on the excitation wavelength and power. We apply a recent method which allows us to directly measure the charge state of a single NV centre, and observe its temporal evolution. We find that the steady-state NV− population is always ⩽75% for 450–610 nm excitation wavelength. In combination with saturation measurements, we show that the optimal excitation wavelength is around 510–540 nm. Furthermore, the relative absorption cross-section of NV− is determined for 540–610 nm, revealing a double-peak structure. Finally, the energy of the NV− ground state of 2.6 eV below the conduction band is measured. These results reveal new insights into the charge state dynamics of the NV centre.
Export citation and abstract BibTeX RIS

Content from this work may be used under the terms of the Creative Commons Attribution-NonCommercial-ShareAlike 3.0 licence. Any further distribution of this work must maintain attribution to the author(s) and the title of the work, journal citation and DOI.
GENERAL SCIENTIFIC SUMMARY Introduction and background. The nitrogen–vacancy (NV) defect centre in diamond is a single photon emitter that is associated with an electron and a few nuclear spins. The spin states can be initialized and read out optically on the single level. The long coherence lifetimes of these spin states enable the use of NV centres for instance as magnetic and electric field sensors under ambient conditions. Furthermore their potential as quantum bits has been demonstrated in the recent years. The NV defect mainly occurs in two different charge states: the negative and the neutral one. It is the negatively charged NV defect that is used for all mentioned applications. In this work the optically induced dynamics between the two charge states is examined with different methods and with emphasis on its dependence on excitation wavelength and power.
Main results. One of the main results is the experimental proof that a recently observed 'dark' state of the NV defect is indeed its neutral charge state. Upon illumination, continuous ionization and recombination processes occurr. The rates of these processes depend on the excitation wavelength and power. The optimum wavelengths to gain maximum NV minus population were determined. Additionally, the transition from one-photon ionization to two-photon ionization was observed by varying the excitation laser light from the blue to the green spectrum. This change in the ionization process revealed the energy level of the ground state of NV minus within the bandgap of diamond.
Wider implications. This work has revealed many new insights into the photophysics of NV defects. With its detailed study of switching behaviour between the two charge states it has provided the recipes for implementing methods like Photoactivation Localization Microscopy (PALM) or Stochastic Optical Reconstruction Microscopy (STORM) with NV centres which enables us to resolve single NV's below the sub-diffraction limited area. Additionally high fidelity charge and spin state initialization can now be performed which is crucial for quantum information applications but also for quantum metrology.
1. Introduction
The interesting features of the negatively charged NV− centre are high and stable fluorescence, optical spin state detection, long spin coherence times and coherent control of surrounding nuclear spins via hyperfine interaction [1–5]. Promising applications are its use as fluorescence markers [6–8], nanoscale magnetic and electric field sensing [9–12], quantum information processing [13–16] and fundamental studies of spin bath physics [17, 18]. For all these applications, the understanding and control of the nitrogen–vacancy (NV) centre charge dynamics is important.
The NV consists of a substitutional nitrogen atom and an adjacent vacancy in the diamond carbon lattice. Its electronic structure is built from three carbon dangling bond electrons, two electrons from the nitrogen lone pair orbital for the neutral charge state NV0 and one more electron for the negative charge state NV−. The zero-phonon line of NV− is at 637 nm, and phonon-assisted sidebands of the fluorescence extend up to 800 nm. The spectrum of NV0 has a zero-phonon line at 575 nm and also exhibits strong Stokes shifted vibronic bands. Both charge states can be observed in diamond. Our current understanding of the photochromism of the NV is schematically shown in figure 1(a) [19–21]. Figure 1(b) shows real-time monitoring of the charge state, which we use to analyse the ionization dynamics [22].
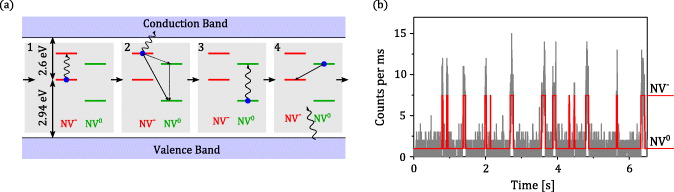
Figure 1. (a) Schematic illustration of the photo-induced ionization and recombination of NV−, showing the ground and excited states of both NV− and NV0. The determination of the ionization energy of 2.6 eV and the recombination energy of 2.94 eV is shown in figure 6. Ionization process: 1—NV− is excited by one photon. 2—A second photon excites one electron from the excited state of NV− into the conduction band, creating NV0. The NV will end up in the NV0 ground state, either directly after the ionization or possibly via the excited state and subsequent, fast decay. Recombination process: 3—NV0 is excited. 4—An electron is captured from the valence band, forming NV−. (b) Time trace of the fluorescence of a single NV under continuous illumination with 593 nm, 1 μW laser light, showing a state of the NV with very low count rates (which turns out to be NV0). The red line is the most likely fluorescence level of the NV, obtained by a hidden Markov model. Here, the lifetimes of the two charge states are 56.6 ms (NV−), 465 ms (NV0), and the fluorescence levels are 2.2 counts ms−1 (NV−) and 0.3 counts ms−1 (NV0).
Download figure:
Standard imageSo far, the wavelength and power dependence of the photo-induced ionization and recombination of NV− have only been investigated partly [6, 19–27]. Pumping NV− into an unknown dark state under red illumination was used for high-resolution microscopy in [6]. By single-shot nuclear magnetic resonance (NMR) measurements on single NV−, it was found that under the typically used 532 nm illumination, NV− is with 30% probability in this dark state, which was proposed to be NV0 [19]. Here, we will provide further evidence that the unknown dark state is indeed the neutral charge state NV0.
The experiments were performed using a homebuilt confocal microscope and measuring the NV fluorescence either by an avalanche photodiode (APD) or a spectrometer. We used a pulsed supercontinuum laser (SC400-4-PP system from Fianium) with 40 MHz repetition rate combined with an acousto optic tunable filter to select the desired wavelength. The resulting spectrum had a width of about 4 nm around the selected wavelength. Additionally, a 532 nm and a 594 nm diode-pumped solid-state (DPSS) lasers were used. All lasers were focused onto a diffraction-limited spot. The samples used were ultrapure IIa-type chemical vapour deposition diamonds. For our measurements, we use single-shot NMR [13] and single-shot charge state detection [22].
This paper is organized as follows. In section 2, we show that the above-mentioned dark state of NV− is indeed the neutral NV0, as recently proposed. In section 3, we investigate the photo-induced ionization and recombination dynamics depending on excitation wavelength and power. With this, we can determine the excitation spectrum of NV− and the steady-state population of the two charge states. In section 4, the steady-state population of NV− is measured over a broad spectral range of the excitation wavelength. Together with the results from section 3, we find that the population is always ⩽75%. Additionally, we determine the fluorescence saturation behaviour of NV−, which, combined with the population of NV−, yields the optimal excitation wavelength. This is found to be around 510–540 nm. Finally, in section 5, the ionization and recombination energies of NV− are determined.
2. The nitrogen–vacancy (NV) 'dark state' is NV0
As mentioned above, red light excitation pumps the NV centre into a non-fluorescing state called the 'dark state', which can live up to hundreds of seconds [6]. This dark state was later examined by single-spin NMR experiments [19]. Its nuclear magnetic moment and the according hyperfine interaction lead to a unique NMR fingerprint which among other aspects indicates that the dark state indeed could be the neutral charge state of the NV defect. Red light cannot excite NV0 which fits the observation. Green light, on the other hand, can excite NV0 with subsequent fluorescence fingerprint. Surprisingly, it was found that the NV centre resides in the dark state during green excitation for ≈30% of the time without an observable fluorescence fingerprint [19]. This last point prevents a rigorous assignment of the dark state (NMR fingerprint) to NV0 (fluorescence fingerprint).
The situation changes when the excitation wavelength is varied over a wide range and fluorescence spectra are measured. We find that excitation with blue light (440 nm) populates the neutral charge state and leads to NV0 fluorescence. At these wavelengths, the emission of NV0 is increased, whereas nearly no emission of NV− is observable, see figure 2(a). Later in section 5, we will see that this is due to one-photon ionization of NV−. In the following, we will show that blue light (populating NV0) and red light (populating the dark state) yield the same electronic state. As explained in [19], we can use single-shot NMR (see [13]) on the NV's nitrogen nuclear spin to probe the population of an electronic state of the NV. This is because the energy splitting of the nuclear spin depends on the hyperfine interaction to the NV electron spin and the quadrupole interaction of the nucleus, which both depend on the electronic wave function being different for NV− and NV0. The probability to flip the nuclear spin at a transition frequency corresponding to a certain electronic state depends on the population of this state. The NMR measurement sequence is shown in figure 2(b). Figure 2(c) shows NMR spectra for the 14N nuclear spin transition in the NV− ground state and unknown dark state after green (532 nm) illumination, with different transition frequencies. We then apply blue (440 nm) and red (625 nm) illumination before the NMR pulse, and afterwards measure the probability that the nuclear spin is flipped at the transition frequency corresponding to the dark state. The resulting NMR spectra are shown in figure 2(d). We find that both red and blue illumination populate this state. In summary, blue light illumination yields the fluorescence fingerprint of NV0 and the NMR fingerprint of the dark state, which is why we identify the dark state as NV0.
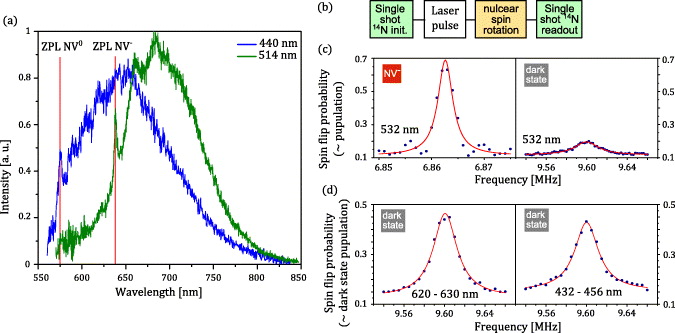
Figure 2. (a) Emission spectra of a single NV by illumination with 440 nm (yielding the spectrum of NV0) and 514 nm (yielding the spectrum of NV−). Both spectra are normalized to have the same area. (b) Measurement sequence for (c). First, a single-shot measurement determines the state of the nitrogen nuclear spin. Then, a variable laser pulse is applied. The nuclear spin state is very robust with respect to excitation and ionization of the NV, and survives these processes. The following RF pulses flip the nuclear spin if it is in resonance with a nuclear spin transition, which depends on the electronic spin state. Finally, the state of the nuclear spin is measured. Comparing the initial and final measurement yields the probability to flip the nuclear spin. Further details can be found in [19]. (c) NMR spectra for green (532 nm) illumination, for a transition ( ) in the NV− ground state (left) and in the unknown dark state (right). Here, no extra laser pulse with 532 nm was applied, because the nuclear spin state measurement includes these pulses. (d) NMR spectra for red (625 nm) and blue (440 nm) illumination. For 620–630 nm, the laser power was 20 μW and the pulse length 2 ms. For 432–456 nm, it was 20 μW for 10 ms. The red lines are Lorentzian fits. Note that for this transition, there is fast homogeneous dephasing, and at most 0.5 spin flip probability can be achieved for 100% population of the corresponding electronic state [19].
Download figure:
Standard image3. Ionization dynamics
To gain further insight into the photo-induced ionization and recombination of NV−, we perform real-time monitoring of the NV charge state by measuring NV fluorescence [22]. It is our goal to be able to distinguish the emission of the two different charge states. As can be seen in the emission spectra for wavelengths longer than 650 nm the fluorescence emission is mainly coming from NV−. Hence we use a 650 nm long pass filter to mainly detect emission from NV−. Additionally, for photon energies less than the zero phonon line of NV0 (i.e., λ > 575 nm), excitation of NV0 is hardly possible. Hence, almost no NV0 fluorescence is detectable. Therefore, NV− will give a high fluorescence signal, whereas NV0 will result in low count rates. An example time trace of the NV− fluorescence for illumination with 1 μW of 593 nm light is shown in figure 1(b). This real-time monitoring of the NV charge state is only possible if the photon count difference from NV− and NV0 is larger than the photon shot noise, which is the case for low power illumination. The ionization and recombination rates, rion and rre, respectively, both depend quadratically on the excitation power I:


The NV− fluorescence Fl, on the other hand, depends linearly on the power in this low excitation power regime (data not shown):

Effectively, the average number of photons we detect from NV− before it is ionized (i.e. photons per burst, ppb) is

It increases linearly with decreasing power. For illumination powers of ∼1 μW, ionization and recombination rates become so slow that we can clearly observe photon bursts corresponding to the NV centre being in the negative charge state and low fluorescence intervals corresponding to the neutral charge state 1(b). To analyse the ionization dynamics, we use a hidden Markov model with two possible fluorescence levels, which yields the most likely state evolution, and also the corresponding lifetimes and transition rates [28].
Summarizing, we wish to highlight the importance of seeing single-photon bursts for our further analysis (e.g. the intrinsic absorption cross-section). In all the previously performed experiments with single NV centres or ensembles the observed fluorescence has always been a time-averaged value [21, 29]. The NV centres are always dynamically switching between negative and neutral charge states. Hence, previous averaged count rates would correspond to an averaging over photon burst intervals and low fluorescence intervals in our experiment. Therefore, information about ionization and recombination is hidden and the given averaged fluorescence count rates are not only affected by the absorption cross-section and the illumination power but most importantly also by ionization and recombination rates. As an example, a very low recombination rate will lead to a very low averaged fluorescence because the NV centre resides a substantial amount of time in the low fluorescent neutral charge state even if the absorption cross-section and the corresponding fluorescence level during photon bursts are high. In contrast, we are able to analyse exclusively the photon bursts whose fluorescence level is only dependent on absorption cross-section and illumination intensity. There is no charge state switching during a photon burst or during a low fluorescence interval.
3.1. Power dependence
First, we performed real-time monitoring of the charge state (cf figure 1(b)) for varying the excitation power from 0.5 to 6 μW for 560 and 593 nm excitation wavelength. Figure 3(a) shows the ionization and recombination rates for these illumination parameters. The curves show the expected quadratic behaviour for low excitation power for both wavelengths. In figure 3(b), we calculate the population of NV− for measurements made at varying laser power by detailed balance as

Note that the transition rates rre and rion are the inverse lifetimes of the respective charge states. The population is nearly independent of the power, because both rates (ionization and recombination) have a quadratic dependence.
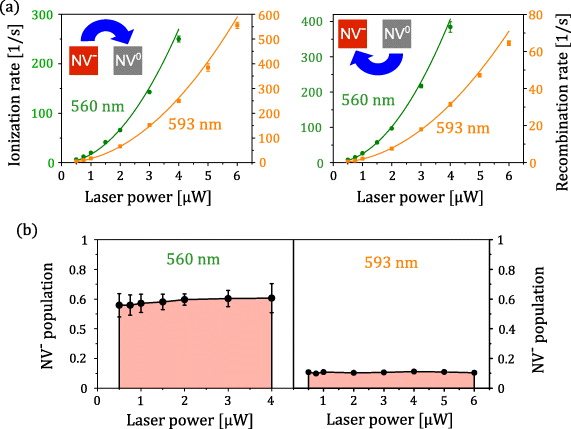
Figure 3. (a) Power dependence of the ionization and recombination rates for 560 and 593 nm illumination wavelength. The solid lines are fits with quadratic power dependence, rate(I) = aI2, where I is the laser power. (b) Probability to be in NV− plotted against the illumination power for 560 and 593 nm.
Download figure:
Standard image3.2. Wavelength dependence
Real-time monitoring of the charge state for different excitation wavelengths ranging from 540 to 610 nm (fixed excitation power of 1 μW) yields the intrinsic absorption cross-section of NV− and the population ratio of NV− to NV0 for the first time as discussed above. For wavelengths shorter than 540 nm, fluorescence of NV− and NV0 cannot be resolved, because the fluorescence contrast as well as the charge state lifetimes decrease. For wavelengths longer than 610 nm, the recombination rate from NV0 to NV− becomes too small.
Figures 4(a) and (b) show the ionization and recombination rates depending on the illumination wavelength. For the recombination rate shown in figure 4(b), we find a local maximum at 575 nm, which is the zero phonon line of NV0. This is as expected, as recent low-temperature studies have shown that for the recombination process, first NV0 has to be excited and then an electron from the valence band is captured [20, 21], see figure 1(a). Another possible recombination process is ionization of the surrounding traps [30], which becomes dominant above 575 nm. For shorter wavelengths, the recombination rate increases, probably due to increased absorption of NV0 into the phononic sideband of its excited state, with a maximum at 550 nm. The ionization rate in figure 4(a) shows two maxima at 550 and 590 nm. As explained in the following, this results mainly from the absorption cross-section of NV−, i.e. due to the increased excitation rate of NV− at these wavelengths.
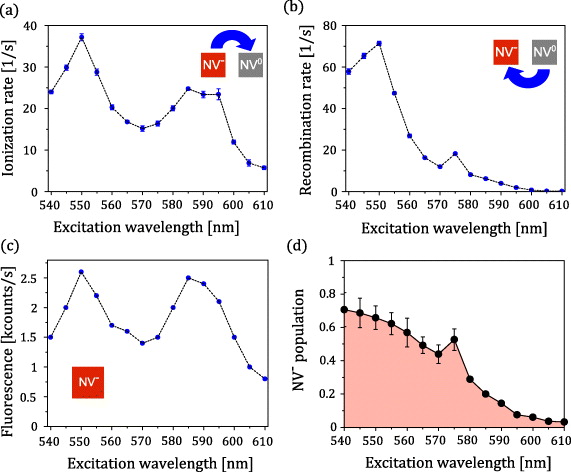
Figure 4. The results obtained from the ionization dynamics with varied excitation wavelength at a fixed power of 1 μW. (a) Ionization and (b) recombination rates. (c) Fluorescence of NV−. Because the power is fixed, this is proportional to the absorption cross-section of NV−. (d) Probability to be in NV− during illumination. The local maximum at 575 nm is at the zero phonon line of NV0.
Download figure:
Standard imageIn the example fluorescence time trace shown in figure 1(b), high fluorescence indicates emission from NV− only. This means that the obtained fluorescence level is directly proportional to the excitation efficiency (absorption cross-section) of NV−. In contrast to this, for high power illumination the real-time monitoring of the charge state is not possible, and the observed fluorescence of the NV would be a mixture of the two charge states NV− and NV0. The fluorescence excitation efficiency of NV− in figure 4(c) also shows two maxima at 550 and 585–590 nm, similar to the ionization rate. Note that the curve does not resemble the mirrored fluorescence spectrum of NV− shown in figure 2(a). The double peak structure could result from differing vibrational modes in the ground and excited states or possibly from a second electronically excited state involved in the excitation process [31].
Another important point is the population pNV− of NV− during illumination, because this is the desired charge state for most applications. This can be calculated according to (5). The result is shown in figure 4(d). We can see that pNV− decreases for increasing wavelength above 540 nm, with a local maximum at 575 nm due to the decreased lifetime of NV0. Populating NV− with >75% probability cannot be achieved at these wavelengths.
4. NV− population and saturation behaviour
To obtain the population of NV− for shorter wavelengths than 540 nm, we use a single-shot charge state detection method [22]. As explained above and shown in figure 1(b), low power illumination allows direct observation of the NV's charge state. By properly choosing the wavelength, power and duration of a single laser pulse, the number of fluorescence photons counted during this pulse allows single-shot determination of the charge state. The histogram of many such measurements shows two Poisson distributions corresponding to the fluorescence of NV0 and NV−, see figure 5(b). By applying an arbitrary laser pulse before making this charge state measurement, we can measure the probability to be in NV− after this laser pulse, as shown in figure 5(a). By fitting two Poisson distributions with variable weights/areas Ai to the histogram, the ratio of this areas yields the NV− population

where ANV− and ANV0 are the areas of the Poissonian fit functions for the negative and neutral charge state, respectively. Note that the first laser pulse in sequence (figure 5(a)) must be long enough to reach a steady-state population of the two charge states.
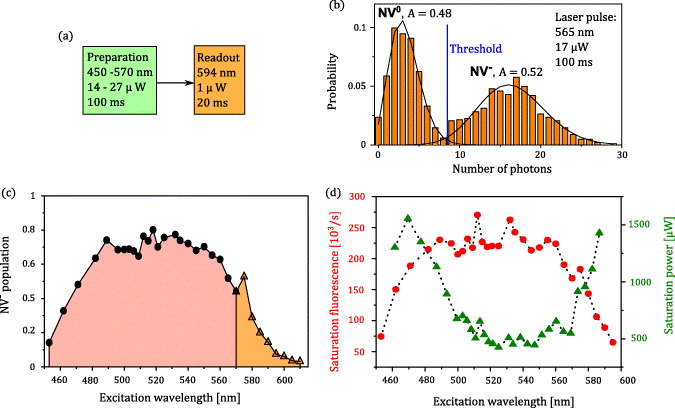
Figure 5. (a) Pulse sequence for measuring the probability to be in NV− for arbitrary illumination. The first laser pulse populates NV− and NV0 with a certain probability, which is measured by the second pulse. A wavelength of 594 nm is optimum for the measurement pulse, because absorption of NV− is high (see figure 4(c)), leading to high NV− fluorescence. (b) Histogram of photon counts during the 594 nm measurement pulse, after illuminating the NV with 565 nm, 22.5 μW for 100 ms. The solid lines are obtained from fitting the sum of two Poissonian distributions. The areas of the two Poissonians are indicated by A. The blue line indicates a threshold, which can be used to determine the charge state of the NV after one single measurement. (c) Steady-state probability to be in NV− at different illumination wavelengths, obtained from the areas of the Poissonian fits (black dots). The data above 570 nm (orange triangles) are taken from figure 4(d). (d) Saturation fluorescence (red dots) and saturation power (green triangles) of the NV, obtained from saturation curves. The peaks at around 513 and 530 nm are probably errors, and could not be confirmed by separate measurements. The local peak at 575 nm, however, is due to the zero phonon line of NV0 and can also be seen in (c).
Download figure:
Standard imageThe result is shown in figure 5(c), combined with the results from figure 4(d). We can see that PNV− is highest for 510–540 nm, where it reaches around 75%. For wavelengths below 490 nm, NV− can be ionized by a single photon (see section 5), which leads to reduced NV− population. Above 540 nm, the NV− population is dominated by the recombination process: at 575 nm, the zero phonon line of NV0 is a local maximum, whereas above this wavelength, the recombination process is suppressed because NV0 can hardly be excited. This shows that there is no particular wavelength at which the NV can be initialized into NV− with >75% probability.
Another interesting point is the saturation behaviour of the NV under high power illumination, with varied illumination wavelength. On the one hand, this yields the maximal fluorescence (saturation fluorescence) of the NV, which should be proportional to the probability to be in NV−. On the other hand, it also yields the saturation power, i.e. how much power is needed to get half of the maximum fluorescence. The desired condition for experiments is a high maximal fluorescence combined with low saturation power. For this measurement, we collected saturation curves by determining the fluorescence at varying illumination power. The function used to fit the measured data and obtain the saturation fluorescence FlS and the saturation power IS is

where Fl is the fluorescence and I the illumination power (see appendix A). For moderate powers we are using (<1 mW); this function fits the data very well. The result of this measurement is shown in figure 5(d). For illumination with 520–550 nm, we obtain high saturation fluorescence and low saturation power. As expected, the shape of the saturation fluorescence looks very similar to the population of NV− at low powers shown in figure 5(c). Similar results were obtained by Beha et al [21]. For a three-level model of NV−, one would expect the saturation power to be inversely proportional to the absorption cross-section of NV−. However, this is not the case here, because of the ionization processes, as shown in appendix A. This is why the wavelength dependence of the saturation power of NV− does not resemble the inverse of the fluorescence of NV− shown in figure 4(c) measured at low illumination power (which is proportional to the NV− absorption cross-section).
5. Ionization and recombination energy
In the following, we will determine the ionization and recombination energy of NV− in the diamond band gap. For the wavelengths used in section 3 (540–610 nm), the ionization and recombination rates depend quadratically on the illumination power, because of the underlying two-photon processes, see figure 1. However, if the photon energy is higher than the total ionization or recombination energy, both processes are possible with a one-photon process. In this case, the corresponding rate has a linear dependence on the excitation power. Therefore, we measure the charge state dynamics with different excitation powers at 435–520 nm. Because direct observation of the dynamics is not possible at these wavelengths, we use correlated single-shot charge state measurements.
By setting a threshold in figure 5(b), we can determine the charge state of the NV non-destructively depending on whether the photon count number is above or below the threshold. This allows us to make correlated charge state measurements, as shown in figure 6(a). After the first charge state detection, we know the current charge state of the NV. Then, we apply an arbitrary laser pulse with a certain wavelength and power, and determine the induced charge state dynamics by varying its duration. Finally, a second single-shot charge state measurement is applied. By comparing the charge state before and after the arbitrary laser pulse, we obtain the probability that this laser pulse changed the NV's charge state. Figure 6(b) shows an example measurement result for 470 nm and 8.4 μW with different pulse durations. As shown in appendix B, we can calculate the ionization and recombination rates from this charge state dynamics for a specific excitation wavelength and power. The power dependence of the rates is obtained by varying the power of the laser pulse and measuring the corresponding dynamics as shown in figure 6(b).
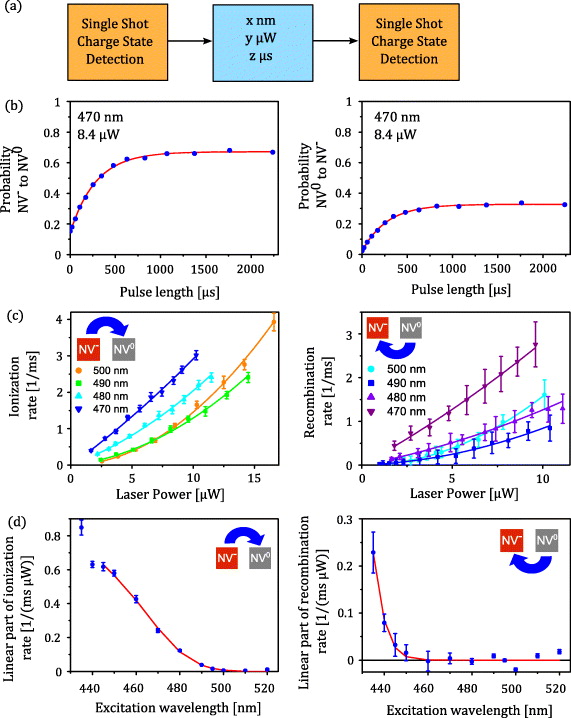
Figure 6. (a) Pulse sequence for measuring the ionization and recombination rates for arbitrary illumination, by correlating the charge state before and after the laser pulse. (b) Probability to change the charge state with the laser pulse depending on the pulse duration, for 470 nm and 8.4 μW, for initial states NV− and NV0. The red line is an exponential fit. (c) Dependence of ionization and recombination rates on illumination power I. The solid lines are parabola fits (f(I) = aI + bI2). The error bars arise from statistical fit errors of the measurements shown in (b). (d) Dependence of the linear part of the ionization and recombination rates (parameter a of the above fit function) on the illumination wavelength. The red line is a fit as described in the appendix. The error bars are statistical fit errors of (c).
Download figure:
Standard imageFigure 6(c) shows the dependence of rates on the illumination power for some wavelengths. We see that for decreasing excitation wavelength, the curves become more linear. To each curve, we fit the sum of a linear and a quadratic function,

where I is the laser power. The parameters a and b are the linear respectively quadratic part of the rates. The linear part a is plotted in figure 6(d) against the illumination wavelength. We can clearly see a dominant linear part of ionization when illuminating the NV centre with blue light (e.g. 440 nm). This explains why we observe NV0 fluorescence (see figure 2(a)) when exciting the NV centre with λ = 440 nm. In this case, the ionization rate is large compared to the recombination rate, leaving the NV centre mainly in its neutral charge state, which is also excited by the blue laser.
As explained in appendix C, we create a model for the ionization and recombination rates to account for thermal effects and the limited resolution of our supercontinuum laser. This allows us to fit the measured data, and extract the ionization and recombination energy of NV−. With this model, we obtain an ionization energy of 2.60 eV and a recombination energy of 2.94 eV.
6. Summary and conclusion
To summarize, we have performed detailed studies of the photo-induced ionization and recombination process of NV− and NV0. We found that a recently reported 'dark state' of NV− is indeed the neutral charge state NV0 (section 2). Real-time monitoring of the charge state dynamics via the NV's fluorescence was performed, which also yielded the bare excitation spectrum of NV− (section 3). We also determined the population of NV− and the fluorescence saturation behaviour for a broad range of the excitation wavelength (section 4). The optimal excitation wavelength for NV− is found to be around 510–540 nm. Finally, we determined the ionization energy of NV− to be 2.60 eV, and the recombination energy to be 2.94 eV (section 5). This was possible by observing the transition from a two-photon ionization and recombination process to a one-photon process, by varying the photon energy. Note that the recombination energy of 2.94 eV is not the energy of the ground state of NV0: the ground state of NV0 can also be seen as a hole in the ground state of NV−, and the photon has to provide the energy difference of the valence band and the ground state of NV− for the recombination. This means that the ground state of NV− lies 2.6 eV below the conduction band and 2.94 eV above the valence band. The sum of these two is 5.54 eV, close to the diamond band gap of 5.48 eV [32].
These results provide further insight into the properties and photophysics of the NV. A possible application of this process is stochastic high-resolution microscopy, similar to Photoactivated Localization Microscopy (PALM) and Stochastic Optical Reconstruction Microscopy (STORM), which requires the activation of only a few emitters in a diffraction-limited area at the same time. This is, in principle, possible with the NV, even in a reversible fashion, as can be seen in figure 1(b). We expect that these results are not sensitive to the environment of the NV, but only depend on the band structure of the diamond. Only if the inherent ionization/recombination rates (in the dark) are comparable with the measurement time, e.g. through shifts of the Fermi level (see [33, 34]), an effect is expected. A remaining question is the reason for the shape of the absorption spectrum of NV− shown in figure 4(c) and whether this two-maxima structure can be explained by the transition probabilities and density of states (DOS) according to the vibrational modes in the ground and excited states or if it arises from some other wavelength-dependent mechanisms.
Acknowledgments
We thank P Siyushev, T Rendler, R Koselov, S Zaiser and N Manson for experimental help and stimulating discussions. Support from the Deutsche Forschungsgesellschaft (SFB/TR21, FOR 1482 and 1493), the European Commission (SOLID, DIAMANT and SQUTEC), the Volkswagenstiftung and the Landesstiftung BW is gratefully acknowledged.
Appendix A.: Saturation behaviour
Here, we discuss the expected saturation behaviour of NV−. We use a four-level model, which includes the NV− ground state (G), excited state (E) and metastable state (M) and one effective state for NV0 (0), see figure A.1. We do not model the dynamics within NV0, because we are only interested in the dynamics of NV−. The rate equations for these four states are
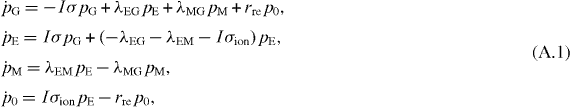
where pi denotes the population of state i, λij is a decay rate from state i to state j, I is the illumination intensity, σ is the absorption cross-section of NV− and σion is the cross-section of ionization. The rate rre is the effective recombination rate, which is

where σre is an effective recombination cross-section and I0 is the saturation power of NV0. This formula has two components, the population of the NV0 excited state, similar to (7), multiplied by a term proportional to the illumination intensity I. By setting all time derivatives in (A.1) to zero

and using

we can calculate the steady-state populations of the four states. We want to determine the expected fluorescence of the NV, depending on the illumination intensity. The fluorescence of NV− is proportional to the population of the NV− excited state E, for illumination with a moderate laser intensity, i.e. as long as the fluorescence decay rate λEG is much larger than the ionization rate Iσion, which is the case for our measurements. This population can be written as

where the saturation population pS is

and the saturation power IS is

Equation (A.5) is proportional to the fit function (7). Additionally, equation (A.7) shows that the saturation power is not inversely proportional to the absorption cross-section of NV−, as would be the case without the ionization process. Instead, it also depends on the ionization dynamics, and especially the saturation power I0 of NV0. This is probably the reason for the steep increase of the saturation power in figure 5(d) above 570 nm.

Figure A.1. Illustration of the energy levels and rates, which are used to model the saturation behaviour.
Download figure:
Standard imageAppendix B.: Ionization and recombination rate equations
The charge state dynamics of the NV can be described by a system of two first-order linear rate equations
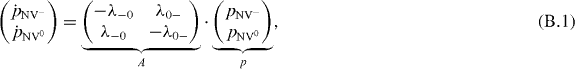
where pNV− and pNV0 are the population probabilities of NV−, respectively NV0 and λ−0, λ0− are the rates from NV− to NV0 and NV0 to NV−, respectively. The time evolution of p is then given by

which can be solved by diagonalizing A. In our case, the starting point p(0) after the first charge state detection measurement is always either  (for NV−) or
  (for NV0). Then, the evolution is given by
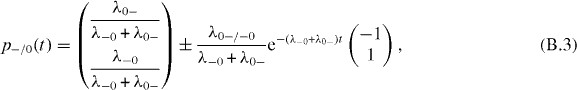
where p−/0(t) indicates the evolution after initializing in NV− respectively NV0. These two equations describe our measurement for the flip probabilities as shown in figure 6(b). From the steady-state population p(∞) and the pumping rate λ = λ−0 + λ0− provided by fitting, the measurement results yield the two rates λ−0 and λ0−, which are shown in figure 6(c).
Appendix C.: The model for measured ionization and recombination rates
The basic idea is that due to thermal effects and due to the spectral width of our supercontinuum laser (of around 4 nm), we obtain a probability distribution for the energy absorbed by the electron (for NV−) or by the hole (for NV0). Since we do not know the energy distribution of the NV− ground state due to thermal effects, we simply assume a Gaussian distribution P(Ef) for the final energy Ef of the electron (hole) after absorbing a photon, to approximately account for both the thermal effects and the spectral width of the photon, i.e.

where ℏω is the desired photon energy and σ is the width of the distribution, which will also be a fit parameter. The total ionization rate is given by the convolution of the final energy of the electron (hole) with the DOS for electrons in the conduction band (for holes in the valence band). We approximate the band structure at the band edge with a parabola, such that the DOS g is the same as that for a free electron gas, which is

where E is the energy and E0 the band edge energy relative to the ground state of NV−. E0 is the parameter we would like to determine. The rate, therefore, is

This can be solved numerically and fit to the measurement data. For the ionization rate, not all the data were used, because the approximation for the DOS in the band is only valid near the band edge. Therefore, only the data up to 445 nm were used. For the recombination rate, only four measurement points, which show a one-photon process, are given. Therefore, the dependence of the two fit parameters E0 and σ is very high. For this fit, we used the same value for σ = 0.069 eV as obtained by the fit for the ionization rate. This is also physically motivated, because the mechanism is the same, the spectral width of the photon and thermal effects.