


Abstract
This paper aims at elucidating the origin of the high thermoelectric power factor of p-type (AgxSbTex/2+1.5)15(GeTe)85 (TAGS) thermoelectric materials with 0.4 ⩽ x ⩽ 1.2. All samples exhibit good thermoelectric figures of merit (zT) which reach 1.5 at 700 K for x = 0.6. Thermoelectric and thermomagnetic transport properties (electrical resistivity, Seebeck, Hall and transverse Nernst–Ettinghausen coefficients) are measured and used to calculate the scattering factor, the Fermi energy, the density-of-states (DOS) effective mass and hole mean free path (mfp). The DOS effective mass is very high due to the large band mass of the primary valence band and the high degeneracy of pockets in the Fermi surface from the second valence band. The highly degenerate Fermi surface increased the total DOS without decreasing mobility, which is more desirable than the high DOS that comes from a single carrier pocket. The high-temperature hole mfp approaches the Ioffe–Regel limit for band-type conduction, which validates our discussion based on band transport and is also important for TAGS alloys having high zT with heavy bands. The present results show that multiple degenerate Fermi surface pockets provide an effective way of substantially increasing the power factor of thermoelectric materials with low thermal conductivity.

Content from this work may be used under the terms of the Creative Commons Attribution 3.0 licence. Any further distribution of this work must maintain attribution to the author(s) and the title of the work, journal citation and DOI.
1. Introduction
(GeTe)y(AgSbTe2)100−y compounds, commonly referred to as 'TAGS-y', can be considered as pseudo-binary compounds of AgSbTe2 and GeTe, and are one of the best traditional thermoelectric materials. They have attracted much attention since they were discovered in the 1960s [1]. This material system possesses a combination of high electrical conductivity (σ), Seebeck coefficient (S) and relatively low thermal conductivity (κ) on the GeTe-rich side, especially the compositions with 80 and 85 mol% GeTe, which are usually denoted as TAGS-80 and TAGS-85 [1–3]. By optimizing the alloying ratio Ag/Sb, the figure of merit (zT) = S2σT/κ of TAGS-85 and TAGS-80 alloys can reach or even exceed 1.5 at 800 K [1]. However, the stability problems with TAGS-80 materials led to the choice of TAGS-85 as the preferred material for space applications. In contrast to PbTe [4] and Bi2Te3 [5], TAGS materials have their optimal zT at much higher hole concentrations p (1020 ⩽ p ⩽ 1021 cm−3), where they maintain comparatively higher Seebeck coefficients, which contribute to their very high thermoelectric performance. This investigation will shed light on the reasons why this nearly metallic carrier density optimizes zT in this system.
It has long been known that the first contribution to the high zT of TAGS materials was their suppressed lattice thermal conductivity, which originates from the abundance of coherent and semi-coherent boundaries, as verified by transmission electron microscopy observations [6–8]. Grain boundary morphologies, including twin and small-angle grain boundaries, are ubiquitous in TAGS materials and are self-induced from the polymorphic phase transformation from at high temperatures to R3m at low temperatures. In contrast, this study is dedicated to elucidating the origin of the high power factor S2σ, which originates from the coexistence of the high carrier concentration and high Seebeck coefficient. Theoretical and experimental investigations indicate that TAGS are highly degenerate semiconductors [9], and that the valence band probably constitutes two sub-bands with different effective masses. This suggests that the presence of a second, heavy valence band causes the dependence of the Seebeck coefficient on hole density S(p), also known as the Pisarenko relation, to undergo a deviation when the carrier concentration increases and the Fermi level moves further into the heavy band [10–12]. The present experimental work confirms this conjecture.

Previous work indicated that TAGS materials retain not only the crystal structure but also the band structure of GeTe [9, 13]. As indicated in figure 1, one can consider the lattice of TAGS materials as a combination of cation and anion sub-lattices. Above about 500 K, TAGS are in a face-centered cubic phase; below that temperature, they are in a rhombohedral R3 m phase, which can be viewed as two cubic sub-lattices distorted along one <111 > direction, which becomes the rhombohedral c-axis, but with opposite displacement. The effect of this distortion on the Brillouin zone (BZ) and on the hole Fermi surfaces in degenerately doped materials is illustrated in figure 2, and goes as follows. The four equivalent L points in the BZ of the face-centered cubic phase split into one T point along the c-axis, and three equivalent L points in the BZ of the rhombohedral phase. The 12 Σ points in the cubic phase split into 6 η points along the c-axis and 6 Σ points in the R3m phase. The position of the Fermi level, which is dependent on hole concentration, will govern the number of pockets participating in conduction. While the locations of the different pockets of the Fermi surface in the BZ will change, overall the high and low temperature band structures are similar when considering the degeneracy of bands in highly doped samples.


Figure 1. Structures of the phase at high temperatures (solid line) and R3m phase at low temperatures (dashed line) for TAGS. Larger and smaller spheres represent Ge and Te atoms, respectively, where arrows indicate the lattice distortion at phase transformation from cubic to rhombohedral.

Download figure:
Standard image High-resolution image
Figure 2. The BZs, Fermi surfaces and band structures of R3m (a) and (b) phases for TAGS. As lattice symmetry breaks down, four L pockets split into one T pocket and three L pockets, while 12 ∑ pockets split into 6 η pockets and 6 ∑ pockets.

Download figure:
Standard image High-resolution imageIn this paper, we first present the results of the galvanomagnetic and thermomagnetic transport coefficients of polycrystalline TAGS samples with different carrier concentrations by tuning the Ag/Sb ratio from 80 to 420 K and a high zT of 1.5 for TAGS-85 samples at 700 K. Using an analysis technique inspired by previous work on PbTe [14], we confirm that the scattering mechanism in TAGS materials is acoustic phonon scattering. Then, the scattering parameter is fed back to calculate the density-of-states (DOS) effective mass (m*d), the Fermi energy (EF), the DOS g(EF) and the hole mean free path (mfp) using full Fermi–Dirac statistics in a degenerate semiconductor model. Additionally, low-temperature specific heat measurements are used as another means to measure the DOS. Both measurements demonstrate that the DOS goes through a sharp increase as the carrier concentration increases, and combined with the band structure of TAGS, we infer that the increase in DOS is a result of EF moving into the second sub-band that has a high degeneracy. The high degeneracy further results in high DOS effective mass, a high Seebeck coefficient and ultimately a high power factor and zT.
2. Experimental methods
2.1. Sample preparation
Stoichiometric amounts of elemental Ge, Ag, Sb and Te with 99.999% purity were weighed and mixed for the desired compositions of (AgxSbTex/2+1.5)15(GeTe)85 (x = 0.4, 0.6, 0.8, 1.0 and 1.2). The admixtures were sealed in an evacuated quartz ampoule, and kept at 1273 K for 10 h, then air-quenched to room temperature. From the room temperature x-ray diffraction (XRD) profiles (figure 3) all the samples were identified as single rhombohedral phase. As the Ag/Sb ratio increases, the peaks slightly shift to the lower angles (see the inset of figure 3). The solidified ingots were crushed, pulverized and hot-pressed in a graphite die at 773 K under 70 MPa pressure for 30 min in a vacuum. The samples prepared by this method were named as 'TAGS-85-x' samples, where x represents the Ag content. The densities of the resultant pellets were above 95% of the corresponding theoretical density 6.52 g cm−3 [15].

Figure 3. The XRD patterns demonstrate that all the TAGS samples with different Ag/Sb ratios formed solid solutions with the space group R3m (JCPDS no. 47-1079). The inserted patterns show the shift of (024) and (220) peak positions with increasing Ag content.
Download figure:
Standard image High-resolution image2.2. Measurements
The galvanomagnetic and thermomagnetic transport coefficients were simultaneously measured using a liquid nitrogen cooled conventional flow cryostat as described in [16] from 80 to 420 K. The samples for transport measurements were cut as parallelepipeds from the ingots using a diamond saw, with nominal dimensions 2 × 2 × 8 mm and a distance between the longitudinal voltage probes of 4.0 ± 0.5 mm. The electronic transport properties were taken from 80 to 420 K in stepped magnetic fields from −1.5 to 1.5 T. The Hall coefficient (RH) and the isothermal transverse Nernst–Ettingshausen (Nernst) coefficient were calculated from the measured adiabatic ones using the conventional method [16]. The inaccuracies in the sample dimensions are due to those in the distance between the longitudinal voltage probes and in the sample cross section. We took great care to minimize the size of the contacts to maximize the accuracy of their placement; we used 0.001' copper constantan type T thermocouples to minimize heat loss through them. The copper wires of the thermocouples were used to measure the Seebeck voltage and the electrical resistance; each served as one of the transverse wires for Hall and Nernst effects. The error on the absolute value electrical resistivity (ρ) was dominated by these geometrical uncertainties and was on the order of 7%, the relative error being dominated by electrical noise and being negligibly small. The Hall and Nernst coefficients depend on only one dimension, so that the absolute error was on the order of 5%, but a considerable error comes from electrical noise because the signal levels are low; the accuracies of the Nernst coefficient was on the order of ±0.2 μV K−1 T−1; on the Hall coefficient, the inaccuracy was equivalent to an uncertainty of ±12% on carrier density (p) and thus ±14% on mobility (μ). The Seebeck coefficient does not depend on sample geometry; because of the small size of the contacts, the thinness of the wires, and the fact that the contacts are spot-welded and thus have the lowest possible thermal resistance to the sample while having a high thermal resistance to the environment, the error was on the order of 3%.
Since we claim zT values up to 1.5 in this paper, multiple tests were performed in three different laboratories to check their validity. In addition to the thermomagnetic tests measured from 80 to 420 K at Ohio State University (OSU), two samples of TAGS-85-0.6 composition prepared separately in the same manner were measured at Zhejiang University (ZJU) and California Institute of Technology (CIT) separately. At ZJU, σ and S were measured in the temperature range between 300 and 733 K under a vacuum using a dc four-probe method and a differential voltage/temperature technique, respectively [8]. The thermal conductivity (κ) was calculated using κ = DρD CP, where ρD is the sample density estimated by an ordinary dimensional and weight measurement procedure at room temperature, and thermal diffusivity D and specific heat CP were measured by a laser flash method on a Netzsch LFA457 with a Pyroceram standard. At CIT, σ and p were measured on a homemade Van de Pauw setup with four tips placed on four edges of the disc in the magnetic field [17]. The Seebeck coefficient was measured in an instrument with two heaters and thermocouples on opposing sides of the sample that provided both the measuring temperature and temperature gradient [18]. S and κ were measured in the cross-plane direction by the same method at ZJU, with the exception that CP was calculated using the Dulong–Petit law. For comparison, ρD was 6.19 and 6.35 g cm−3 for the ZJU and CIT samples, respectively, while the Netzsch LFA457 measured CP = 0.251 and the Dulong–Petit law gave 0.246 J g−1 K−1. The low-temperature heat capacity was measured using a thermal relaxation technique in the Quantum Design Physical Property Measurement System (PPMS) in zero magnetic field between 1.85 and 300 K. Samples with a mass of approximately 20–30 mg were prepared with a flat surface for good thermal contact with the sample platform. The 300 K CP of TAGS-85-0.6 was measured to be 0.251 J g−1 K−1 from PPMS at OSU, which is consistent with the results from CIT and ZJU.
3. Results
The temperature dependence of the electrical transport properties are shown in figure 4. We note that S is linear with temperature, as expected, and both S and electrical resistivity ρ exhibit a metal-like behavior expected for a heavily doped, extrinsic semiconductor. S and ρ firstly decrease as the Ag content increases from 0.4 to 0.8, and then increase as the Ag content further increases to 1.2. This is consistent with the composition dependence of carrier concentration p, calculated using p = 1/RHe. The change in carrier concentration is irregular with the Ag/Sb ratio because the p-type conduction mechanism in TAGS alloys is very complicated. The composition fluctuation (i.e. the deviation from the nominal compositions) of the quaternary alloys also changes the carrier concentration because the thermoelectric semiconductors are very sensitive to composition. However, the irregularity of carrier concentration with the Ag/Sb ratio does not affect the discussion below. The TAGS-85-0.6 sample has the highest power factor in the temperature range from 80 to 420 K, reaching 22 μW mK−2. The Nernst coefficient is exceedingly small and qualitatively indicates that acoustic phonon scattering dominates; we will quantitatively address this in the following paragraphs. The mobility follows the opposite trend to that of carrier concentration and is very low when compared with doped PbTe [19].

Figure 4. Temperature dependences of Seebeck coefficient, resistivity, carrier concentration, carrier mobility, Nernst coefficient and power factor for TAGS-85 samples with different Ag/Sb ratios.
Download figure:
Standard image High-resolution imageAdditionally, two samples of TAGS-85-0.6 composition prepared separately, which have the highest power factor at 420 K, were tested at ZJU and CIT respectively for transport properties in a high temperature range, as shown in figure 5. The Seebeck coefficient is nearly linear with temperature; it reaches a maximum then decreases above 600 K due to thermally excited minority carriers. Note that the slopes are nearly the same before and after transformation from the rhombohedral to the cubic phase. Comparing the data from the three different labs, we note slight changes in the transport properties between samples. ZJU noted a higher Seebeck coefficient and resistivity than CIT and OSU, and thus the same power factor, indicating that the sample tested in ZJU had a slightly lower carrier density. We further see this in thermal conductivity, with ZJU sample having lower values at higher temperatures due to the higher resistivity and lower density, and in zT, with the ZJU sample having a higher zT at lower temperatures, which is expected due to its lower carrier density. In spite of the slight differences in the transport properties, both of the TAGS-85-0.6 samples tested at ZJU and CIT reached a maximum zT ∼ 1.5 at around 700 K, indicating that our TAGS materials can repeatedly reach a high zT. In addition, zT is above 1.4 between 650 and 800 K, demonstrating the wide working temperature range for TAGS-85 materials.

Figure 5. Comparisons between temperature dependences of Seebeck coefficient, resistivity, power factor, carrier concentration, thermal conductivity, mobility and the figure of merit for TAGS-85-0.6 samples. The data are from the CIT, OSU and ZJU and were measured on the samples prepared separately. The anomalous behavior of thermal conductivity between 400 and 600 K is due to the phase transformation.
Download figure:
Standard image High-resolution imageIt is noteworthy that a temperature region exists between 400 and 600 K where both electrical and thermal transport properties have a peak corresponding to the rhombohedral to cubic polymorphic phase transformation found in the TAGS system [13, 20]. There are no significant differences between the slopes of S versus T and ρ versus T before or after the phase transformation, implying that there are similarities between the band structures of the and R3m phases.

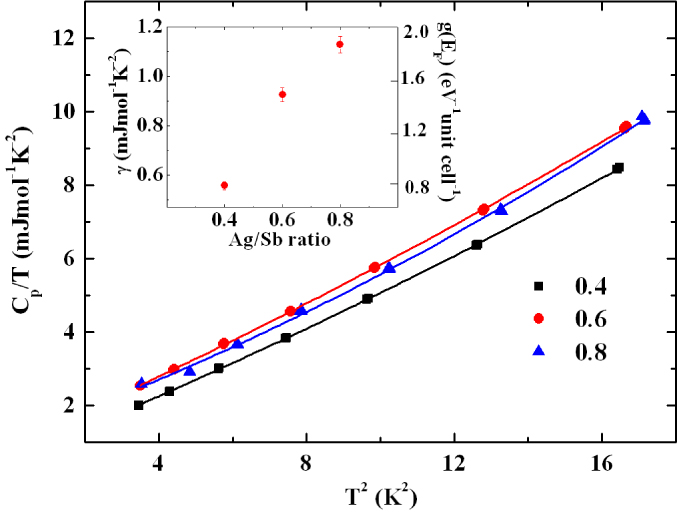
Heat capacity data for TAGS-85-0.4, TAGS-85-0.6 and TAGS-85-0.8 samples are shown in figure 6 as CP/T versus T2. For each sample there is a slight curvature at low temperatures. This curvature was observed previously and was attributed to the possible softening of transverse optical phonon modes [21, 22]. Data were fit to CP /T = γ + β T2 + δ T4 from 1.8 to 4 K, with γ estimated to be 0.56 ± 0.02, 0.93 ± 0.03 and 1.13 ± 0.11 mJ mol−1 K−1 for TAGS-85-0.4, TAGS-85-0.6 and TAGS-85-0.8, respectively, compared with a published value of 0.554 mJ mol−1 K−1 for pure GeTe with a carrier concentration of 8 × 1019 cm−3 [22]. The Debye temperature was calculated to be 204, 211 and 220 K, respectively, using the equation β = N(12π4 /5)RΘ −3, where N is the number of atoms in one unit cell and R is the ideal gas constant, which is consistent with 199 K reported for rhombohedral GeTe [23].

Figure 6. Heat capacity of TAGS samples with Ag/Sb ratios of 0.4, 0.6 and 0.8, respectively, shown as CP/T versus T2. The inset shows electronic contribution γ (left axis) and DOS at the Fermi level g(EF) (right axis) as a function of the Ag/Sb ratio.
Download figure:
Standard image High-resolution image4. Discussion
S, p and ρ are functions of the Fermi energy EF, the DOS effective mass md* and the carrier scattering relaxation time τ [16]. The relaxation time of carriers τ is usually assumed to depend on energy as τ = τ0 Eλ, where λ is called the scattering parameter. For the scattering of carriers by acoustic phonons λ = –1/2, whereas for scattering by ionized impurities λ = 3/2. By measuring four parameters (the Seebeck coefficient S, resistivity ρ, Hall coefficient RH and Nernst coefficient), one can calculate the scattering parameter and further identify the scattering mechanism [14, 16, 24]. In this study, the four-parameter fit for TAGS materials is based on the following hypotheses. (i) The dispersion relations for TAGS are assumed to be parabolic [9]. (ii) Full Fermi–Dirac statistics were employed in the calculation, but showed that the Fermi integrals barely deviate from their Bethe–Sommerfeld expansion, so that degenerate statistics will be used in further calculations. (iii) The method of the four parameters described above is strictly valid only in a one-carrier system. This is clearly not the case in heavily doped TAGS samples, for which figure 2 shows that several non-degenerate pockets can exist in the Fermi surface. Here, we start by assuming that the Fermi surface of the system has N pockets, and that each has the same average isotropic effective mass m*p. While this appears quite approximate given our knowledge of the valence band Fermi surfaces of GeTe, for which both the anisotropy of the masses [25] and the ratio of heavy to light hole band masses [26, 27] are about a factor of 2, the analysis is still expected to give a meaningful average DOS effective mass from the limited experimental data set we access.
The scattering parameters fall into the range of λ = –0.5 ± 0.2, indicating that the TAGS samples are dominated by acoustic phonon scattering, despite the alloying of the cation site and the high-density twining boundaries found in the microstructure [6–8], which is consistent with previous results [9]. With this, the Seebeck coefficient is given by the following equation [28, 29]:

where m*d = N2/3m*p is the total DOS effective mass, including the effect of the degeneracy of the pockets N, the total hole density is p = Npp (pp is the density of carriers in each pocket), kB is the Boltzman constant, T is the temperature, e is the electron unit charge and h is the Planck constant. If we introduce a thermal de Broglie wavelength

and another characteristic temperature as

then equation (1) can be written as

Figure 7(a) shows a plot of the measured values of S/(kB/e) versus T/Θλ, the slope of which directly gives the DOS effective mass md*/m0, and shows that TAGS-85-0.4 has a lower DOS effective mass compared to those of other compositions, due to the relatively low carrier concentration. Using the Mott relation for degenerate semiconductors

where the total DOS is g and the DOS per pocket is gp


Figure 7. (a) Reduced Seebeck coefficient versus reduced temperature (T/Θλ) and (b) Fermi energy dependence of DOS effective mass for TAGS samples with different Ag/Sb ratios.

Download figure:
Standard image High-resolution imageThe mobility depends on the mass of each pocket along the direction of the applied electric field; assuming an isotropic (scalar) mass m*p and relaxation time τ.

we obtain, for acoustic phonon scattering

The Fermi energies calculated from equation (9) for all samples are plotted as abscissas in figure 7(b), and the DOS effective mass obtained from equation (4) and figure 7(a) as ordinates; the dependences of both on the Ag/Sb ratio can be inferred from the color coding and from table 1, in which all transport parameters are summarized and compared. The Fermi energy first increases as the Ag/Sb ratio increases to 0.8 and then decreases as the Ag/Sb ratio increases further, which is consistent with the composition dependence of carrier concentration. As the Ag/Sb ratio increases from 0.4 to 0.6 (carrier concentration from 4 × 10²⁰ to 8 × 1020 cm−3), the carrier DOS effective mass undergoes a sharp increase and then remains stable as the Ag/Sb ratio further increases, which is consistent with the increase in the Seebeck coefficient as the carrier concentration is above 4 × 1020 cm−3 [10]. As indicated previously, the Fermi level moves deeper into the valance band as the carrier concentration increases, and the position of the Fermi energy determines the number of pockets N participating in conduction. We attempt to calculate m*d = N2/3m*p from literature values of the transport masses of GeTe in table 2. If we assume the simplest case that all the pockets have the same transport mass m*p = 1.15m0 as the T and L pockets in GeTe [10], the calculated total DOS masses are an overestimation of our experimental ones. Taking into account that the η and Σ pockets may have a lighter mass (which also depends on the actual carrier density) of 0.51m0 [26, 27], the calculated m*d (column 3 in table 2) aligns very well with the values obtained from our transport data, and we therefore suggest that the contribution of multiple degenerate pockets to the conduction is the explanation for the high Seebeck coefficient of TAGS.
Table 1. Carrier concentration, Fermi energy, effective mass and DOS calculated from transport parameters and from low-temperature specific heat measurement of TAGS-85 materials with different Ag/Sb ratios.
| Ag/Sb ratio | p (1020 cm−3) | EF (meV) | md*/m0 | (eV−1 unit cell−1) DOSa | (eV−1 unit cell−1) DOSb |
|---|---|---|---|---|---|
| 0.4 | 3.0±0.3 | 60.5±4.6 | 2.6±0.2 | 1.59±0.52 | 0.78±0.03 |
| 0.6 | 9.0±0.8 | 75.2±6.5 | 4.6±0.4 | 3.13±1.01 | 1.57±0.05 |
| 0.8 | 12.5±1.8 | 84.0±8.5 | 4.9±0.5 | 4.01±1.30 | 1.91±0.06 |
| 1.0 | 9.4±1.2 | 77.6±6.8 | 4.5±0.4 | 3.48±1.13 | |
| 1.2 | 8.0±1.0 | 71.6±4.9 | 4.3±0.3 | 3.33±1.08 |
aData from thermomagnetic transport measurements. bData from specific heat measurements.
Table 2. Possible configurations of bands participating in transport and resulting degeneracy and calculated DOS effective mass m*d, assuming m*p = 1.15m0 for L and T pockets and 0.51 for η and ∑ pockets in TAGS alloys.
| Pockets participating in conduction | Degeneracy N | Calculated md*/m0 |
|---|---|---|
| 1×T | 1 | 1.15 |
| 1×T, 3×L | 4 | 2.89 |
| 1×T, 3×L, 6×η | 10 | 3.69 |
| 1×T, 3×L, 6×η, 6×∑ | 16 | 4.42 |
The total DOS g(EF) of the samples calculated from equations (6) and (9), and thus derived from these thermomagnetic data, is shown in table 1, with the appropriate error bars that we calculated throughout the study. These values can now be compared to the DOS obtained from the electronic part of the low-temperature specific heat, which is derived from the fitted parameter γ as follows [30]:

The results of DOS from specific heat measurements are shown in the inset of figure 6. We recognize that the discrepancy of DOS results from thermomagnetic parameters and low-temperature specific heat measurements is clearly above their respective error bars, while those two measurements were in excellent agreement for the case of the Tl resonant level in PbTe [29]. We can offer no physical explanation for this, but could speculate that either we could not reach a low enough temperature in the measurement of γ to eliminate the effect of softening of the transverse optical phonon modes, or we stayed at the multi-band region; however, there is no indication of this in figure 7.
We further analyze the mfp, given by

and present it in figure 8 as a function of T for different Ag/Sb ratios using mp = 1.15m0. Taking into consideration the errors in the calculation of EF and μ, the error of the mfp calculation is on the order of 20%. Above 300 K, the mfp is on the same order as the lattice constant (∼ 0.6 nm) of TAGS, and only 1.5 times longer at low temperatures. Using the Ioffe–Regel criterion, this is the lowest limit for metallic (band) conduction, below which carriers are localized. Below the Ioffe–Regel limit, there would be no band conduction, and equations (1) and (8) would not be valid. This result is quite remarkable, given the high thermoelectric performance of TAGS materials, and strongly suggests that maximizing the carrier effective mass by multiply-degenerate Fermi surface pockets is more desirable than maximizing mobility in optimizing the thermoelectric power factor of a given material; this fact was known from classical thermoelectric equations, which show that the power factor scales inversely with the inertial effective mass [31]. In addition, we note that obtaining a high DOS mass m*d through a multiply-degenerate Fermi surface is more effective than using a very heavy single band (flat band) [32], as we did using the distortion in DOS due to resonant impurities in Tl-doped PbTe [29] and Sn-doped Bi2Te3 [33]. The conclusion is also consistent with the results for high-zT PbTe with band convergence [34, 35].

Figure 8. Temperature dependence of mfp. Symbols correspond to Ag/Sb ratios.
Download figure:
Standard image High-resolution image
5. Conclusions
We report the galvanomagnetic and thermomagnetic properties of TAGS-85 samples with different carrier concentrations by changing the Ag/Sb ratio and a maximum zT reaching ∼1.5 at about 700 K. From four transport properties (Seebeck coefficient, resistivity, Hall and Nernst coefficients) it is revealed that TAGS materials are dominated by acoustic phonon scattering and have a very heavy DOS effective mass as a result of the high degeneracy of the Fermi surface reached when the Fermi level moves deep enough into the valence band. Furthermore, the carrier mfp of TAGS materials above 300 K is approaching the Ioffe–Regal limit for retaining band conduction, which is important for heavy mass thermoelectric compounds. As justified by the classical transport equations, the increase in the density of states and DOS effective mass due to the increased degeneracy does not result in the decrease in mobility found when the band mass increases, and results in an increase in the power factor, which is also the origin of the high power factor of TAGS. Through our investigation in TAGS, we have shown that multiply-degenerate Fermi surface pockets provide a way of substantially increasing the power factor of thermoelectric materials with low thermal conductivity.
Acknowledgments
The work at Zhejiang University is supported by the National Basic Research Program of China (2013CB632503), the Natural Science Foundation of China (51171171 and 51271165), the Program for Innovative Research Team in University of the Ministry of Education of China (IRT13037), the Program for New Century Excellent Talents in University (NCET-12-0495) and the PhD program Foundation of the Ministry of Education of China (numbers 20120101110082 and 20110101110024). The work at Ohio State University is supported as part of the Revolutionary Materials for Solid State Energy Conversion Energy Frontier Research Center funded by the US Department of Energy, Office of Science, Office of Basic Energy Sciences under Award number DE-SC0001054.