


Abstract
Electronic wavepackets composed of multiple bound excited states of atomic neon lying between 19.6 and 21.5 eV are launched using an isolated attosecond pulse. Individual quantum beats of the wavepacket are detected by perturbing the induced polarization of the medium with a time-delayed few-femtosecond near-infrared (NIR) pulse via coupling the individual states to multiple neighboring levels. All of the initially excited states are monitored simultaneously in the attosecond transient absorption spectrum, revealing Lorentzian to Fano lineshape spectral changes as well as quantum beats. The most prominent beating of the several that were observed was in the spin–orbit split 3d absorption features, which has a 40 femtosecond period that corresponds to the spin–orbit splitting of 0.1 eV. The few-level models and multilevel calculations confirm that the observed magnitude of oscillation depends strongly on the spectral bandwidth and tuning of the NIR pulse and on the location of possible coupling states.
Export citation and abstract BibTeX RIS

Content from this work may be used under the terms of the Creative Commons Attribution 3.0 licence. Any further distribution of this work must maintain attribution to the author(s) and the title of the work, journal citation and DOI.
Wavepackets, or coherent superpositions of multiple electronic, vibrational or rotational states of an atom or molecule, evolve on timescales determined by the energy separations between the levels that comprise the wavepacket. In atoms, wavepackets that consist of closely spaced, high-lying Rydberg states have been studied extensively due to the small separation in energy, leading to time evolution on the easily resolved picosecond timeframe [1, 2]. In molecules, vibrational wavepacket dynamics can be probed using femtosecond laser pulses [3, 4], and rotational wavepackets can be excited, resulting in the field-free alignment of a sample as the wavepacket rephases after the laser pulse has passed [5, 6]. However, the evolution of wavepackets composed of states with larger energy separations, such as more widely spaced electronic states of an atom, typically occurs on a timescale too fast to resolve with these techniques. The recent development of attosecond spectroscopy has provided the ability to directly observe few-femtosecond or sub-femtosecond processes [7, 8]. The broad and continuous spectrum of an isolated attosecond pulse is particularly useful for launching electronic superpositions that consist of many states. The broad spectrum also allows multiple absorption features to be monitored simultaneously while varying the time delay between the attosecond pulse and a second laser pulse that can couple the initially excited state to other states or to the continuum. This technique, known as attosecond transient absorption, was first used to measure the degree of coherence in an electronic superposition created by the strong-field ionization of krypton [9]. Attosecond transient absorption has subsequently been used to excite light-induced states in helium [10–12], to characterize autoionization in argon [13], to measure lifetimes of autoionizing states in xenon [14] and to observe interferences between multiphoton pathways in neon [15].
In the work presented here, an isolated attosecond pulse in the extreme ultraviolet (XUV) spectrum is used to create a coherent superposition in neon gas, inducing a time-dependent polarization in the sample. An NIR pulse modifies the induced polarization to allow a quantum beat between individual states of the electronic wavepacket to be detected. The isolated attosecond pulse is used to both create the initial superposition and to monitor the effect of the time-delayed NIR pulse on the wavepacket by measuring changes in the transmitted XUV spectrum. This technique has previously been used to study doubly excited states of helium in which quantum beating was reported [16]. In addition to several quantum beats with periods as short as 10 fs, spectral changes of Lorentzian to Fano lineshapes are observed, as in Ott et al [17]. A prominent quantum beat between the spin–orbit-split 3d levels is characterized in detail. These quantum beats have been previously observed via photoionization [18, 19]. Here, the quantum beating is directly imprinted onto the spectrum of the extreme ultraviolet pulse. The observation of this beating requires an NIR pulse to perturb the polarization induced by the XUV pulse. The observed beating is then compared to theoretical models and calculations to explain its appearance and sensitivity to variations in the NIR pulse.
The details of the experimental set-up, shown in figure 1, are similar to those described previously [12] and are briefly summarized here. The output of a femtosecond Ti:Sapphire laser (HE CEP, Femtolasers) is spectrally broadened in a hollow core fiber filled with 1.8 bar of Ne gas, and the pulse is then compressed with a set of chirped mirrors. The pulse is split into collinear high-harmonic generation and NIR arms with an annular mirror. The two pulses are separated in an actively stabilized compact interferometer [20] to allow the introduction of a relative time delay and then recombined by a second annular mirror. High harmonic generation in conjunction with double optical gating [21] is used to generate isolated attosecond pulses with XUV photon energies using Kr or Xe gas as the generation medium. No subcycle features are considered, as carrier-envelope phase stabilization is not used, and the delay step is 1.3 fs. This large delay step size is chosen in order to resolve the most prominent delay-dependent behavior, which occurs on the timescale of tens of fs, and also to allow the acquisition of data out to NIR-XUV delays of several hundred fs. The XUV photons are spectrally filtered using either a 200 nm or 300 nm thick Sn foil mounted on a piece of fused silica (FS, 1 mm thickness). The collinearly propagating, donut-shaped NIR pulse passes through the FS around the Sn foil. Leakage of the NIR light through the XUV filter can cause spurious modulations with an NIR-XUV time delay due to optical interferences and is scrupulously avoided.

Figure 1. Schematic of experimental set-up. QP = quartz plate, FS = fused silica, ND = neutral density, BBO = β-BaB2O4 crystal, HHG = high harmonic generation. QP and BBO are optics used to implement double optical gating.
Download figure:
Standard image High-resolution imageSubsequently, the NIR and XUV pulses are focused with a gold-coated toroidal mirror (ARW Optical, focal length 1 m) into a 2 mm long cell filled with Ne gas. The pressure in the cell is typically 2 torr or 266 Pa and is calibrated using absorption above the Ne ionization potential at 21.56 eV [22]. The NIR intensity ranges from 5 × 10¹¹ W cm−2 to 2 × 10¹² W cm−2 and is estimated by measuring the beam waist at the focus. The pulse at FWHM is 11 fs, as measured by SPIDER [23], and the central wavelength is 760 nm. The XUV pulse duration is estimated to be 400 as, based on previous measurements [20].
After passing through the sample, the XUV light is dispersed, focused by a concave grating (Hitachi 001-0464) and imaged on an x-ray CCD camera (Pixis XO 400B, Princeton Instruments). The energy scale is calibrated by measuring the 1s2p, 1s3p and 1s4p absorption features in helium. The spectral resolution, determined by fitting the 1s2-1s3p absorption line of helium at 23.087 eV, is 13 meV. Residual NIR light is blocked before the grating by a 300 nm thick Sn foil. The measurements presented here were recorded using a 2 s integration time per data point and by averaging either 2 or 4 data points for each NIR-XUV time delay.
The Ne absorption as a function of the NIR-XUV time delay is shown in figure 2 for photon energies ranging from 19.5 eV to just above the Ne ionization edge at 21.56 eV. Negative time delays (on the left) mean that the NIR pulse precedes the XUV pulse, while positive time delays (on the right) mean that the NIR pulse arrives after the XUV pulse. The color scale represents optical density, defined as –log(I/I0), where I0 is the XUV spectrum without Ne gas, and I is the transmitted XUV spectrum with Ne gas present in the interaction region.

Figure 2. Transient absorption measurement in the photon energy range of 19.5–21.6 eV. The color scale represents the optical density. The XUV pulse arrives after the NIR pulse for the negative time delays. The energy level positions are labeled on the right. The Ne+ core configurations are abbreviated as (2P1/2) and (2P3/2). Ip = ionization potential.
Download figure:
Standard image High-resolution imageThe XUV pulse excites electronic states of Ne with principal quantum number n = 3 and higher. The Ne+ core is split by the spin–orbit interaction, leading to pairs of states separated by about 0.1 eV. Hyperbolic sidebands, including regions of emission (e.g. negative values of optical density), are observed to converge to several absorption features, most notably the 2s22p5(2P1/2)3d feature located around 20.14 eV. These sidebands are manifestations of perturbed free induction decay [24, 25]. The position of the zero time delay between the NIR and XUV pulses is assigned by finding the asymptote of these hyperbolic sidebands. The absorption on the line center is increased when the NIR pulse overlaps or follows the XUV pulse. The absorption then appears to decay back to the XUV-only absorption over time, with a decay timescale on the order of hundreds of femtoseconds. The natural lifetimes of the Rydberg states are on the scale of nanoseconds, so the apparent decay is not due to an atomic decay process. Instead, both the increase in absorption and subsequent decay are due to the effect of the spectrometer resolution on an initially saturated absorption feature. The line is broadened because the NIR pulse artificially shortens the lifetime of the state. As the delay of the NIR pulse increases relative to the XUV pulse, the effective lifetime of the state is longer, and the width of the broadened line decreases. The broadened, saturated absorption feature, when convoluted with the detector resolution, appears stronger than the XUV-only absorption. Then, the feature appears to get weaker as the linewidth decreases (e.g. the NIR-XUV delay increases).
The lineshapes of the neon absorption features can be modified by the NIR pulse, as in the recent work on helium by Ott et al [17]. This effect is most visible for the states with n ≥ 4 located above 20.4 eV. When the NIR pulse precedes the XUV pulse, these features appear weakly in the absorption spectrum as peaks with linewidths limited by the spectrometer resolution. When the NIR pulse follows the XUV pulse, the peak shape is dramatically modified to a Fano-like profile by the introduction of a phase by the NIR light field, and the intensity of absorption increases. The inset in figure 3(a) shows the Fano-like profile of the absorption lineshapes of the Rydberg states between 20.45 eV and 20.75 eV when the NIR and XUV pulses are overlapped in time. The observed lineshape also evolves in time and is sensitive to the NIR intensity, as discussed in Pfeiffer et al and in Chen et al [26, 27].
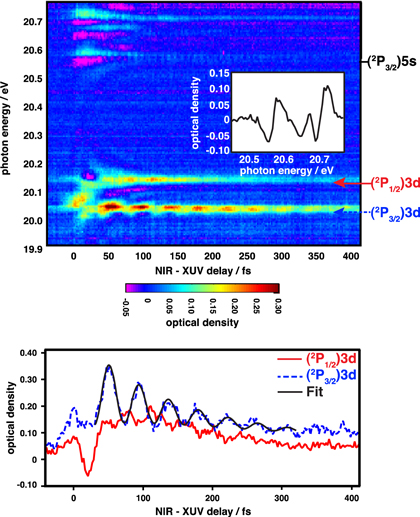
Figure 3. Transient absorption measurements focusing on the 3d absorption features. (a) Absorption as a function of the NIR-XUV delay. Inset: absorption at the NIR-XUV overlap (zero delay) from 20.45 to 20.75 eV. (b) Lineouts of measurement at positions marked by arrows. Red solid line: (2P1/2)3d, blue dashed line: (2P3/2)3d, black thin solid line: fit of lineout at the (2P3/2)3d resonance center to a cosine multiplied by an exponential decay (resulting period: 42 fs).
Download figure:
Standard image High-resolution imageThe XUV pulse excites all of the accessible states coherently, launching a wavepacket composed of many states with large energy separations. Figures 3(a) and (b) present transient absorption data in a narrow energy region (from 19.9 to 20.8 eV) from a different data set than is shown in figure 2. Most of the absorption features appear too weakly in the data to observe recurrences; however, in the data presented in figure 3(a), beating is observed in several individual lines. For example, an oscillation is clearly observed in the (2P3/2)5s state at 20.56 eV with a period of approximately 10 femtoseconds. This beat frequency could result from a coherent excitation and from subsequent coupling of the (2P3/2)5s and (2P3/2)6s states, both of which are observed in the XUV-only absorption spectrum, and they are separated by 0.38 eV.
The most prominent NIR-XUV delay-dependent behavior in the transient absorption spectrum occurs in the (2P3/2)3d and (2P1/2)3d absorption features located at 20.04 eV and 20.14 eV, respectively. Clear hyperbolic sidebands are observed converging to the upper feature, which is assigned to the absorption of the (2P1/2)3d state. The sidebands in the lower feature, which is assigned to the (2P3/2)3d state are not evident. Figure 3(b) shows the absorption at the line center for each feature as a function of the NIR-XUV delay. The (2P3/2)3d absorption shows a clear oscillation with a period of approximately 40 fs. This oscillation period corresponds to an energy difference of 0.1 eV, which matches the spin–orbit splitting of the Ne+ states. An oscillation with the same period but that is approximately 180 degrees out of phase is observed more weakly in the (2P1/2)3d absorption feature.
The prominent beating in the transient absorption data for positive time delays can be explained theoretically by considering the absorption at the single atom level. Two simple models that can give rise to these oscillations will be discussed before turning to more complex calculations. When the XUV pulse excites the atom, it coherently distributes amplitude among all of the 'bright' (allowed transition) states, creating a superposition of excited states. The absorption lines that naturally follow from this superposition are altered by the action of the NIR pulse. This mechanism differs from that in [9] in which the wavepacket is created by strong field NIR ionization of the sample and is subsequently probed with the attosecond pulse. Concentrating on just the ground state and the two prominent 3d states, the wave function before the NIR pulse arrives (up to an overall phase) is

where ω1 and ω2 are the energies of the (2P1/2)3d and (2P3/2)3d states, respectively. Considering just the response near the (2P1/2)3d and (2P3/2)3d lines, the most important effect of the NIR pulse is to couple the bright states to the nearby dark states. This will alter the coefficients C1 and C2, giving them the new values C'1 and C'2 just after the NIR pulse. Because the dark states are initially unpopulated, the new values C'1 and C'2 are linearly dependent on the initial values C1 and C2. The NIR-induced transformation of the coefficients can therefore be written as
The coefficients a, b, c and d are, in general, complex, and the propagation matrix is symmetric in the rotating wave approximation, which gives c = b. Since the NIR pulse duration (11 fs) is short compared to the beating timescale (40 fs), the duration of the NIR pulse can be ignored, and the NIR pulse can be assumed to instantly modify the state amplitudes. Once the coefficients are known at all times, the single atom response function can be calculated using the equation

where  is the Fourier transform of the time-dependent dipole moment, and
  is the Fourier transform of the electric field [28]. This 2 × 2 transfer matrix model can be used to account for both the incoherent effects that cause the population to leave the 3d states, which quenches the dipole coherence, and for the coherent effects in which the 3d states couple to each other via a third state (actually, some combination of 3p and/or 4f states). Both processes can give rise to oscillations at the beat frequency between the 3d lines as a function of the time delay.
As an example of the first process in which the two states are not coherently coupled, the coefficients b and c are taken as zero, and coefficients a and d account for the 'quenching' of the ground to the excited state dipole oscillation. This is perturbed free induction decay, and it gives rise to sidebands on the absorption line that depend on frequency and delay. These sidebands are clearly observed in the experimental data (see figures 2 and 3(a)). Note that it does not matter whether the dipole coherence is quenched (as could be done in a density matrix treatment) or that the 3d state amplitude is simply reduced (as is done in a wave function treatment)—the result is the same. For example, if |a| < 1, the quenching of the (2P1/2)3d dipole gives a frequency-dependent single atom response

where  is the XUV-NIR delay, and
  is the central frequency of the (2P1/2)3d absorption feature. The first term is the usual Lorentzian absorption line with dephasing constant
  . The second term gives sidebands that show 'stripes' of a constant phase given by the solution of S1 ∼ constant or

where  is an additional parameter determined by the NIR pulse and initial amplitudes of the two states. At the line center of the (2P3/2)3d line
  these sidebands will modulate the absorption with a frequency that corresponds to the energy difference of the two 3d states. The observed beat frequency and amplitude as a result of these stripes, or hyperbolic sidebands, can be matched to the experimental data if the initial populations in the 3d states are used as free parameters. Note that it does not seem likely that the populations can be used as free parameters; the states in question are closely spaced, and the XUV spectrum is assumed to be flat over the energy region. The population should therefore scale as the dipole matrix elements between the ground and excited states. This constraint dictates that the (2P3/2)3d should have more initial population than the (2P1/2)3d. This quenching process is analogous to Bernhardt et al [14] in which the NIR pulse could be assumed to completely remove the polarization component of an initially excited autoionizing state.
As an example of the second process, consider the interaction of the two 3d states via their mutual coupling to a third state. This third state is not populated by the XUV pulse, but it couples with some strength to both of the 3d states under the action of the NIR pulse. Likely candidates for the 3d-coupled states in the experiment are several of the 3p levels, which are separated from the 3d levels by about 1.4 eV. This spacing closely matches the NIR central energy of 1.6 eV. The near-resonant coupling will strongly modulate the 3d state amplitudes. Ignoring all other processes and assuming exact resonance gives the transformation matrix elements

where Ω1 and Ω2 are the Rabi couplings of the (2P1/2)3d and the (2P3/2)3d states to the third state; Ω is  ,
,  is the NIR pulse length and the coefficient d in equation (2) is the same as a but with the coefficients 1 and 2 swapped. In the simplest example, if Ω1 = Ω2, and the total Rabi phase
  is about
  , the 3d state amplitudes are swapped. This shifts the phase of each 3d state by a factor of
  , where
  is the energy of the other 3d state, and
  is the NIR-XUV delay. The response function then oscillates on the line center at the frequency difference of the two states and gives a response function similar to that in equation (4). For other values of the Rabi phase, the absorption line is more complicated, but the general phenomenon persists: any process that coherently couples the two states will produce a beating at their energy difference.
For a more complete theoretical picture, the many-level time-dependent Schrödinger equation (TDSE) is solved by expanding it in a basis of numerically calculated basis states [29]. The field-free atomic energies and dipole moments are calculated using the GRASP package [30], which solves the multi-configuration Dirac–Fock equation. This approach naturally incorporates the fine-structure splittings. The configuration states are created by single excitation from the ground state [2s22p6](J = 0)+, where J is total angular momentum, and the + or − sign indicates the total parity. According to the dipole-selection rules, the ground state is coupled to [2s22p5(ns,nd)]1− states by the XUV pulse, and the 1− states are coupled to [2s22p5(np,nf)]0+, 1+ and 2+ states by the NIR laser. The maximum principal quantum number nmax is set to be 5, and only bound states are used in the calculation. We have verified that changing nmax does not change the results presented here, though including the continuum would lead to an additional loss mechanism similar to the incoherent loss model discussed above. In the experiment, it is observed that the [2s22p53s]1− states are not populated by the XUV pulse, so they are excluded from the basis. Finally, the single-atom response function is computed, as in equation (3), by Fourier transforming the time-dependent dipole obtained from the TDSE solution [28].
The TDSE calculations provide more details about the observed beating frequency. The results of the experiment and theory are qualitatively similar: the 40 fs oscillation that is observed in the experiment can also be clearly seen in the calculated results. However, in the calculation, the beating is typically observed clearly in both the (2P1/2)3d and (2P3/2)3d absorption features. This discrepancy most likely comes from uncertainty in the dipole coupling strengths between the levels in the TDSE calculation, as well as variations in the experimental NIR spectrum. The coupling strengths between the 3d and 3p states have been measured experimentally [31–36] and calculated [37–39], but there are significant discrepancies between the various sources. Additionally, the experimental NIR spectrum varies from day to day, so rather than performing calculations with experimentally measured NIR spectra, it is more revealing to theoretically consider the dependence of the observed beating on the central frequency of the pulse.
The results of the TDSE calculation for several NIR central wavelengths are shown in figure 4. An experimental NIR spectrum, shown in figure 4(a), spans from 600 to 950 nm, with a central wavelength of 760 nm. The calculations were performed using four different simulated NIR pulses, centered at 600 nm, 700 nm, 800 nm and 900 nm. Each pulse is a Fourier-transform limited Gaussian pulse with a bandwidth of about 0.27 eV, corresponding to a full width at half maximum (FWHM) duration of about 7 fs. The XUV pulse is centered at 19.5 eV and has a FWHM duration of 380 as, which corresponds to a bandwidth of 4.9 eV. The IR intensity is 5 × 10¹¹ W cm−2, and the XUV intensity is 1010 W cm−2. Lineouts of the (2P3/2)3d and (2P1/2)3d features for each central wavelength are shown in figures 4(b)–(e). The ratio between the (2P3/2)3d and (2P1/2)3d XUV-only absorption strengths in the calculation is 1.9:1, which is in agreement with the experimental data. The major disagreement between the experiment and calculation is the sign of the change in absorption when the NIR pulse follows the XUV pulse. In the experiment, the absorption features increase in strength (the optical density increases) when the NIR pulse follows the XUV pulse, while in the calculation, the absorption features are broadened and decrease in strength. Increased absorption when the NIR pulse follows the XUV pulse is consistently observed in experimental transient absorption measurements [10, 11] as a result of saturation of the absorption feature, as discussed previously. In the single atom calculations, the absorption feature is not saturated; so, when the feature is broadened, the peak height decreases because the integrated absorption is conserved.

Figure 4. Calculated results with varying central wavelengths of the perturbing pulse. (a) NIR spectra used in calculations superimposed on the experimental spectrum. Red dotted line: pulse centered at 900 nm. Green dashed line: pulse centered at 800 nm. Blue dot-dashed line: pulse centered at 700 nm. Purple dashed line: pulse centered at 600 nm. Black solid line: experimental spectrum. (b) Spectral response at the centers of (2P3/2)3d and (2P1/2)3d absorption features as a function of the NIR-XUV delay for the spectrum centered at 600 nm. Red solid line: lineout at center of (2P1/2)3d feature. Blue dashed line: lineout at center of (2P3/2)3d feature. (c) Same for the spectrum centered at 700 nm. (d) Same for the spectrum centered at 800 nm. (e) Same for the spectrum centered at 900 nm.
Download figure:
Standard image High-resolution image
The strength of the oscillation in each absorption feature clearly depends on the spectrum of the NIR pulse. For example, using a pulse centered around 600 nm, the beating in both features is very weak due to weak coupling between the 3d states and 3p states (see figure 4(b)). As the wavelength of the NIR pulse changes, the relative strength of the beating in each feature varies. In the calculations, the two 3d states couple to a number of the p- and f-states that are included in the basis set, especially at the longest NIR wavelength. This gives rise to a delay dependence that is more complex than a single-frequency oscillation.
The experimental spectrum not only spans a broad range of wavelengths but also varies from day to day, and this wavelength dependence explains the observed variations in the experimental results. There is also some dependence of the relative phase between the two lineouts on the central wavelength of the pulse. In figure 4(d), for example, the two oscillations appear only slightly out of phase rather than 180 degrees out of phase, as in figures 4(b), (c) and (e).
As the theoretical models and calculations increase in complexity, each provides additional insight into the beating observed. In the simplest model, the incoherent removal of the population from one state creates hyperbolic sidebands. When these sidebands overlap the other feature, the result is modulation of the second absorption line at a frequency that corresponds to the energy difference of the two states. Of course, population can be removed from the other state as well, creating a second set of hyperbolic sidebands. This simple model can explain why beating would be observed strongly in one line and not another if the source of the beating in one feature is simply sidebands from the depletion of another absorption feature. The next, more complex model, in which Rabi coupling between the initially populated states and a third state is included, shows that the beating can be observed due to cycling the population from one state to another through a third state and suggests that the observed beating will be sensitive to the parameters of the NIR pulse. The full TDSE calculation shows the sensitivity of the observed beating to the central wavelength of the NIR pulse, as well as the complex behavior that can occur when all of the states are excited by the attosecond pulse.
While coherences are clearly observed in the 3d states, no beating is observed in the nearby 4s states in the experimental data. This differs from the TDSE calculation in which beating is observed in the 4s features. Although the 4s states are initially excited by the XUV pulse as well, the initial coherent superposition is mostly composed of the 3d states, which have the strongest absorption in the XUV-only absorption spectrum. The weak absorption signal of the 4s states could possibly lead to the lack of observed beating in the measurement.
Attosecond transient absorption has been used to directly observe a coherent superposition created by an attosecond pulse. The attosecond pulse both creates the initial electronic wavepacket and allows the detection of the quantum beating by measuring the transmitted XUV spectrum after an NIR pulse has been used to perturb the induced polarization. The quantum beating of the wavepacket is observed most clearly in one of the two 3d absorption features. The observed beating can be described by simple theoretical models, and the dependence of the beating on the NIR wavelength and bandwidth is explored in the calculations.
Acknowledgments
This work was supported by the Director, Office of Science, Office of Basic Energy Sciences and by the Division of Chemical Sciences, Geosciences, and Biosciences of the US Department of Energy at LBNL under contract nos. DE-AC02-05CH11231 and at LSU under contract no. DE-FG02-13ER16403. ARB acknowledges funding from NSF-GRFP. BB acknowledges support from the Alexander von Humboldt Foundation. SRL acknowledges the support of a National Security Science and Engineering Faculty Fellowship. The authors thank Camila Bacellar, Adam Chatterley, Mike Ziemkiewicz and He Wang for the loan of optics.