


Abstract
An acoustic plasmon is predicted to occur, in addition to the conventional two-dimensional (2D) plasmon, as the collective motion of a system of two types of electronic carriers coexisting in the same 2D band of extrinsic (doped or gated) graphene. The origin of this novel mode stems from the anisotropy present in the graphene band structure near the Dirac points K and K'. This anisotropy allows for the coexistence of carriers moving with two distinct Fermi velocities along the  and
and  directions, which leads to two modes of collective oscillation: one mode in which the two types of carriers oscillate in phase with one another (this is the conventional 2D graphene plasmon, which at long wavelengths (
 ) has the same dispersion,
  , as the conventional 2D plasmon of a 2D free electron gas), and the other mode found here corresponds to a low-frequency acoustic oscillation (whose energy exhibits at long-wavelengths a linear dependence on the 2D wavenumber q) in which the two types of carriers oscillate out of phase. This prediction represents a realization of acoustic plasmons originated in the collective motion of a system of two types of carriers coexisting within the same band.
Export citation and abstract BibTeX RIS

Content from this work may be used under the terms of the Creative Commons Attribution 3.0 licence. Any further distribution of this work must maintain attribution to the author(s) and the title of the work, journal citation and DOI.
In recent years, interest in graphene [1] has grown impressively for both fundamental research and technological applications [2–4]. This is due to the fact that graphene exhibits a number of interesting properties, related mainly to its novel electronic structure near the Fermi level, represented by the so-called Dirac cone. A major issue is represented in this case by the variation of the charge carrier density, which is caused by several conditions, including, for example, the shape and defects of graphene flakes, charge transfer processes with the supporting material [5], chemical doping [6, 7], and the application of gating potentials [1]. The appearance of a two-dimensional (2D) sheet plasmon in graphene adsorbed on a variety of supporting materials has been observed in several experiments [8–13], where monolayer graphene happens to be doped by charge transfer to or from the substrate. On the theoretical side, a number of calculations have have been able to reproduce a 2D sheet plasmon [14–24] in extrinsic (doped or gated) free-standing graphene.
In this paper, we present an ab initio description of the energy-loss spectrum of both intrinsic (undoped and ungated) and extrinsic free-standing monolayer graphene. Starting with pristine (intrinsic) graphene, we include the effect of electron injection by simply upshifting the Fermi level from the Dirac point, that is by working under the assumption that the graphene band structure is unaffected by doping. We find that the anisotropy that is present in the graphene band structure near the Dirac points K and K' allows for the coexistence of a majority of carriers moving with two different velocities along the  and
and  directions, thus leading to a remarkable realization of the old idea [25] that low-energy acoustic plasmons (whose energy exhibits a linear dependence on the wavenumber) should exist in the collective motion of a system of two types of electronic carriers. Our energy-loss calculations, which we carry out in the random-phase approximation (RPA), show the existence of a low-frequency acoustic oscillation (in which the two types of carriers oscillate out of phase), in addition to the conventional 2D graphene collective mode described in [14, 15] (in which the two types of carriers oscillate in phase with one another).
We start with the following expression for the in-plane RPA complex dielectric matrix of a many-electron system consisting of periodically repeated (and well separated) graphene 2D sheets (atomic units are used throughout, unless stated otherwise):

Here,  is a three-dimensional (3D) reciprocal-lattice vector;
  and
and  represent an in-plane 2D reciprocal-lattice vector and an in-plane first-Brillouin-zone (BZ) 2D wavevector, respectively;
  denotes the 2D Fourier transform of the Coulomb potential; and

represents the 3D Fourier transform of the density response function of non-interacting electrons confined to a normalization volume  and occupying the band states
  ,
,  , with energies
  ,
,  , and occupation factors
  ,
,  ,
,  being an in-plane 2D wavevector in the first BZ. These states and energies are the eigenvectors and eigenvalues of a single-particle Hamiltonian, which we take to be the Kohn–Sham (KS) Hamiltonian of density functional theory (DFT).
The inelastic scattering cross section corresponding to a process in which (after the scattering of external electrons or electromagnetic waves) an electronic excitation of wavevector  and energy ω created at the graphene 2D sheet is proportional to the energy-loss function
 ![${\rm Im}[-\epsilon _{{\bf g},{\bf g}}^{-1}({\bf q},\omega )]$](https://content.cld.iop.org/journals/1367-2630/16/8/083003/revision1/njp497429ieqn20.gif) . Collective excitations (plasmons) are dictated by the zeros in the real part of the macroscopic dielectric function
. Collective excitations (plasmons) are dictated by the zeros in the real part of the macroscopic dielectric function

in an energy region where the imaginary part is small.
Our ab initio scheme begins with the KS eigenvalues and eigenvectors, which we calculate in the local-density approximation (LDA) by using the Perdew–Zunger parametrization [26] of the uniform-gas correlation energy. We use a plane-wave basis set (with a cut-off energy of 25 Hartrees) and a norm-conserving pseudopotential of the Troullier–Martins type [27]. Our system is made using periodically repeated 2D graphene sheets separated by a distance of  a.u. The BZ integration is carried out using an unshifted
  Monkhorst–Pack grid [28], which results in a 3600
  -point sampling of the BZ. From the converged electron density, we calculate the KS single-particle energies and orbitals on a denser
  -point mesh (
 ) including up to 60 bands. These KS energies and orbitals are plugged into equation (2), which we use to obtain the χ0 matrix with up to
  -vectors. The in-plane RPA complex dielectric matrix is then computed from equation (1). For the wavevectors and energies of interest here (below the π plasmon at
  ), stable results were obtained by including in equation (2) 51 reciprocal-lattice vectors of the form
  .
.
In the case of intrinsic graphene, the calculated energy-loss function presents three well-known distinct features. First of all, there is a broad peak-like structure starting at low values of q and ω (see figure 1), which originates at interband  single-particle (SP) excitations [14, 15] and was erroneously interpreted as a cone plasmon in [22]. Second, there is the π plasmon (πP) starting at
  (see figure 1) (also present in graphite [29]), which in the case of monolayer graphene is red-shifted and exhibits a linear dispersion [30, 31] distinct from the parabolic dispersion in graphite. Third, there is the broad high-energy graphene
  plasmon peak starting at
  eV (not visible in figure 1), which corresponds to the graphite
  plasmon at
  eV [32].

Figure 1. 2D plot of the energy-loss function of intrinsic graphene vs the magnitude of the in-plane wavevector  along the
  direction (horizontal axis) and the energy ω(vertical axis).
Download figure:
Standard image High-resolution imageFor extrinsic graphene, we adjust the occupation factors of equation (2) to account for positive Fermi-energy shifts  and
and  relative to the Dirac point, corresponding to charge-carrier densities of
  cm-2 and
  cm-2, respectively7
. Figure 2 exhibits a comparison of the RPA energy-loss function that we have obtained along the Γ K and Γ M directions. This doping affects neither the π nor the σ-π plasmon. Important differences are visible, however, at low q and ω, where we can identify the opening of a gap in the SP excitation spectrum of extrinsic graphene. More importantly, two collective modes (plasmons) are clearly visible in the case of extrinsic graphene (which are absent in intrinsic graphene): (i) the conventional graphene 2D plasmon (2DP) [14, 15], which within the gap (of the SP excitation spectrum) has no damping (and exhibits the same dispersion,
cm-2, respectively7
. Figure 2 exhibits a comparison of the RPA energy-loss function that we have obtained along the Γ K and Γ M directions. This doping affects neither the π nor the σ-π plasmon. Important differences are visible, however, at low q and ω, where we can identify the opening of a gap in the SP excitation spectrum of extrinsic graphene. More importantly, two collective modes (plasmons) are clearly visible in the case of extrinsic graphene (which are absent in intrinsic graphene): (i) the conventional graphene 2D plasmon (2DP) [14, 15], which within the gap (of the SP excitation spectrum) has no damping (and exhibits the same dispersion,  , as the conventional plasmon of a 2D electron gas [33]) and outside the gap has a finite linewidth, and (ii) a well-defined low-frequency mode (the new acoustic plasmon, AP), whose energy exhibits at long wavelengths (
 ) a linear dependence on q. Figure 2 shows that while the 2DP mode is present along both directions
  and
and  , the AP mode is present only along
  ; this figure also shows that the energy dispersion of the acoustic plasmon strongly depends on the doping level.
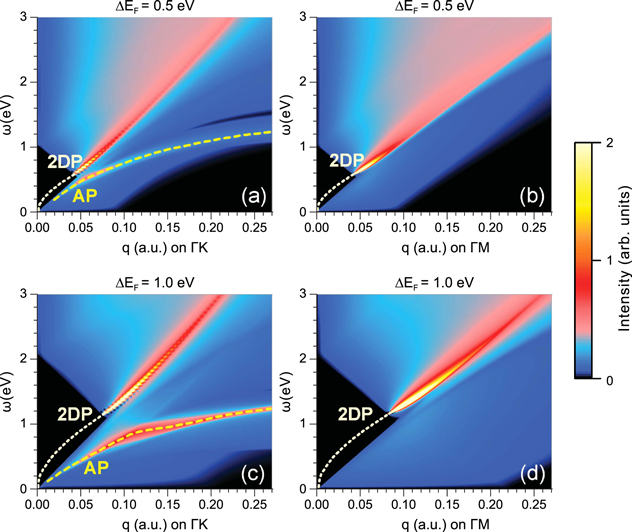
Figure 2. 2D plot of the energy-loss function of extrinsic graphene vs the magnitude of the in-plane wavevector  (along the (a, c)
  and (b, d)
  directions) (horizontal axis) and the energy ω (vertical axis). The Fermi level has been shifted (a, b)
  and (c, d)
  above the Dirac point. The dotted lines represent the energy dispersion of the conventional 2D plasmon (2DP), as obtained from the zeros of the real part of the macroscopic dielectric function
 ![$[{{\epsilon }_{M}}]$](https://content.cld.iop.org/journals/1367-2630/16/8/083003/revision1/njp497429ieqn52.gif) . The dashed lines simply highlight the energy dispersion of the acoustic plasmon (AP).
. The dashed lines simply highlight the energy dispersion of the acoustic plasmon (AP).
Download figure:
Standard image High-resolution imageIn order to demonstrate that the energy-loss peaks that are visible in figure 2 correspond to collective excitations, we have plotted in figure 3 the energy-loss function (red dotted line) for a given value of q (q = 0.09 a.u.) and  eV, together with the real (black solid line) and the imaginary (green dashed line) parts of the macroscopic dielectric function
  of equation (3). This figure shows that Re
 ![$[{{\epsilon }_{M}}]$](https://content.cld.iop.org/journals/1367-2630/16/8/083003/revision1/njp497429ieqn55.gif) exhibits two distinct zeros (marked by the open circles I and II) in energy regions where
exhibits two distinct zeros (marked by the open circles I and II) in energy regions where  is small and the energy-loss function is, therefore, large. These two zeros (each of them being associated to the two maxima B1 and B2 in Im
 ![$[{{\epsilon }_{M}}]$](https://content.cld.iop.org/journals/1367-2630/16/8/083003/revision1/njp497429ieqn57.gif) ) represent a signature of well-defined collective excitations: (i) the higher-energy plasmon (the conventional graphene 2D plasmon, 2DP) occurs at an energy (just above the upper edge
) represent a signature of well-defined collective excitations: (i) the higher-energy plasmon (the conventional graphene 2D plasmon, 2DP) occurs at an energy (just above the upper edge  of the intraband SP excitation spectrum, vF
being the graphene Fermi velocity) where only interband SP excitations are possible. (ii) The low-energy plasmon (the new acoustic plasmon, AP) occurs at an energy that stays below
of the intraband SP excitation spectrum, vF
being the graphene Fermi velocity) where only interband SP excitations are possible. (ii) The low-energy plasmon (the new acoustic plasmon, AP) occurs at an energy that stays below  , so it is damped through intraband SP excitations; nonetheless, Im
 ![$[{{\epsilon }_{M}}]$](https://content.cld.iop.org/journals/1367-2630/16/8/083003/revision1/njp497429ieqn60.gif) is still considerably small at this energy, which confirms that this low-energy mode represents a well-defined collective excitation as well.
is still considerably small at this energy, which confirms that this low-energy mode represents a well-defined collective excitation as well.

Figure 3. The energy-loss function Im ![$[-\epsilon _{{\bf 0},{\bf 0}}^{-1}({\bf q},\omega )]$](https://content.cld.iop.org/journals/1367-2630/16/8/083003/revision1/njp497429ieqn61.gif) (red dotted line), Re
(red dotted line), Re ![$[{{\epsilon }_{M}}({\bf q},\omega )]$](https://content.cld.iop.org/journals/1367-2630/16/8/083003/revision1/njp497429ieqn62.gif) (black solid line), and Im
(black solid line), and Im ![$[{{\epsilon }_{M}}({\bf q},\omega )]$](https://content.cld.iop.org/journals/1367-2630/16/8/083003/revision1/njp497429ieqn63.gif) (green dashed line) of extrinsic graphene (
(green dashed line) of extrinsic graphene ( eV) vs the energy ω for a fixed value of the magnitude of q (q = 0.09 a.u.) along the
  direction.
Download figure:
Standard image High-resolution imageThe existence of the low-energy acoustic plasmon could not possibly have been anticipated in the framework of the so-called 'Dirac-cone approximation' [14, 15], simply because an oversimplified isotropic graphene band structure was considered in the vicinity of the K-point. A signature of such a mode has been detected recently [22–24]; but it was erroneously interpreted in [22] as a nonlinear mode along the nonlinear branch of the cone structure, and it was not discussed in [23, 24].
With the aim of revealing the origin of the low-energy acoustic plasmon (the new plasmon), we show in figure 4: (i) the dispersion of the graphene π and  bands along various high-symmetry paths originating at the K point (figure 4(a)) and (ii) the density-of-states distribution in these bands (figures 4(b), (c)). The graphene π and
  energy dispersions are plotted in figure 4(a) along the K
  and KM branches in the
  direction, and along the KK branch in the
  direction, together with the isotropic energy dispersion that is obtained in the Dirac-cone approximation.
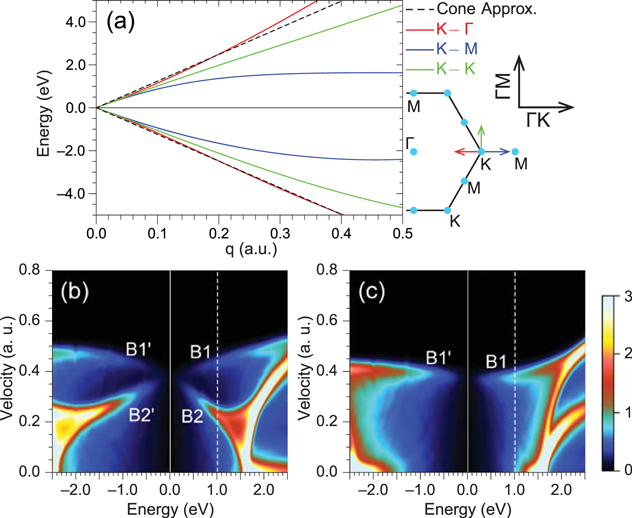
Figure 4. (a) The graphene DFT band structure in the vicinity of the K point, as obtained along three high-symmetry paths: the  and KM branches (red and blue lines, respectively) in the
  direction, and the KK branch (green line) in the
  direction; the Dirac-cone approximation is represented by a black dashed line. Partial density of states along (b)
  and (c)
  vs the single-particle energy E and the group velocity8. The solid and dashed vertical lines represent the Fermi level of intrinsic graphene and extrinsic graphene (with
  ), respectively.
Download figure:
Standard image High-resolution imageThe band-structure anisotropy that is visible in figure 4(a) implies the unique behavior of the density of states shown in figures 4(b) and (c) as a function of the single-particle energy E and the group velocity (see footnote 8). Along the  direction (figure 4 (c)) the density of states is peaked (at the energies of interest, i.e., below
  eV) around one single Fermi velocity
  m s−1 (peak B1 above the Dirac point and peak
  below), as occurs in a free-electron gas. On the other hand, the density of states along the
  direction (figure 4 (b)) is peaked at two distinct velocities (peaks B1 and B2 above the Dirac point, and
  and
and  below) within the very same band. Since for a low wavevector along a given direction the number of allowed intraband transitions—dictated by Im
 ![$[{{\epsilon }_{M}}]$](https://content.cld.iop.org/journals/1367-2630/16/8/083003/revision1/njp497429ieqn89.gif) —is known to be proportional to the density of states with group velocity along that direction [35], we conclude that intraband transitions along the
—is known to be proportional to the density of states with group velocity along that direction [35], we conclude that intraband transitions along the  direction happen to be determined by the coexistence of carriers moving with two distinct Fermi velocities, yielding the maxima B1 and B2 in figure 3. This leads to two modes of collective oscillation: (i) one mode (the conventional 2D plasmon, 2DP) in which the two types of carriers oscillate in phase with one another with an energy that is along
  slightly larger than along
  (where only one type of carriers participate and the 2DP dispersion—outside the gap—simply follows the upper intraband edge vFq
[14, 15]), and (ii) another mode (the new acoustic plasmon, AP) which corresponds to an acoustic oscillation of lower frequency in which the two types of carriers residing in branches B1 (
(where only one type of carriers participate and the 2DP dispersion—outside the gap—simply follows the upper intraband edge vFq
[14, 15]), and (ii) another mode (the new acoustic plasmon, AP) which corresponds to an acoustic oscillation of lower frequency in which the two types of carriers residing in branches B1 ( ) and B2 (
 ) oscillate out of phase.
Hence, hereby we shed light on the observed deviation (along the  direction) of the 2DP dispersion curve towards energies that are (outside the gap) above the upper intraband edge vFq
[9]. And hereby we predict the existence (along the
direction) of the 2DP dispersion curve towards energies that are (outside the gap) above the upper intraband edge vFq
[9]. And hereby we predict the existence (along the  direction) of a remarkable acoustic plasmon as the collective motion of a system of two types of electronic carriers coexisting in the very same 2D band of extrinsic graphene.
The complete anisotropic dispersion of both plasmons (2DP and AP) is shown in figures 5 and 6, respectively, where the plasmon energy is plotted vs the in-plane 2D wavevector q. Figure 5 clearly shows that the conventional 2D plasmon dispersion is (i) isotropic at wavevectors below  a.u., where neither intraband nor interband transitions are available and there is no damping, and (ii) anisotropic at larger wavevectors (reflecting the 6-fold symmetry of the graphene BZ) with the plasmon energy being along the
  direction larger than along the
  direction (as discussed above).
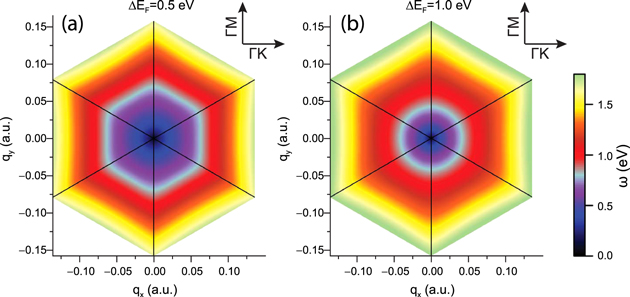
Figure 5. Energy (in eV) of the conventional 2D plasmon (2DP) of extrinsic graphene vs the in-plane 2D wavevector q. The Fermi level has been shifted (a) 0.5 eV and (b) 1.0 eV above the Dirac point.
Download figure:
Standard image High-resolution image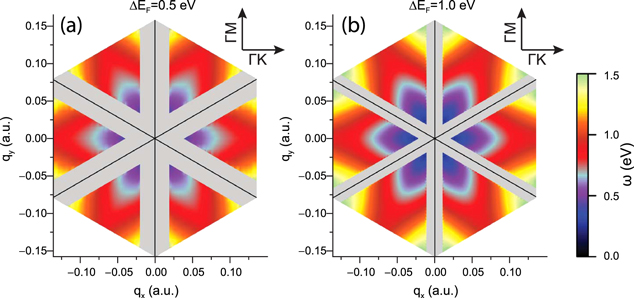
Figure 6. Energy (in eV) of the acoustic plasmon (AP) of extrinsic graphene vs the in-plane 2D wavevector q. The Fermi level has been shifted (a) 0.5 eV and (b) 1.0 eV above the Dirac point. The grey color shows regions where the AP is not found to exist. For the  mesh and numerical broadening used in our calculations, we have been able to trace the existence of the graphene AP down to
  eV and
  eV for
  and
and  , respectively.
Download figure:
Standard image High-resolution imageFigure 6
shows that the new acoustic plasmon exhibits a remarkable anisotropy. At small wavevectors, the energy of the AP increases linearly with the magnitude of the wavevector, with a slope that is minimum along the  direction and increases as one moves away from that direction until the AP completely disappears at wavevectors q along the
  direction (grey areas). Since, as seen in figure 4(b), the Fermi velocity in branches B2 and
  strongly depends on the position of the Fermi level, the initial slope of the AP dispersion (determined by the corresponding Fermi velocity [36]) significantly changes upon variation of the doping, as one can appreciate from comparison of figures 2 (a) and (c). We also note that, since the density-of-states double-peak structure is present also below the Dirac point, the AP plasmon should occur for p-doping as well. Indeed, we have found that the AP is also present for negative
  . In figure 7 we show the AP energy dispersion along the
  direction for various values of the doping, both p-doping (
 ) and n-doping (
 ). We clearly see that, notwithstanding the different doping values, the AP mode shows a linear dispersion in the
  limit.

Figure 7. Energy dispersion of the graphene AP plasmon along the  direction, for various values of the doping.
Download figure:
Standard image High-resolution imageIn summary, we have demonstrated that as a consequence of the fact that two types of carriers in extrinsic graphene (moving with two distinct Fermi velocities) coexist within the very same 2D band, (i) the conventional 2D plasmon (corresponding to the two types of carriers oscillating in phase with one another) disperses along the  direction with an energy that is higher than along the
  direction, and (ii) there is an additional acoustic plasmon (corresponding to the two types of electrons oscillating out of phase). Low-energy acoustic plasmons are known to exist [36–45] at metal surfaces where a two-component scenario (one component consisting of a quasi 2D surface-state band and the other component being the underlying bulk 3D continuum [36]) is realized. In graphene a two-component scenario is realized as well, but within the very same 2D energy band. Our calculations indicate that, notwithstanding the damping, the graphene acoustic plasmon exhibits a spectral weight that is comparable to the spectral weight of the conventional 2D plasmon. As a consequence, the graphene acoustic plasmon discussed here should be accessible by high-resolution angle-resolved energy-loss (HREELS) experiments on extrinsic (doped) graphene. Our analysis suggests that such an acoustic plasmon might exist in other materials as well, as long as an anisotropic band is present near the Fermi level.
Acknowledgments
MP acknowledges the financial support of MIUR (FIRB-Futuro in Ricerca 2010—Project PLASMOGRAPH grant no. RBFR10M5BT), the European Commission, the European Social Fund and Regione Calabria, (POR) Calabria—FSE 2007/2013. VMS acknowledges financial support from the Spanish MICINN (no. FIS2010-19609-C02-01), the Departamento de Educación del Gobierno Vasco, and the University of the Basque Country (no. GIC07-IT-366-07).
Footnotes
- 7
Charge-carrier densities achievable with gating potentials are typically of the order of 1012–1013 cm-2 [1]. Higher doping levels can be achieved through chemical doping; indeed, a displacement of the Fermi level as high as
 eV, with respect to the Dirac point, has been achieved after the intercalation of alkali metals on supported graphene [7].
 - 8
We define the group velocity for each band n as
[34], where represents the energy dispersion of the nth band. The partial density of states is then readily calculated by 'counting' the number of states with a given energy E and velocity in the -direction. By integrating over , the conventional density of state is obtained as a function of E.


