


Abstract
The characteristic transition of the centre at 637 nm is between and triplet states. There are also intermediate and singlet states, and the infrared transition at 1042 nm between these singlets is studied here using uniaxial stress. The stress shift and splitting parameters are determined, and the physical interaction giving rise to the parameters is considered within the accepted electronic model of the centre. It is established that this interaction for the infrared transition is due to a modification of electron–electron Coulomb repulsion interaction. This is in contrast to the visible 637 nm transition where shifts and splittings arise from modification to the one-electron Coulomb interaction. It is also established that a dynamic Jahn–Teller interaction is associated with the singlet state, which gives rise to a vibronic level 115 cm−1 above the electronic state. Arguments associated with this level are used to provide experimental confirmation that the is the upper singlet level and is the lower singlet level.


Content from this work may be used under the terms of the Creative Commons Attribution 3.0 licence. Any further distribution of this work must maintain attribution to the author(s) and the title of the work, journal citation and DOI.
1. Introduction
The negatively charged nitrogen vacancy centre in diamond () [1] exhibits optically induced spin polarization. This property underpins many exciting applications of the centre in fields such as magnetic sensing [2–9], biological imaging [10–12], and quantum information processing [13–17]. The principle zero-phonon line (ZPL) associated with the centre is at (, 15687 cm−1) and is found by uniaxial stress to involve a transition between a ground state of symmetry and an excited state of symmetry at a trigonal site [18]. Here we label this transition since it is in the visible spectrum, and its fluorescence band is shown in figure 1. The ground and excited states are spin triplets [19–23] and optical excitation of this transition results in the spin being polarized into , although this does not arise from direct optical cycling as the optical transitions are spin-conserving [24]. When the triplet system is excited there is also relaxation via intermediate singlets and this decay causes the spin polarization. A weak emission band in the infrared (figure 1) with a ZPL at 1042 nm (, 9597 cm−1) is associated with decay between these two singlet levels [25].


Figure 1. Electronic energy level scheme and fluorescence bands for the NV transitions. (a) The primary transition between triplet ground and excited states is predominantly spin conserving. Decay via the intermediate singlets gives rise to spin polarization by preferentially switching spin from = ±1 to . (b) The low temperature (10 K) emission spectrum for the visible transition . Emission was excited with 100 mW laser at 532 nm. (c) The infrared band lies on the tail of the visible emission and has an integrated area of 1 ± 0.2 × 10⁻³ compared to that of the visible band. It is understood that the weakness of this fluorescence band is due to strongly competing non-radiative decay between the singlets illustrated by the wavy arrow in (a) [26].


Download figure:
Standard image High-resolution imageA study of this emission (which we call ) provides an opportunity to better understand the electronic levels in this important decay channel. Uniaxial stress is the experimental technique of choice [27–29]. In these experiments external stress close to the limits of fraction is applied to the diamond along well-defined crystal axes while the displacement and splitting of the ZPL are measured. The precise effects depend on the orientation of the impurity centre relative to the stress axis, and provide information about the orbital symmetry of the states involved with optical transitions. A previous uniaxial stress study has shown that the transition is between levels of and symmetry [25], and this symmetry assignment is not in question. However, in that study the specific transitions were not correctly identified and this led to an inaccuracy of the stated stress parameters. Here the transitions are unambiguously identified and correct stress parameters are determined. In addition we experimentally resolve the long-standing contention regarding the order of the singlets [25, 30–33] and establish the to be the lower singlet. The magnitudes of the stress parameters are considered within the current electronic model of the centre. It is concluded that the interaction giving rise to the shift and splitting of the infrared ZPL is different from that giving rise to the shifts and splittings of the ZPL and ZPL.


2. Uniaxial stress theory
The theory for uniaxial stress applied to an transition at a site of trigonal symmetry in a cubic crystal has been given on several occasions [27–29, 34] and has been developed by Davies and Hamer [18, 35] for the case of the NV centre. In general, stress along the symmetry axis results in shifts of the energy levels while transverse stress lifts the degeneracy of the state as illustrated in figure 2. The elements of the stress tensor sij as applied to the cubic crystal can be expressed in terms of the irreducible representations appropriate for the trigonal site symmetry, and the stress perturbation at the NV site is given by


where , are symmetry adapted electronic operators transforming as A1 irreducible representations and , , , are operators transforming as components of E irreducible representations [18, 29]. The stress sij is given in terms of the lattice co-ordinates. The effects of this interaction on an transition have been described by Davies and Hamer [18] in terms of the following reduced matrix elements


For stress applied along , and crystallographic directions, the resultant relative strength and polarization of the transitions have been given in previous publications [18, 27–29, 34] and are summarized in table 1. Since the NV centre is now known to involve both and transitions as indicated in figure 1 the selection rules for both cases have been included in table 1. Stress along , or directions is always in a reflection plane or at right angles to a reflection plane, and consequently the site symmetry is always lowered to . Therefore, for every case the or irreducible representations for are included in the table.


Figure 2. Uniaxial stress applied to an transition at a site of trigonal symmetry. (a) Stress along the symmetry axis can shift the states, and may cause the optical transition to shift in energy. (b) Transverse stress lifts the degeneracy of an state, causing the optical transition to split into two resolvable transitions. These situations are presented in more detail specifically for the centre in figure 7.


Download figure:
Standard image High-resolution imageTable 1. Summary of shifts, splittings and polarization for stress applied along several crystallographic directions. The values are from reference [18] although here the values are normalized to an intensity of 8/3 at zero stress (each of the four orientations contributing a relative oscillator strength of two). Intensities are given for π (electric field vector parallel to stress) and σ (perpendicular) polarizations. The selection rules were given for transitions [18] and are extended here to also cover transitions. The change results in an interchange of X and Y and change of sign of B and C.


| E state | |||||||||
|---|---|---|---|---|---|---|---|---|---|
| Stress | Orientation | Sym | Energy | π | σ | π | σ | ||

|
|||||||||
| 0 | 2 | ||||||||
| 0 | 2 | ||||||||

|
0 | 1 | 0 | 1 | |||||
| 0 | |||||||||
| 0 | |||||||||

|
0 | 2 | 0 | 0 | |||||
| 0 | 0 | 2 | 0 | ||||||
| 2 | 0 | 0 | 0 | ||||||
| 0 | 2 | 0 | 0 | ||||||


3. Experimental details
Diamond cubes with dimensions were used. They have nitrogen concentrations of ∼100 ppm and were irradiated and annealed to give concentrations of ∼5 ppm. The cubes had either , and faces or , and faces. These were used for application of stress along , and directions by means of a pneumatic driven rod. The samples were within a cryostat and could be cooled to liquid helium or liquid nitrogen temperatures as required.


For the majority of the work the emission was excited by a laser at a wavelength of 532 nm within the vibrational sideband of the absorption transition. The emission at right angles was dispersed by a monochromator and detected by a photomultiplier (for ) or a cooled germanium detector (for ). A tunable dye laser at the wavelength of the visible ZPL was used for selective excitation techniques to assist with the assignments of the spectra.


4. Results
4.1. Uniaxial stress measurements along and


Although both the visible [18] and infrared [25] transitions involve an transition at a site of trigonal symmetry, involves an state whereas involves an . In addition, the state is the upper level for but for the is the lower level (proven later). These two differences cancel to result in the same stress patterns for the and transitions. Conveniently this allows the visible and infrared spectra to be easily compared to obtain the relative magnitudes of the and stress parameters. This is the intention of presenting figure 3 where spectra of and are depicted for the same stress applied along the and directions.


Figure 3. Uniaxial stress spectra for on the left and on the right. The upper traces (a) and (b) show spectra for stress and the lower traces (c) and (d) show spectra for stress. Excitation was from 100 mW laser at 532 nm, and emission was observed at right angles and recorded separately in (green) and (magenta) polarizations. Excitation polarization was perpendicular to the stress direction () with the exception of the dashed traces in (c) and (d) where the laser polarization was parallel to stress () and so the axial centres were not excited. The sample temperature was ∼150 K. Variation of stress across the sample prevented the lines from being well resolved (and breakage prevented improvement of the data). However, identical stress settings allow the relative size of the shifts and splittings to be compared between and . The straight lines and annotations indicate the stress parameters calculated later (not direct fits). The spectra are consistent with [18] and the stress parameters are those from [18].


Download figure:
Standard image High-resolution imageFor stress along the splittings are the same for all orientations of the centre. The ZPL is split into two components with one component polarized (electric field vector perpendicular to stress) and the other predominantly polarized (parallel to stress). The splittings are determined by the value of the B parameter (see table 1) and the average shift is given by . It can be seen from comparing figures 3(a) and (b) that is marginally larger than whereas is only about one third of .


For stress there are two subsets of centres (table 1). One subset contains the centres oriented along the stress direction, for which there is no change of symmetry. This means there is no splitting, but the transition is shifted by (table 1). NV− centres in this orientation are not excited when the electric field vector of the excitation is parallel to their axis, since the transitions do not involve a z dipole moment. Consequently this orientation does not contribute to the dashed traces of figures 3 (c) and (d) where this excitation polarization is adopted. The NV− centres in this orientation do give a line when transverse excitation is used. This 'extra' line is barely discernible in the case of the infrared spectrum as it overlaps the other features indicating a very small shift ( + ). In contrast, there is a large shift of this line for the visible transition. Since and are known from the above stress measurements, it can be readily deduced that for the visible is large and negative whereas for the infrared is small. This information is consistent with average shifts for the centres oriented at 70° to the stress given by (table 2). The ZPL splitting for these centres depends on the C parameter, and it is apparent that is about one third of .


Table 2. Stress parameters of the ZPL compared to those for , and N3, given in (meV ). These are all transitions at trigonal vacancy centres with adjacent nitrogen atoms. The values for are taken from [18] although B and C sign change is appropriate for the transition. Uncertainty estimates for the ratios were calculated assuming a 7% uncertainty in the parameters from [18]. The values for NV0 are from [35] and N3 from [34].


| N3 | |||||
|---|---|---|---|---|---|
| ratio | 575 nm | 415 nm | |||
| Param (pert) | cm−1(meV) | cm−1 (meV) | cm−1(meV) | cm−1(meV) | |
| 3.9 ± 0.3 (0.48) | 11.9 (1.47) | 0.33 ± 0.05 | 8.5 (1.05) | 4.0 (0.5) | |
| −3.1 ± 0.3 (−0.38) | −31.0 (−3.85) | 0.10 ± 0.02 | −28.6 (−3.55) | 34 (4.2) | |
| −9.9 ± 0.5 (−1.23) | −8.38 (−1.04) | 1.2 ± 0.1 | 12.5 (1.55) | −8.5 (−1.55) | |
| −5.6 ± 0.5 (−0.69) | −13.6 (−1.69) | 0.41 ± 0.07 | 14.1 (1.76) | −11 (−1.9) |


The conclusion that and are a factor of three smaller than their counterparts is consistent with the strain parameters reported previously [25]. However, there is no consistency with the and parameters. Here we have established that is an order of magnitude smaller than (instead of the factor of 2.7 given previously), and that (instead of the reverse). The previous values relied on the interpretation of spectra for stress along the direction and, therefore, the spectra for this stress direction are re-investigated in the next section.


4.2. Uniaxial stress along stress using selective excitation

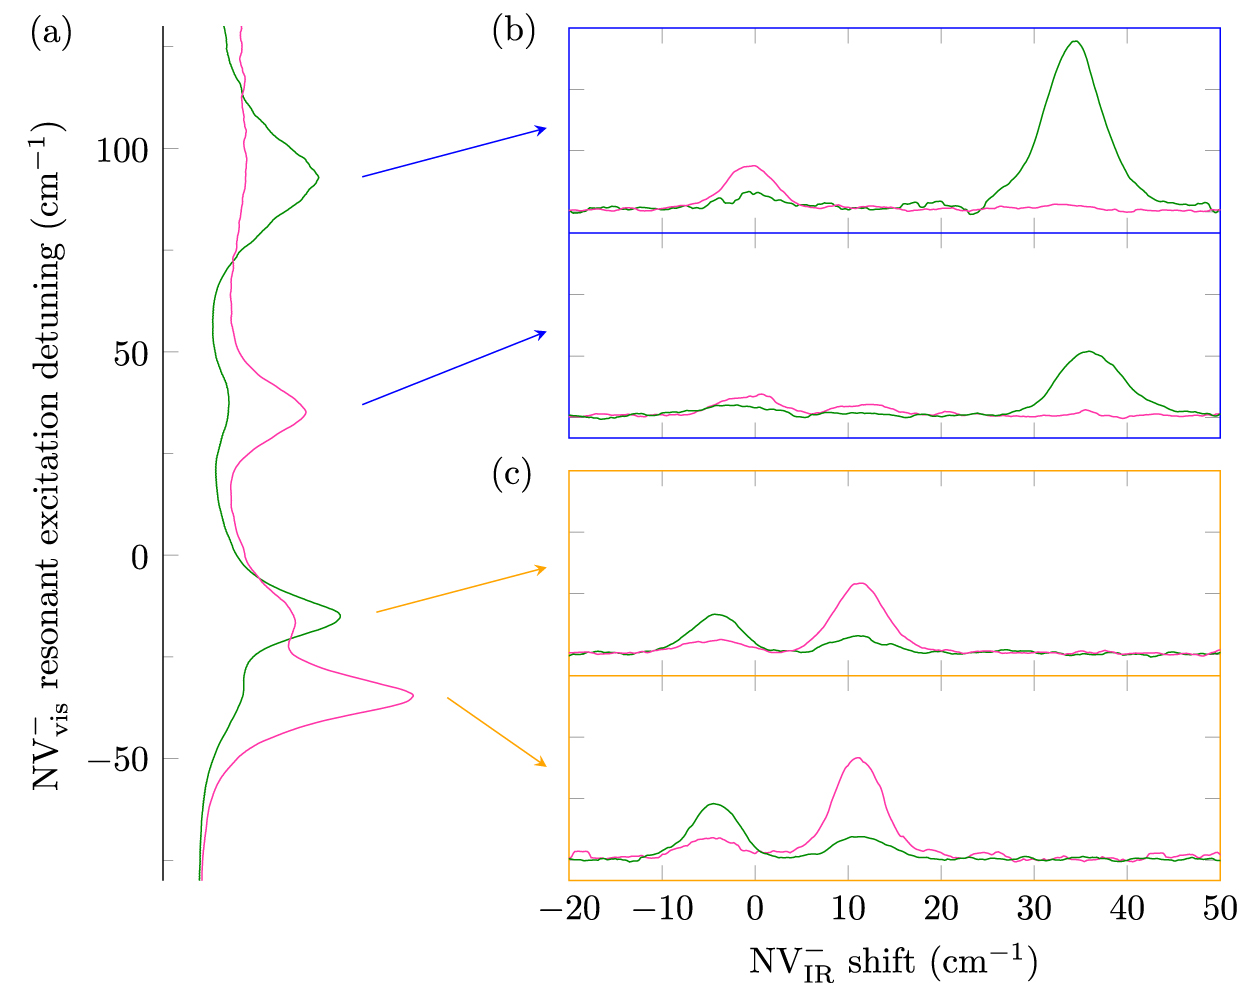
Stress along causes the NV− centres to form two distinct sets of orientations, both of which have some component of transverse strain and therefore exhibit splitting (table 1). This produces a four-line structure in the spectrum, and the determination of strain parameters depends heavily on a correct assignment of each line to a transition in a given NV orientation. Here we use selective excitation techniques to provide reliable assignments.

A 200 mW tunable dye laser was swept through the ZPL and the emission was detected in the vibronic sideband between 650 nm and 750 nm. Weak (1 mW) 532 nm laser light was applied simultaneously to inhibit loss of signal through hole burning. The polarized excitation spectra for a stress of obtained in this way is shown in figure 4(a). This excitation spectrum is consistent with the measurements of Davies and Hamer obtained in absorption [18]. The two higher energy lines in excitation (at 632.4 nm and 634.8 nm) are associated with centres at right angles to the stress (orientations ③ and ④, table 1), and the lower energy lines are associated with orientations ① and ② which are at 36° to the stress [18].


Figure 4. Uniaxial stress spectra using resonant excitation to assign peaks. The exciting laser and IR detection were along , and the sample temperature was 10 K. (a) Excitation spectra of the transition were obtained by sweeping the excitation laser between 640 nm and 630 nm in π (green) and σ (magenta) polarizations. Emission was detected within the vibrational band at . (b) IR spectra obtained with the excitation laser at fixed frequency resonant with the visible peak corresponding to the orientations ③ and ④ perpendicular to the stress (see table 1). The emission was detected in π (green) and σ (magenta) polarizations. (c) The lower two traces framed in orange correspond to resonant excitation of orientations ① and ② at an angle of to the stress.


Download figure:
Standard image High-resolution imageThe detection filter was changed to measure emission in the band. Resonantly exciting the two higher energy transitions gave the polarized spectra shown in figure 4(b). Since these laser frequencies only excite the orientations ③ and ④ which are orthogonal to the stress, the spectrum shows only two lines. These lines are clearly either predominantly π or σ polarized, enabling them to be assigned to the and components according to table 1. Tuning the laser to the lower energy transitions caused only orientations ① and ② to be excited, producing the spectra shown in figure 4(c). Again the lines are strongly polarized and readily assigned using table 1. There is always the equivalence between the visible and infrared spectra described in previous section but it is noted that the order of the π and σ lines for the 36° case are reversed between the visible and infrared spectra. This results from a reversal of the relative strengths of the B and C stress parameters between the visible and infrared cases with in one case and in the other.


These selective excitation measurements provide the first unambiguous assignments of the infrared spectral features for stress. It is now clear that the significantly different and spitting parameters given previously [25] resulted from an incorrect assignment of the lines for stress. In that work it was assumed that the four peaks were in the same order as for which does not turn out to be the case.


Having established the identity of each line in the spectrum, more conventional photoluminescence measurements were made using the 532 nm non-resonant excitation. In this way the position of the four lines in the stress spectra were followed for stress values in the range 0–3 GPa, and the shifts and splittings are shown in figure 5. This figure also includes the results for stress along and , where there is less ambiguity in the assignments of the lines and therefore no advantage to adopting selective excitation techniques. It can be seen from the figures that the displacements with stress are not always linear and this requires consideration before the values of the stress parameters can be deduced.


Figure 5. Strain splitting of the IR line for (a) , (b) and (c) . The vertical scale is reversed to correspond to the emission spectrum where the lower level splits. The spectra were measured independently in π (circles) and σ (triangles) polarization. For each stress direction the data points are coloured to match the sets of NV orientations given in table 1. The error in stress is large in (a) due to the sample breaking over the course of the measurement, which made it difficult to correct for hysteresis in the stress aparatus. In all three cases, an extra line was observed at for higher stresses as discussed in section 4.3.


Download figure:
Standard image High-resolution image4.3. High stress and extra feature at 115 cm−1
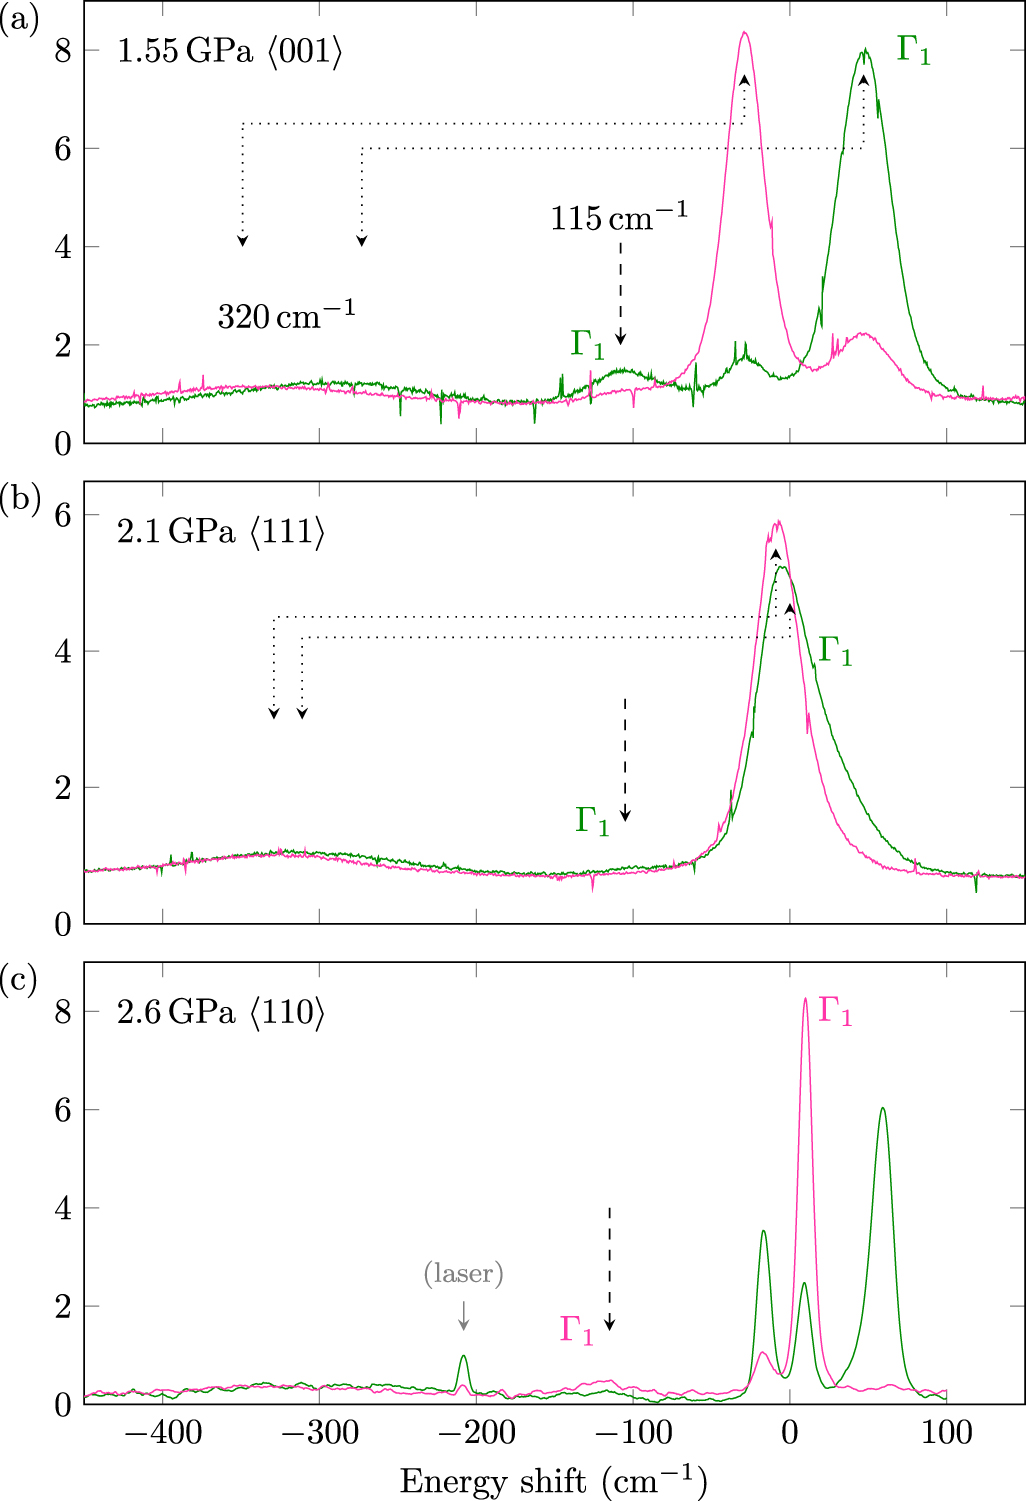
At higher stress (>1 GPa) an extra feature was found to be induced 115 to the low energy side of the ZPL. Its position is indicated in figures 5 and 6 shows spectra exhibiting this peak for , , and stress. The feature appears with varying intensities but increases in strength with stress at the expense of a component of the ZPL with the same polarization. The measurements were made at higher resolution for the case of uniaxial stress, and it is apparent that the extra feature gains at the expense of the line displaced nonlinearly. It also shifts slightly in the reverse direction, as shown in figure 5(c). This is typical for a situation where there are two interacting levels which have the same symmetry. From the analysis of the ZPL it has been established that the line shifting nonlinearly has in symmetry. The extra feature will, therefore, also have in and since it is not split it must have symmetry in .


Figure 6. Uniaxial stress spectra including vibrational features. The upper trace (a) gives the spectra for stress and the central trace (b) for stress. In these cases the sample temperature was 150 K. (c) For stress the sample temperature was 10 K and the higher resolution was obtained by detecting emission from a small volume using masking. In all cases the feature at 115 cm−1 is induced by the stress. It has the same polarization as the component of the ZPL (π in the upper two traces and σ in lowest trace—see table 1). The first vibrational sideband at 320 cm−1 can be seen to have the same polarization as the ZPL indicating the vibration has A1 symmetry.


Download figure:
Standard image High-resolution imageThis symmetry assignment is consistent with its occurrence for other stress directions. For stress the line displaced to higher energy has π polarization and is assigned to a state, and this line mixes with the extra feature (figure 6(a)). Even though the interacting ZPL component is shifting away from the 115 cm−1 feature, the displacement of this ZPL line becomes nonlinear as a result of the interaction, as shown in figure 5(a). Here it might be expected that the 115 cm−1 feature shifts in the reverse direction, but the effect is reduced owing to the proximity of the 320 cm−1 vibrational level. Indeed at the highest stress it is observed that there is a slight shift of the extra feature to shorter wavelength (higher energy) owing to the latter interaction. In the third case of the effects are small but the feature again has the same polarization as that for the component of the split ZPL (figure 6(b)).


Since the 115 cm−1 feature interacts with one component of a line that splits with stress, it must be associated with the electronic state. It occurs on the low energy side of the ZPL in the emission spectrum. Should the be the upper singlet level there will be relaxation to this level 115 cm−1 below the state and at cryogenic temperatures ( K) all the emission would be from this level. This is not the case and it is concluded that the is not the upper singlet level. The alternative is that the is the lower singlet level and the extra level lies 115 cm−1 above it. This confirms our previous report [36] and is consistent with the now generally accepted theoretical model [37, 38].


The occurrence of low-energy vibronic levels in diamond is a fairly common observation and has been observed in previous uniaxial stress studies of diamond [35]. They are associated with a dynamic Jahn–Teller effect associated with an state. Davies [35] has established five other cases of trigonal centres in diamond exhibiting this effect. The first vibrational state associated with a degenerate vibration will involve the electronic and the vibration states, resulting in four vibronic states with symmetries . The vibronic level is displaced up in energy and the down. Quadratic electron-vibration interaction will lift the and degeneracy and result in the low lying state at 115 cm−1 as observed here. A similar situation arises in the case of the ground state of [35]. In this case the level occurs at 110 cm−1 and from the similarity in the situation it can be expected that the strength of the Jahn–Teller interaction is similar: EJT/


This vibronic level has significant implications. It has been used above to establish the order of the singlet levels, resolving long-standing contention about this detail of the NV electronic structure [25, 30–33]. It should also be noted that one consequence of the dynamic Jahn–Teller interaction is a reduction of the effect of perturbations [39]. Thus the experimental measurements of the stress splittings will be slightly smaller than obtained from calculation unless such effects are included.
4.4. Stress parameters
The nonlinear shift of some spectral features with stress is, therefore, due to interaction with vibronic levels. Modelling these interactions is not straightforward as they can involve a distribution of vibrations and the distribution need not be simple. Consequently we have determined the stress parameters using shifts and splitting at levels of stress where the strength of this latter interaction is negligible, essentially using the asymptotic slopes at zero stress. The value of the parameters are given in table 2.
5. Discussion of the molecular model
The electronic model of the centre has its foundations in the defect-molecule approach of Coulson and Kearsley [40] and has been given in detail by many authors [1, 32, 37, 38, 41]. The centre's electronic states are written in terms of symmetry-adapted molecular orbitals. There are four unbound sp3 atomic orbitals adjacent to the vacancy and in symmetry these can be linearly combined to give two degenerate orbitals that transform as the irreducible representation (denoted as -orbitals) and two separate orbitals of A1 symmetry (denoted as -orbitals). These are occupied by six electrons: one from each of the adjacent carbon atoms, two from the nitrogen, and one acquired from the lattice. The lower orbital is always occupied and need not be included in a description of the states. The occupancy of the other four electrons describe the multi-electron states.


The non-relativistic electronic Hamiltonian of the centre may be defined as [37]


where Te is the electronic kinetic energy, VNe is the one-electron Coulomb interaction between the electrons and the lattice nuclei and electrons, Vee is the electron–electron Coulomb repulsion interaction of the electrons, are the collective coordinates of the electrons and are the collective coordinates of the lattice. Both Te and VNe can be written as sums of one-electron operators, whereas Vee can be written as a sum of two-electron operators. The molecular orbitals are defined as solutions of the one-electron terms . The and molecular orbitals have energies that lie within the diamond band gap and are separated by eV (figure 7(a)). The energies of the and molecular orbitals define the energies of the electronic configurations. The four electrons occupying these molecular orbitals lead to three configurations , and 4, which are each separated by h (figure 7(a)). The introduction of the electron–electron Coulomb interaction Vee separates the multi-electron states within a configuration into triplet and singlet levels. The separation can be of the order of eV and, hence, comparable in magnitude to that of the one-electron terms. For example, the lowest energy configuration is split into equally separated states and with separations of eV [37, 38] (figure 7(a)).The electron–electron Coulomb repulsion interaction can also give interaction between configurations and mix the singlet levels of the same orbital symmetry, thereby modifying the simple expressions for and .


Figure 7. Electronic energy level scheme described by the molecular model for three situations. For each situation, the molecular orbital energy levels are depicted on the left, the configuration energy levels in the centre and the multi-electron state energy levels on the right. Effects arising from one-electron Coulomb interaction are coloured red, and effects arising from electron–electron interaction are blue. (a) In the unperturbed case the molecular orbitals and are separated by energy h due to the one-electron Coulomb interaction. The three configurations associated with four electrons occupying these molecular orbitals are therefore also separated by h. The singlet and triplet energy levels within each configuration are separated by the electron–electron Coulomb repulsion interaction. In first order the three levels of the configuration are equally separated by  . (b) Axial strain produces a perturbed trigonal symmetry, which results in changes and to the separations h and . Since trigonal symmetry is maintained, this distortion does not split the E states. (c) Transverse strain lowers the symmetry and gives rise to the splittings , and . Note in this case the only configuration that is split by the one-electron Coulomb interaction is because it has an odd numbers of electrons occupying the molecular orbitals. The electron–electron Coulomb repulsion interaction can split all degenerate levels. The two states and the two states can mix through electron–electron Coulomb repulsion.


Download figure:
Standard image High-resolution imageThe above one- and two-electron Coulomb interactions give the dominant terms in determining the effects of stress, which are observed to be several meV. Other electronic interactions such a spin–orbit and spin–spin are less than meV and their effects are negligible compared to stress. Whilst electron-vibration interaction can be of the order of meV, it can not give stress splitting by itself. Although, as mentioned earlier, it can modify the magnitude of stress splittings in the case of dynamic Jahn–Teller interaction [39]. Hence, the analysis of the stress parameters can be largely restricted to consideration of the Coulomb interactions.
When stress is applied, the lattice coordinates change, which results in a change of the one-electron Coulomb interaction that in turn modifies the molecular orbitals and their energies. Furthermore, the modification of the molecular orbitals occupied by the electrons leads to a change in the electron–electron Coulomb repulsion interaction, which can be represented by the effective operator . Note that can be expanded in symmetry adapted form with terms that are in one to one correlation with those in equation (1). If the symmetry is not changed by the applied stress, will only alter the – energy separation and this is denoted by (figure 7(b)). This will result in a change of the energy separation between configurations but cause no change within each configuration (figure 7(b)). Where the applied stress lowers the symmetry of the centre, will result in a splitting of the molecular orbitals by . The consequence is that the multi-electron states with an odd number of electrons occupying the molecular orbitals will be split by (figure 7(c)). Significantly, no splitting occurs when an even number of electrons occupy the molecular orbitals. For each pair of electrons, one of the electrons is moved up in energy and the other down, such that there is no overall splitting.

![$\delta {{V}_{{\rm Ne}}}[s]$](https://content.cld.iop.org/journals/1367-2630/17/1/013048/revision1/njp507034ieqn316.gif)
![$\delta {{V}_{{\rm ee}}}[s]$](https://content.cld.iop.org/journals/1367-2630/17/1/013048/revision1/njp507034ieqn317.gif)
![$\delta {{V}_{{\rm Ne}}}[s]+\delta {{V}_{{\rm ee}}}[s]$](https://content.cld.iop.org/journals/1367-2630/17/1/013048/revision1/njp507034ieqn318.gif)
![$\delta {{V}_{{\rm Ne}}}[s]$](https://content.cld.iop.org/journals/1367-2630/17/1/013048/revision1/njp507034ieqn319.gif)


![$\delta {{V}_{{\rm Ne}}}[s]$](https://content.cld.iop.org/journals/1367-2630/17/1/013048/revision1/njp507034ieqn323.gif)


It is convenient to first consider the interaction in relation to the singlet transition. The transition is between levels within the same configuration and so the transition energy can not be shifted by . In addition, the state has an even number of electrons occupying the molecular orbitals and so there will be likewise no splitting arising from . Mixing between singlet levels and the singlet levels above the excited state can change this situation for both the shift and splittings. The shift of due to the interaction is second order in the singlet level mixings, and should be proportional to the shift of . This would cause the and parameters to have the same ratio (equal to , where and are the mixing coefficients of the and singlet levels, respectively). Clearly this is in conflict with the observed ratio of 0.33 and ratio of 0.1 (table 2). Hence, the experimental shifts of the singlet transition can not be simply explained by the interaction. The splitting of due to occurs at first order in . Thus, particularly given the previous conclusion, it is unlikely that is predominately responsible for the observation that splitting parameters B and C are of comparable size between and (table 2). The dominant interaction giving rise to the stress shift and splitting of the singlet transition at 1042 nm must result from an alternative interaction. The most obvious candidate, given the magnitude of this interaction, is electron–electron Coulomb repulsion interaction . The first order changes are taken to be and for axial and transverse stress, respectively (figures 7(b) and (c)). Such perturbations can account for the change of the to separation and the splitting of the level.
![$\delta {{V}_{{\rm Ne}}}[s]$](https://content.cld.iop.org/journals/1367-2630/17/1/013048/revision1/njp507034ieqn331.gif)


![$\delta {{V}_{{\rm Ne}}}[s]$](https://content.cld.iop.org/journals/1367-2630/17/1/013048/revision1/njp507034ieqn334.gif)


![$\delta {{V}_{{\rm Ne}}}[s]$](https://content.cld.iop.org/journals/1367-2630/17/1/013048/revision1/njp507034ieqn337.gif)


![$\delta {{V}_{{\rm Ne}}}[s]$](https://content.cld.iop.org/journals/1367-2630/17/1/013048/revision1/njp507034ieqn341.gif)


![$\delta {{V}_{{\rm Ne}}}[s]$](https://content.cld.iop.org/journals/1367-2630/17/1/013048/revision1/njp507034ieqn352.gif)

![$\delta {{V}_{{\rm Ne}}}[s]$](https://content.cld.iop.org/journals/1367-2630/17/1/013048/revision1/njp507034ieqn354.gif)

![$\delta {{V}_{{\rm Ne}}}[s]$](https://content.cld.iop.org/journals/1367-2630/17/1/013048/revision1/njp507034ieqn356.gif)


![$\delta {{V}_{{\rm ee}}}[s]$](https://content.cld.iop.org/journals/1367-2630/17/1/013048/revision1/njp507034ieqn359.gif)


The situation for the triplet transition is very different. The transition is between states of different configuration and the state has an odd number of electrons occupying the molecular orbitals. Consequently, the shifts and splitting of the can arise as a consequence of the changes of the one-electron Coloumb interaction . However, the possibility that there are contributions from cannot immediately be eliminated. To determine how much this latter term contributes, it is worth considering the situation for .


![$\delta {{V}_{{\rm Ne}}}[s]$](https://content.cld.iop.org/journals/1367-2630/17/1/013048/revision1/njp507034ieqn369.gif)
![$\delta {{V}_{{\rm ee}}}[s]$](https://content.cld.iop.org/journals/1367-2630/17/1/013048/revision1/njp507034ieqn370.gif)

The centre has one less electron and its transition is between a ground state and a excited state [42]. This ground state has an odd number of electrons occupying the molecular orbitals and hence can be split as a result of the interaction. It is also the sole state of the configuration and so there can be no contribution from . Therefore, the splitting of the ZPL at 575 nm must arise solely from the interaction. The splitting is that of a single e-electron and is expected to be of similar magnitude (but opposite sign) to that of the single e-hole in the case of . From table 2 it is clear that the B and C parameters have similar magnitude for and , which is consistent with this expectation. This provides strong evidence that the dominant contribution to the splitting of the transition arises from the interaction, and any contribution from is minor.


![$\delta {{V}_{{\rm Ne}}}[s]$](https://content.cld.iop.org/journals/1367-2630/17/1/013048/revision1/njp507034ieqn377.gif)

![$\delta {{V}_{{\rm ee}}}[s]$](https://content.cld.iop.org/journals/1367-2630/17/1/013048/revision1/njp507034ieqn379.gif)

![$\delta {{V}_{{\rm Ne}}}[s]$](https://content.cld.iop.org/journals/1367-2630/17/1/013048/revision1/njp507034ieqn381.gif)


![$\delta {{V}_{{\rm Ne}}}[s]$](https://content.cld.iop.org/journals/1367-2630/17/1/013048/revision1/njp507034ieqn386.gif)
![$\delta {{V}_{{\rm ee}}}[s]$](https://content.cld.iop.org/journals/1367-2630/17/1/013048/revision1/njp507034ieqn387.gif)
The centre is the first colour centre in diamond where the stress parameters are known for two separate transitions, and this provides an ideal situation for testing theoretical calculations. For example it may help determine whether the separate contributions from one-electron Coulomb interaction and electron–electron Coulomb repulsion interaction, as outlined above, can be justified. Having similar information for a transition in the closely related neutral charge state [35] is also valuable. The centre is another nitrogen-related colour centre that has been studied by uniaxial stress [34]. It involves three nitrogen atoms and one carbon adjacent to a vacancy, rather than the three carbon and one nitrogen, and a similar molecular model is adopted for describing its electronic states. Despite the stress parameters being similar to those of in this case the molecular model has not successfully predicted all of the excited states [43]. Having the stress parameters for four related transitions as given in table 2 provides valuable information for ab initio calculations to test our understanding of the electronic model of nitrogen-related colour centres in diamond.


6. Summary and conclusions
The aim of the work was to use uniaxial stress techniques to better understand the singlet levels of the nitrogen-vacancy centre in diamond. The 1042 nm ZPL is understood to be associated with the singlet to singlet transition between levels in the same configuration. The ZPL is spectrally narrow, the sideband is weak, and the symmetry maintaining stress shift parameters and are also relatively small and these are all characteristics of a transition between levels in the same electronic configuration. The singlet–singlet transition is the only transition within the electronic model that satisfies this condition and these aspects all give confidence that the transition is correctly identified. However, the stress splitting parameters are large and comparable with those for the triplet and doublet transitions of and , respectively. These latter transitions involve a change of configuration and an state with an odd number of electrons. Consequently, one-electron Coulomb interaction can account for such effects. The singlet–singlet transition is different since the one-electron Coulomb interaction can not (in first order) split or shift the ZPL, and so it was anticipated the responses would be smaller. The strain parameters for must arise from an alternative interaction and in this work it has been shown that they can be attributed to the two-electron Coulomb repulsion term. It is recognized within the Coulson and Kearsley [40] model that Coulomb repulsion always plays a significant role and in the case of the NV− centre this interaction is of comparable magnitude to the one-electron Coulomb term. It is, therefore, realistic that the one-electron and two-electron Coulomb interactions can result in similar energy changes in response to a distortion of the lattice. The conclusion is that there is overall consistency with the current electronic model of the NV− and it follows that there is an adequate understanding of the singlet states.


The present uniaxial stress studies have also established that there is a dynamic Jahn–Teller effect associated with the level. Combining this observation with previous reports of dynamic Jahn–Teller effect in the excited state, it is clear that electron-vibration interaction is significant within the NV− system. The presence of electron-vibration interaction has been determined from observations within the and degenerate electronic states independently, but the interaction can have more significant consequences between states. In particular, it can play a role in inter-system crossing between and and between and triplet and play a very important role in giving rise to the important spin polarization property of NV.


Acknowledgments
This work was supported by the Australian Research Council (DP 120102232).