


Abstract
Deep brain stimulation (DBS) is a remarkably effective clinical tool, used primarily for movement disorders. DBS relies on precise targeting of specific brain regions to rebalance the oscillatory behaviour of whole-brain neural networks. Traditionally, DBS targeting has been based upon animal models (such as MPTP for Parkinson's disease) but has also been the result of serendipity during human lesional neurosurgery. There are, however, no good animal models of psychiatric disorders such as depression and schizophrenia, and progress in this area has been slow. In this paper, we use advanced tractography combined with whole-brain anatomical parcellation to provide a rational foundation for identifying the connectivity 'fingerprint' of existing, successful DBS targets. This knowledge can then be used pre-surgically and even potentially for the discovery of novel targets. First, using data from our recent case series of cingulate DBS for patients with treatment-resistant chronic pain, we demonstrate how to identify the structural 'fingerprints' of existing successful and unsuccessful DBS targets in terms of their connectivity to other brain regions, as defined by the whole-brain anatomical parcellation. Second, we use a number of different strategies to identify the successful fingerprints of structural connectivity across four patients with successful outcomes compared with two patients with unsuccessful outcomes. This fingerprinting method can potentially be used pre-surgically to account for a patient's individual connectivity and identify the best DBS target. Ultimately, our novel fingerprinting method could be combined with advanced whole-brain computational modelling of the spontaneous dynamics arising from the structural changes in disease, to provide new insights and potentially new targets for hitherto impenetrable neuropsychiatric disorders.

Content from this work may be used under the terms of the Creative Commons Attribution 3.0 licence. Any further distribution of this work must maintain attribution to the author(s) and the title of the work, journal citation and DOI.
Introduction
Deep brain stimulation (DBS) has shown remarkable results in helping to alleviate the symptoms of otherwise treatment-resistant movement disorders such as Parkinson's disease and dystonia [1] with over 100 000 patients having been implanted to date [2]. There is a growing interest in using DBS for other conditions such as neuropsychiatric disorders [3], yet there is a shortage of suitable animal models to test potential targets. Serendipitous discoveries during human lesional neurosurgery have informed some targets such as thalamic regions [4, 5] and periventricular/periaqueductal grey [6] for treatment-resistant chronic pain [7]. However, the recent discovery of a novel DBS target in the anterior cingulate cortex (ACC) for very severe treatment-resistant chronic pain [8] has raised the important question of which region of this heterogeneous brain region is the most effective DBS target for successful outcome.
The underlying mechanisms of DBS are still largely unknown, but it has been shown that the efficacy of DBS is related to at least three factors: (1) the stimulation parameters such as voltage, frequency and amplitude; (2) the physiological properties of the local neural tissue (which may differ by disease state); and (3) the interactions between the electrode and the surrounding neural tissue with whole-brain structural connectivity of the targeted region [9]. The evidence suggests that these biophysical factors combine with the individual structural connectivity of the DBS target to help rebalance widespread dynamic brain networks [1, 10].
The study of structural brain connectivity has given rise to connectomics as the comprehensive map of neural connections in the brain on many spatial scales [11]. In humans, this map uses diffusion weighted/tensor imaging (DWI/DTI) to measure the diffusion of water molecules constrained by the white-matter fibre tracts, typically on the scale of millimetres [12, 13]. The connectivity between brain regions can be reconstructed using methods such as probabilistic tractography utilizing the underlying measures of fractional anisotropy, local level of mean diffusivity, radial diffusivity or axial diffusivity [14, 15].
Recent studies have identified how integrated physiological systems form a network of interactions that affects psychological function. These systems are characterised by specific network structures, suggesting a robust dependency between topology and function on complex networks [16–18].
Connectomics depends on parcellations of the brain into functionally meaningful and distinct regions, which historically have been based on careful studies of the properties of the underlying brain tissue [19]. Parcellations used for human neuroimaging research typically include tens to several hundreds of regions [20]. The optimal parcellation of brain regions is not currently clear but some of the most popular choices include the Hagmann parcellation with 66 cortical regions [21] and the automated anatomical labeling (AAL) parcellation with 116 cortical, subcortical and cerebellar regions [22].
Combining parcellation schemes with probabilistic tractography in humans has made it possible to e.g. subdivide the human thalamus into significant clusters of connectivity [23], which corresponded with existing maps of established patterns of connectivity [24]. The idea of measuring the inter-regional structural connectivity where each functional region has a distinct 'fingerprint' was demonstrated in a structural connectivity database in primates [25]. Klein and colleagues have provided an excellent overview of existing studies using tractography for fingerprinting structural connectivity [26] with further progress being made, such as recent inter-species comparisons of functional connectivity in humans and macaques [27].
The structural connectivity between regions in a given parcellation scheme can then be further elucidated using graph theoretical tools to demonstrate global measures such as small-worldness [28], and local measures such as modules defined as locally connected clusters [29] and hubs which are central brain regions with high measures of degree and centrality [30].
These advances can potentially help in identifying the necessary and sufficient structural connectivity of DBS targets using neuroimaging in existing patient groups, and subsequently as a pre-surgical tool and a rational method for discovering new DBS targets.
In this paper we use advanced probabilistic tractography combined with a whole-brain anatomical parcellation to provide an innovative foundation for identifying the structural connectivity fingerprint of existing, successful DBS targets. First, using data from our recent case-series of cingulate DBS for patients with treatment-resistant chronic pain, we demonstrate how to identify the structural 'fingerprints' of existing successful and unsuccessful DBS targets in terms of their connectivity to other brain regions, as defined by the anatomical parcellation. Second, conservative pattern recognition methods are used to fingerprint the structural connectivity across patient groups with successful and unsuccessful outcomes. Potentially this fingerprint could be used pre-surgically to account for a patient's individual connectivity and identify the best DBS target. This method may also be employed to search the whole brain to help identify novel DBS targets for treatment-resistant disorders. Furthermore, our novel fingerprinting method could be combined with advanced whole-brain computational modelling of the spontaneous dynamics [31] arising from the structural changes in disease to provide new insights and potentially even new targets for hitherto impenetrable psychiatric disorders.
Methods
Figure 1 summarises the methods described in the following. Briefly, we analysed the electrode positions in DBS implanted patients with chronic pain at the individual level, calculated the transformation to MNI space and estimated the current spread to generate likely left and right anatomical regions of stimulation. These seed masks were then used together with each individual's DTI to estimate the structural fingerprints of each electrode. We then used a conservative strategy to estimate the necessary underlying connectivity for patients with successful (SO) and unsuccessful (UO) outcomes.

Figure 1. Novel method for fingerprinting structural connectivity of DBS electrodes. (A) Electrode localisation. (B) Creation of a binary mask of the effective electric field distribution around the DBS electrode. (C) Registration of a brain parcellation template (AAL) to each patient native space, and further probabilistic tractography between the left and right DBS electrode and these brain regions. A fingerprint of the resulting normalised structural connectivity strength for the left (blue) and right (right) DBS electrodes was represented in different ways, such as radar-plots (top), logarithmic scale normal plots (middle) and 3D glass brain reconstructions (bottom).
Download figure:
Standard image High-resolution imagePatients
We analysed data from six patients with neuropathic chronic pain refractory to medication, presented for DBS to Oxford Functional Neurosurgery. This sample includes successful (n = 4) and unsuccessful cases of DBS (n = 2), based on long-term clinical postoperative assessments. Further demographic and clinical details about these patients can be found in table 1.
Table 1. Demographics and clinical characteristics of patients. For each patient, information about the clinical success rating, sex and age, as well as different clinical details such as the pre-operational visual analogue scale (VAS), date of surgery and origin and location of the pain are listed.
| Pain | ||||||
|---|---|---|---|---|---|---|
| Patient | Sex | Age at surgery | Outcome Status | Origin | Location | Date of surgery |
| SO1 | Male | 49 | Successful | FBSSa | Right hemibody | 12 June |
| SO2 | Male | 51 | Successful | FBSSa | Right leg | 10 October |
| SO3 | Female | 46 | Successful | FBSSa | Whole Spine | 12 March |
| SO4 | Male | 46 | Successful | BPIb | Right arm | 12 November |
| UO1 | Male | 52 | Unsuccessful | Unknown | Chest | 11 November |
| UO2 | Female | 58 | Unsuccessful | Head injury | Right hemibody | 12 May |
This study was approved by the National Research Ethics Service committee South Central—Berkshire in Bristol—and informed consent was obtained from all patients.
Table 2. Global graph theoretical measures on the structural connectivity network stimulated by the DBS. For each DBS electrode, group average values of the degree (number of connections), strength (number of fibres) and rate of fibres per connection were calculated, together with the corresponding standard deviations. Similarly, this procedure was repeated for the global brain stimulation network produced by combining the left and right DBS electrode networks. Group comparisons of these measures were calculated using a permutation-based paired t-tests.
| Successful outcomes | Unsuccessful outcomes | Permutation-based t-test | Group difference (%) | ||||||||||
|---|---|---|---|---|---|---|---|---|---|---|---|---|---|
| Network measures | La | Rb | LRc | La | Rb | LRc | La | Rb | LRc | La | Rb | LRc | |
| Degree | Mean | 58.50 | 55.25 | 71.25 | 74.50 | 77.00 | 86.00 | 0.21 | 0.04 | 0.18 | 12.03 | 16.45 | 9.38 |
| Std | 26.13 | 10.63 | 21.33 | 4.95 | 7.07 | 4.24 | — | — | — | — | — | — | |
| Strength | Mean | 341.12 | 327.49 | 668.61 | 412.00 | 385.79 | 797.79 | 0.16 | 0.27 | 0.16 | 9.41 | 8.17 | 8.81 |
| Std | 86.85 | 88.97 | 146.82 | 6.05 | 40.95 | 34.90 | — | — | — | — | — | — | |
| Fibres/connection | Mean | 6.83 | 6.05 | 10.00 | 5.54 | 5.01 | 9.28 | 0.46 | 0.83 | 0.61 | 10.42 | 9.42 | 3.77 |
| Std | 3.65 | 1.63 | 3.28 | 0.29 | 0.07 | 0.05 | — | — | — | — | — | — | |
aLeft DBS electrode. bRight DBS electrode. cLeft and right DBS electrodes combined, representing the whole stimulation network produced.
Surgical procedure
Quadripolar electrodes Medtronic model 3389 (Medtronic, Minneapolis, USA) for DBS were implanted in the ACC bilaterally. Before surgery, anatomical high-resolution T1 and T2 MRI scans with 1 × 1 × 1 mm voxel size were acquired to plan the electrode implant protocol. The Cosman–Roberts–Wells stereotactic frame was applied to the patient's skull under local anaesthetic. For a detailed description of the surgical procedure, see Kringelbach and colleagues [32]. A 5 V bipolar stimulation between the first (C0) and last (C3) contacts, with a frequency of 130 Hz and a pulse duration of 450 μs was applied to all the patients.
Image acquisition
All DTI data for the patients were acquired on a Philips Achieva 1.5 Tesla Magnet in Oxford. DWI was performed using a single-shot echo planar sequence with coverage of the whole brain. The scanning parameters were echo time of 65 ms, repetition time of 9390 ms, 176 × 176 reconstructed matrix, reconstructed voxel size of 1.8 × 1.8 × 2 mm. Furthermore, DTI data were acquired with 33 optimal nonlinear diffusion gradient directions (b = 1200 s mm−2) and one non-diffusion weighted volume (b = 0). Pre- and postoperative stereotactic CT scans were also acquired.
DBS electrode localisation and co-registration to DTI space
For each patient, a postoperative CT scan was used to confirm the DBS electrode contact positions. An individual single-voxel binary mask for each electrode contact was then created.
In order to achieve a good transformation of these masks (CT space) to DTI space, we used the MRI T1 scan as an intermediate reference image, taking advantage of its good spatial resolution to improve the accuracy of our linear registration processes. Both the CT and DTI (b0 volume) were co-registered to the T1 space using a 3D rigid-body transformation (6 DOF) and a nearest-neighbour interpolation method. The transformation matrix resultant from the DTI to T1 space linear co-registration was inverted and applied to the electrode masks (T1 space), using a trilinear interpolation method. For each electrode transformation, we identified and created a binary mask of the voxel with the highest intensity. This new mask represents the voxel with highest probability of containing the single-voxel electrode contact transformation from the CT to the DTI space.
This set of operations, which included the creation, linear co-registration and transform application, were performed using the FLIRT and ApplyXFM tools from FMRIB Software Library (FSL) where FMRIB stands for Functional Magnetic Resonance Imaging of the Brain (www.fmrib.ox.ac.uk/fsl/, Oxford) [33].
Simulation of the electric field distribution
A simple empirical model for volume of activated tissue (VAT) estimation, developed for conditions of monopolar stimulation and validated for clinical cases of movement disorders was used in this study [34].
where is the tissue impedance, the applied voltage and , and the second-order polynomial coefficients of the simplest model with close-to-best accuracy (model 10), resultant from a multivariate 2D fit, with values of −1.0473, 0.0473 and −1.0473 respectively.


This simplified 2D model can be adopted as a fast approach for estimating the VAT radius for any given voltage between 1–10 V and impedance 500–2000 Ω [34].
The stimulation effects using contacts C0 (−) and C3 (+) as active are believed to affect the neural tissue surrounding C1 and C2 due to the nature of the electric field distribution in the bipolar stimulation between non-adjacent contacts (±). In this case, the resulting spatial effects of the stimulation will be lower in the radial direction and higher in the z-axis [35]. There is currently no optimal solution for modelling the electric field distribution of bipolar stimulation around and between non-adjacent active contacts, which can realistically capture the neural activation in the complex brain tissue environment. Due to the limitations of the model used for estimating the VAT (developed for monopolar stimulation assuming a perfectly isotropic electromagnetic field distribution around the contact), the spatial resolution of DTI images and the lack of in vivo measurements of tissue impedance, we decided to adopt a simplified solution of the electrode configuration and stimulation settings. Therefore, our final strategy was to simulate the application of 3 V to all the four electrode contacts previously registered to DTI space, using a value of tissue impedance of 1003 Ω [34].
For each patient, The VAT around each electrode contact of the same DBS lead was simulated and later merged, creating a single continuous VAT around the four contacts of each DBS lead. The effect of the two stimulation parameters on the final simulated VAT around each DBS lead was also studied.
Fingerprint of individual brain structural connectivity
The construction of fingerprints of individual brain structural connectivity consisted of a two-step process. First, the nodes of the network were defined using brain parcellation techniques. Secondly, the connections between the DBS electrode to the nodes in the parcellation were estimated using probabilistic tractography. In the following we outline the details involved in each step.
Brain parcellation
The parcellation of the entire brain in native DTI space into 116 cortical, subcortical and cerebellar regions (table S1) was accomplished using the AAL template, where each region represents a node of the brain network [22].
We used the Flirt tool (FMRIB, Oxford) [33] to linearly co-register the standard ICBM152 in MNI space [36] into the T1-weighted structural image, by using an affine registration (12 DOF) and a nearest-neighbour interpolation. The resulting transformation matrix was subsequently concatenated with the previously created T1 to DTI native space transformation matrix, allowing a direct co-registration of the AAL template in MNI space to the diffusion MRI native space. This last transformation was accomplished using a nearest-neighbour interpolation method to ensure that discrete labelling values were preserved.
Fingerprint of electrode brain connectivity
We used the FDT toolbox in FSL (version 5.0, www.fmrib.ox.ac.uk/fsl/, FMRIB, Oxford) to carry out the multiple processing stages of the diffusion MRI data. The initial pre-processing involved a correction of head motion and eddy current gradient induced image distortion. We further modelled for crossing fibres within each voxel of the brain using a Markov Chain Monte Carlo sampling algorithm to build up distributions on diffusion parameters and estimate the local probability distribution of fibre direction at each voxel of the brain [37]. For this step, we used an automatic estimation of two fibre directions within each voxel, which can significantly improve the tracking sensitivity of non-dominant fibre populations in the human brain [38].
We estimated the connectivity probability by applying probabilistic tractography at the voxel level using a sampling of 5000 streamline fibres per voxel. Brain boundaries were defined based on a binary brain for the whole native brain (skull extracted). The connectivity from a seed voxel i to another voxel j was defined by the proportion of fibres passing through voxel i that reach voxel j [38]. This was then extended from the voxel level to the region level, i.e. in a brain region consisting of n voxels, 5000*n fibres were sampled. The connectivity probability Pij from region i to region j is calculated as the number of sampled fibres in region i that connect the two regions divided by 5000*n, where n is the number of voxels in region i.
For each DBS electrode, the connectivity probability to each of the 116 AAL regions was calculated. We implemented the calculation of regional connectivity probability using in-house Perl scripts. Regional connectivity was normalised using the regions' volume expressed in number of voxels. For each patient, a 2 × 116 weighted matrix was constructed, representing the structural connectivity networks of stimulation across the brain for the left and right DBS electrode as individual seed regions. This method allows for analysis of the impact of stimulation of each individual DBS electrode, as well as the effect of combined bilateral stimulation over the whole brain network.
Statistical analysis and pattern recognition
Having constructed a probabilistic network of structural connectivity stimulation for each patient, we focused on decomposing the data into different network properties, by applying simple but potentially powerful statistical measures. For every patient, we started by analysing the pattern of stimulation for each probe separately. A logarithmic version of this connectivity strength profile was produced to reduce the wide range of values to a give a better visual indication of the nodes being stimulated rather than emphasising the connectivity strength. At this stage, we aimed to identify potential intra- and inter-group lateral network differences.
We then focused on the global effect of bilateral stimulation over the whole brain network, by concatenating the data of both DBS electrodes. We carried out three separate analyses:
Global network properties
We calculated the global graph theoretical measures (number of fibres, strength and number of fibres per connection) [39], as well as simple statistical measures (mean, standard deviation and median). This allowed us to quantify and decode the properties that characterise the structural connectivity fingerprint of each outcome type group.
Group-exclusive target areas
In addition, a conservative approach was also used to extract group intrinsic nodal properties by identifying the nodes that survived a threshold of 5% of the maximum connectivity strength of the network in the participant, and were found common to all patients within the same group.
Connectivity strength comparing groups
Supplementary permutation-based paired t-tests identified which network nodes showed significant group differences in terms of connectivity strength. Under the null hypothesis there should be no differences in the average connectivity strength between the two groups, while permutation based paired t-tests were produced for every pairwise comparison to correct for multiple comparisons, using a statistical criterion for between-group differences set at p < 0.05.
Results
Using an automatized neuroimage processing pipeline, we extracted the fingerprints as the structural connectivity between the DBS electrodes in six patients with DBS in the ACC for treatment-resistant chronic pain. Figure 2 shows multiple ways of visualising this fingerprint from left and right hemisphere to the 116 AAL regions as a radar-plot and as 2D area-plots (normal and logarithmic) as well 3D visualisations. Figure 3 shows the full fingerprints of the four successful (SO1–SO4) and the two unsuccessful (UO1–UO2) outcomes.
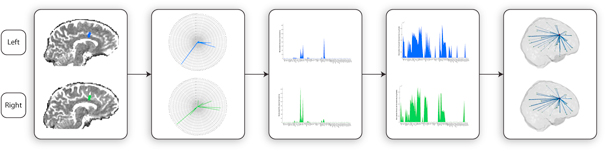
Figure 2. Example of the fingerprint of structural connectivity from left and right electrode in a patient (SO1). Different representations of the produced stimulation networks, in radar, normal logarithmic scale and 3D reconstructed glass brain (lateral view represented), respectively, were produced for each patient.
Download figure:
Standard image High-resolution image
Figure 3. Fingerprints of six patients with successful (SO1–SO4) and unsuccessful (UO1–UO2) outcomes. For each patient, a normal (top) and a logarithmic scale (bottom) graph of the structural connectivity for the left and right DBS electrodes were constructed. A 3D glass brain reconstruction of the resulting brain stimulation networks was also produced (lateral and dorsal view represented). The red sphere represents the centre of gravity of the simulated VAT. The thickness of each blue edge indicates the strength of connection (in logarithmic scale) between the source of stimulation and different anatomical targets (AAL regions), each represented by a green sphere, positioned according to their centroid stereotaxic coordinates.
Download figure:
Standard image High-resolution imageSpecifically, the results from graph analysis (table 2) demonstrated that there are clear group differences in the structural networks excited by the combined stimulation of the left and right DBS electrodes. For the patient group with successful outcomes, network patterns suggest a small dominance on the connectivity of the left side with higher number of connections in the left hemisphere (58.5 ± 26.1; mean ± s.d.) compared to the right hemisphere (55.3 ± 10.6), revealing an increased total number of fibres being stimulated (L: 341.1 ± 86.85; R: 327.49 ± 89) and a trend of having significantly different fingerprint of anatomical targeting between groups of patients with successful and unsuccessful outcomes (p = 0.21). Additionally, there is a significant group difference in the number of connection on the right hemisphere (p = 0.04).
A lateralisation effect is also found for the group of patients with unsuccessful outcomes but the tendency is inversed with fewer connections to the left hemisphere (74.5 ± 4.95) compared to the right hemisphere (77 ± 7.1). The opposite pattern is found for the strength of the connections from the left electrode which is increased compared to that of the right electrode (L: 412 ± 6.05; R: 385.8 ± 40.95), suggestive of an imbalance between the number and strength of the connections on this network, i.e. less connections are being established with increased strength to the nodes.
The resulting stimulation networks for the combined left and right electrodes (LR) suggest that there is a larger number of connections being established between the DBS electrodes and the anatomical regions with increased overall strength for the UO group (degree: 86 ± 4.2; strength: 797.8 ± 34.9) in comparison with the SO group (degree: 71.3 ± 21.3; strength: 668.6 ± 146.82).
There are no significant hemispheric differences (p = 0.61) between the number of fibres per connection in the global networks (LR) between the two groups (SO: 10 ± 3.28; UO: 9.28 ± 0.1). This is likely due to the opposite hemispheric patterns of connectivity between groups of successful and unsuccessful outcomes.
The global structural connectivity fingerprint of each group was obtained by combining the data from the left and right DBS electrodes (figures 3 and 4). The normalised connectivity patterns for the two groups show not only that different areas are being stimulated, but also that the distribution of the strength along the stimulation targets is changed between groups. This can be seen by visually inspecting the mean and median group plots, where the connectivity to regions in the anterior and posterior cingulate cortices, middle frontal gyrus and thalamus is increased in the group of patients with unsuccessful outcome, contrasting with the decrease in connectivity to regions in the caudate and supplementary motor, when compared with the successful outcomes.

Figure 4. Fingerprints of the normalised structural connectivity for patient groups with successful and unsuccessful clinical outcome. (A) Contour-plots illustrating the strength and uniformity of the structural connectivity patterns across patients with SO (I, III) and UO (II, IV) in normal (I, II) and logarithmic (III, IV) scales. (B) Group statistics, including mean with standard error limits (I, II) and median (III, IV) graphs of patients with SO (I, III) and UO (II, IV), showing the average/median group patterns of anatomical targeting and the normalised intensity of these connections.
Download figure:
Standard image High-resolution imageA conservative analysis was undertaken to discover similarities and differences in the anatomical target patterns across all patients in each group. This revealed that the left and right DBS electrodes in both groups have the two common regions of left and right anterior and middle cingulate cortices (AAL 31–34). Exclusive regions of the left and right middle superior frontal gyrus and posterior cingulate cortex (AAL regions 23, 24, 35 and 36) were found in the group of patients with unsuccessful outcome, while one region of the left supplementary motor cortex (AAL region 19) in the patient group with successful outcomes, as shown in figure 5 and table 3. This suggests that a successful stimulation fingerprint for chronic treatment-resistant pain will have to reach supplementary motor areas, while avoiding middle superior frontal and posterior cingulate regions.

Figure 5. Conservative method for estimating group differences in terms of common areas that to all subjects of the same group. A 3D glass brain reconstruction was produced to show these group-specific anatomical targeting pattern, shown from the frontal (A), lateral (B) and dorsal (C) views. AAL regions in green indicate areas that are found common to all patients with successful clinical outcome, but not to patients with unsuccessful outcomes, where orange areas have the opposite pattern.
Download figure:
Standard image High-resolution imageTable 3. Brain areas found to be common and exclusive to all subjects of the same group for the two groups under analysis, after a 5% threshold was applied to the normalised fingerprints.
| node | AAL region | Group |
|---|---|---|
| 19 | Left supplementary motor area | SO |
| 23 | Left superior frontal gyrus, medial | UO |
| 24 | Right superior frontal gyrus, medial | UO |
| 35 | Left posterior cingulate | UO |
| 36 | Left posterior cingulate | UO |
We also undertook a less conservative analysis using permutation-based paired t-tests to correct for multiple comparisons and calculate significant local differences in region connectivity strength between successful and unsuccessful patients (see methods). Using this less conservative, and potentially more sensitive, measure, we found 11 significant local differences in connectivity strengths between the DBS electrodes and brain regions between the SO and UO groups (p < 0.05, see figure 6 and table 4). Ten regions of the hippocampus, vermis, orbitofrontal, frontal, cingulate and occipital cortices, had significantly stronger connectivity strength in the UO group compared to the SO group, while only one region of the supramarginal gyrus had significantly stronger connectivity strength in the SO group.

Figure 6. Analysis using permutation-based paired t-tests to identify regions with significantly different connectivity strength between groups of patients with successful and unsuccessful outcomes. A 3D glass brain reconstruction was produced, showing the network pattern between the reconstructed DBS electrodes (with simulated VAT) and the 11 significantly different AAL regions (green—larger in SO) between the UO and SO groups. The regions where significant connectivity differences are larger in the SO group are colour-coded in green, while larger in UO group are colour-coded in orange. Bar-plots for four of those significant group differences in structural connectivity are represented at the top of the image.
Download figure:
Standard image High-resolution image
Table 4. Significant structural connectivity group differences between patients with SO and UO (p < 0.05) using a permutation-based paired t-test. The absolute value of the structural connectivity difference, and the resulting p-value of the group comparison for every AAL region showing significant group difference are listed in the table.
| node | AAL region | SCUO–SCSO | p-value |
|---|---|---|---|
| 6 | Right superior orbitofrontal | −0.205 | 0.034 |
| 7 | Left mid frontal gyrus | −0.024 | 0.035 |
| 10 | Right mid orbitofrontal | −0.006 | 0.033 |
| 31 | Left anterior cingulate | −91.500 | 0.032 |
| 38 | Right hippocampus | −0.015 | 0.035 |
| 50 | Right superior occipital | −0.006 | 0.033 |
| 52 | Right mid occipital | −0.002 | 0.032 |
| 63 | Left supramarginal gyrus | 3.75E-04 | 0.002 |
| 109 | Vermis I, II | −0.204 | 0.033 |
| 115 | Vermis IX | −0.005 | 0.033 |
| 116 | Vermis X | −0.031 | 0.033 |
Discussion
We have presented a new automatized method for 'fingerprinting' the structural connectivity from a DBS electrode to a whole-brain parcellation. This method can identify the necessary and sufficient structural connectivity patterns responsible for successful outcomes in existing DBS patient groups. Once these fingerprints are established they can be used as part of pre-surgical planning and as a rational way to discover new DBS targets in various disorders including neuropsychiatric disorders.
We demonstrated the potential and usefulness of this method in patients with DBS in the cingulate cortex for severe treatment-resistant chronic pain. While this new DBS target has shown significant success in alleviating the emotional suffering in treatment-resistant chronic pain [8, 40], we still lack a principled way for accurate DBS electrode placement. In order to evaluate the underlying features of a successful DBS implant, we extracted the fingerprints of structural connectivity in a group of four chronic pain DBS patients with successful outcomes as well as in a group of two patients with unsuccessful outcomes.
Many different potential pattern recognition algorithms, such as principle component analysis and machine learning, can be used to detect the necessary and sufficient properties of successful DBS targets, all of which are obviously determined and constrained by the quality of the underlying data. Furthermore, for each patient, additional brain global and local graph theoretical measures can be combined with more detailed clinical information to produce a better characterisation of the successful connectivity stimulation patterns. Given the small sample size of the two patient groups, we opted here for two simple methods to identify common and different fingerprint patterns between groups. The most conservative method assumed that significant connectivity to a given region had to be present in all patients within and between groups.
This conservative method of pattern recognition found that successful fingerprints for treating treatment-resistant chronic pain should have connectivity to supplementary motor regions, while avoiding middle superior frontal and posterior cingulate regions.
The results of using a less conservative analysis using permutation-based paired t-tests to identify local differences between the two groups found 11 significant group differences in connectivity strength between the DBS electrode and brain regions. The successful outcomes were associated with a significant decrease in connectivity to ten regions of the hippocampus, vermis, orbitofrontal, frontal, cingulate and occipital cortices, and significant stronger connections to one region of the supramarginal gyrus, when compared with unsuccessful outcomes.
These preliminary results are suggestive of different lateralisation effects on the stimulation networks in successful and unsuccessful patients, which will require further validation in future studies. It should be noted that the statistical significance of this lateralisation effect is strongly dependent on the sample size, and that this asymmetry could also be associated with consistent differences in the electrode targeting, as well as to group variations in the intrinsic structural network properties.
These findings will need to be replicated in a much larger sample of patients but offer potential insights that can be used for future pre-surgical planning. It might also be instructive to use our novel DBS fingerprinting method with a more fine-grained parcellation of the cingulate cortex, such as the recent parcellation by Beckmann and colleagues [41], which may help further inform future DBS targeting. These findings should be seen in the context of previous research which has used tractography to define likely cingulate regions stimulated by subgenual cingulate DBS for treatment-resistant depression [42]. The authors found that treatment efficacy appears to be mediated via effects on a distributed network of frontal, limbic, and visceromotor brain regions. However, this result is tempered by the recent disappointing long-term clinical outcomes of subgenual cingulate DBS for treatment-resistant depression [43].
Fingerprinting of structural brain connectivity is beginning to gain popularity as a tool for understanding brain function [26] and has recently been extended to encompass functional brain connectivity [44]. This allows for a better understanding of the temporal interactions between brain regions and specifically that frequency-specific neuronal correlations in large-scale brain networks may be fingerprints of the fundamental computations underlying information processing. More generally, however, such correlations will need to be supported by computational models in order to understand the underlying mechanistic principles of integration and segregation of information in the human brain [31, 45].
Ultimately, the novel fingerprinting method presented here has helped shed new light on the necessary and sufficient fingerprints of structural connectivity underlying successful outcome of DBS implantation. As such this has the potential to aid pre-surgical planning of DBS. In addition, the method also opens up for the discovery of new potential targets with similar structural connectivity fingerprints. Further potential developments include combining this structural method with advanced whole-brain computational modelling of the spontaneous dynamics arising from the structural changes in disease [46] which can help provide new insights into the mechanisms of DBS—and may potentially even help discover new targets for neuropsychiatric disorders.
Acknowledgments
We thank Ms Eloise Stark for her valuable comments. MLK was supported by the ERC Consolidator Grant: CAREGIVING (n. 615539) and the TrygFonden Charitable Foundation. GD was supported by the ERC Advanced Grant: DYSTRUCTURE (n. 295129), by the Spanish Research Project SAF2010-16085 and the FP7-ICT BrainScales.