


Abstract
We demonstrate the ability to excite atoms at well-defined, programmable locations in a magneto-optical trap, either to the continuum (ionization), or to a Rydberg state. To this end, excitation laser light is shaped into arbitrary intensity patterns with a spatial light modulator. These optical patterns are sensitive to aberrations of the phase of the light field, occurring while traversing the optical beamline. These aberrations are characterized and corrected without observing the actual light field in the vacuum chamber.
Export citation and abstract BibTeX RIS

Content from this work may be used under the terms of the Creative Commons Attribution 3.0 licence. Any further distribution of this work must maintain attribution to the author(s) and the title of the work, journal citation and DOI.
1. Introduction
Ultracold atomic gases provide a versatile platform for creating and studying well-controlled quantum many-body systems [1]. In particular, highly excited Rydberg atoms offer extremely strong and tunable van der Waals interactions, providing acces to a regime dominated by the interaction energy. The system dynamics is then reduced to that of the internal state of the atoms, while their motion can be neglected. In this so-called frozen gas limit, Rydberg atoms can for instance be employed in quantum information processing [2–5] and interfacing matter with quantum light [6–9]. Another interesting research direction envisions Rydberg atoms as quantum simulators for interacting spin systems [10–14] and for studying resonant (exitonic) energy transfer [15–18].
In each of the aforementioned applications a precise control over the locations of the excitations would be greatly beneficial, or even a necessity. This control is typically envisioned by restricting the positions of the ground state atoms, e.g., by confining them to an optical lattice and thus enforcing regularly spaced geometries for the excitations to localize on. In contrast, we consider adding structure to the excitation laser light instead. Assuming a dense enough underlying atomic density in the frozen gas limit, the possible positions of the Rydberg excitations are then determined solely by the presence of excitation light. In principle, arbitrary geometries can be constructed this way, such as lattice structures exceeding the capabilities and flexibilities of optical lattices.
There exist several methods of generating arbitrary light fields in cold atom experiments, e.g., time-averaged potentials [19, 20], intensity masking [21, 22], or diffractive optical elements [23–27]. Here, we employ an active optical element in the form of a spatial light modulator (SLM), which is a commercially available device able to imprint a spatially varying phase onto a laser light field. This way, it is possible to electronically control the intensity of the light field in the focal plane of a lens, as illustrated in figure 1. One great advantage of SLMs is that the intensity patterns are programmatically reconfigurable, without requiring physical alterations to the optical beamline. SLMs have already been succesful, for instance, in creating arrays of dipole traps [28–30], arbitrarily shaped dipole traps [31–33], atom guiding [34–36], and shaping ultracold electron bunches [37].

Figure 1. Experimental setup, consisting of a red 780 nm and blue 480 nm laser effecting a two-photon transition of atoms in a magneto-optical trap (MOT) to either the continuum (ionization) or to a Rydberg level. The SLM imprints a phase onto the 780 nm laser, shaping the intensity into the desired pattern, in this case an array of diffraction limited spots. Rydberg atoms and ions created at the targeted locations can be accelerated onto a detector which can spatially resolve single ions.
Download figure:
Standard image High-resolution imageShaping the intensity of the light field through phase modulation requires a high degree of control over the phase of the light field. First, the phase pattern to be imprinted by the SLM needs to be carefully engineered, a task typically performed numerically [32, 38–41]. Second, the quality of the optical light field may be compromised by aberrations introduced by the myriad of components in a typical beamline. This requires a precise characterization of any phase aberrations experienced by the light field, and subsequent countermeasures need to be taken. We demonstrate the ability to control the phase of the laser excitation light to sufficiently high degree, and excite atoms at well-defined, programmable locations in a ultracold atomic cloud, either to the continuum (ionization), or to a Rydberg state.
2. Methods
2.1. Experimental
Figure 1 shows the essential part of the experimental setup. A magneto-optical trap (MOT), containing a cloud of ultracold  atoms at densities of
  and temperatures of
  , is illuminated by two laser beams. A red, 780 nm laser, excites the atoms to an intermediate 5P3/2 state. A blue, 480 nm laser then ionizes the atoms, or excites them to the Rydberg state. A HoloEye Pluto SLM modulates the phase of the 780 nm excitation laser, shaping the intensity pattern in the focal plane of a lens with a focal length
  . The blue laser providing the final excitation step is shaped into a thin sheet of light, with a waist diameter of
  in the z-direction, and propagating along the focal plane of the 780 nm laser. The two lasers thus form a two-dimensional (2D) excitation volume in the xy-plane of the MOT where Rydberg atoms or ions can be created.
An accelerator extracts the ions and images them onto a detector. In the case of Rydberg atoms the acceleration fields will strip the Rydberg atoms of their valence electron, and the imaging procedure is the same as for ions. Chromatic and spherical abberations of the accelerator are sufficiently small that, during the time of flight, the ion pattern does not deform, apart from a global magnification of a factor 46 [42]. The detector, consisting of a double micro-channel plate and phosphor screen, is able to spatially resolve single ions and thus provides a direct measurement of the ion or Rydberg distribution as it was in the MOT, projected onto a plane.
2.2. Phase modulation
We continue with discussing the phase modulation of the red excitation laser. At the start of the beamline the laser forms a wide beam, to be considered as a plane wave with amplitude U0. The SLM imprints not only a phase φ onto the light field, it additionally acts as an aperture with a pupil function P. This function is valued 1 inside the active area, and 0 outside, truncating the beam to a rectangle with the dimensions  of the SLM. In scalar diffraction theory and under the Fresnel approximation [43], the amplitude of the light field Uf in the focal plane follows from a Fourier transform of the light field immediately behind the SLM

where x', y' are coordinates in the focal plane, and $](https://content.cld.iop.org/journals/1367-2630/17/2/023045/revision1/njp508627ieqn7.gif) denotes a 2D Fourier transform of the function in square brackets, evaluated at spatial frequencies
denotes a 2D Fourier transform of the function in square brackets, evaluated at spatial frequencies  .
.
The degree of freedom provided by φ can thus be used to modulate the intensity in the focal plane.
In particular, we focus on creating arrays of diffraction limited spots. It is instructive to first consider the trivial case of a single spot, by choosing  . Writing
  , and
, and  , we recover the well known Airy spot:

where  . The size of the central spot
  between the first minima follows from the diffraction limit

which determines the size of the smallest possible spot we can make in our setup.
In order to compute phases φ for complicated intensity patterns such as spot arrays, we employ an iterative Fourier transform algorithm [38, 39, 41], as depicted schematically in figure 2(a). Starting from an initial guess for the phase, the algorithm consists of a series of virtual propagations of the light field back and forth between the SLM and focal planes. In each plane, constraints to the amplitude of the light field are applied, i.e., we demand that the amplitude is of a specific form, while leaving the phase free. In the SLM plane, the amplitude is constrained to that of the input field, U0. In the focal plane, the constraint is formed by the target amplitude, denoted by UT. These steps can be viewed as a series of projections between two subsets of  , where in each subset one of the two constraints is satisfied [44, 45]. The algorithm converges to a phase φ which minimizes the distance between both sets, i.e., satisfying both constraints as well as possible.
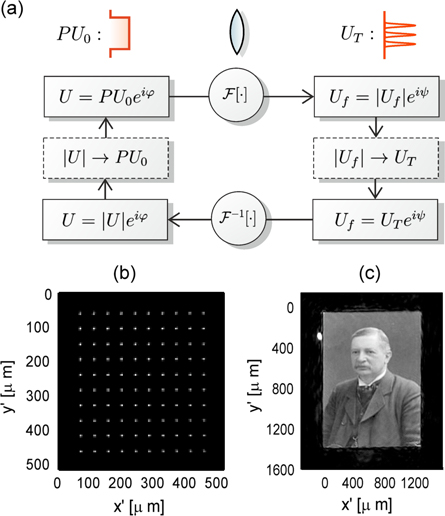
Figure 2. (a) Iterative Fourier transform algorithm (IFTA) used for calculating the SLM phase patterns, consisting of a series of virtual propagations (circles) between the SLM plane and the focal plane, while applying constraints (dashed boxes). The constraints consist of a replacement of the amplitude, while leaving the phase  of the light field unaltered. (b) Camera image of the 780 nm laser beam, shaped into an array of diffraction limited spots with the IFTA algorithm. (c) Portrait of Johannes Rydberg6, made out of 780 nm laser light, with an advanced version of the IFTA algorithm that also applies constraints to the phase of the light field.
Download figure:
Standard image High-resolution imageIn practice, we are only interested in the amplitude of the light field in a small window W in the focal plane, with associated pupil function PW. Restricting the constraint to the window, i.e. setting  in figure 2(a), provides the algorithm with a greater degree of freedom for the phase pattern, resulting in better convergence and better quality of the final solution [46]. Figure 2(b) shows a direct camera image of the laser light, which is shaped into an array of diffraction limited spots using the methodology described above. Figure 2(c) shows a direct camera image of a complicated intensity pattern, demonstrating the enormous degree of control over the light field that can be effected by the SLM. The computation of the corresponding phase pattern is described elsewhere [41, 47].
2.3. Aberration correction
Shaping the laser intensity by phase modulation is sensitive to aberrations of the phase of the light field, which are inevitably introduced by imperfections in the various optical components in the beamline. We model the phase profile φ of the light in a plane immediately behind the last optical element as

where  is the phase imprinted on the light field by the SLM. The phase
  is the lens phase of an idealised lens focusing at the MOT and effectively performing the Fourier transform. In writing the first term on the right-hand side of equation (4), we have assumed that a ray of light starting at point (x, y) in the SLM plane, remains close to the transverse coordinates (x, y) during its traversal of the beamline7
. The phase
is the lens phase of an idealised lens focusing at the MOT and effectively performing the Fourier transform. In writing the first term on the right-hand side of equation (4), we have assumed that a ray of light starting at point (x, y) in the SLM plane, remains close to the transverse coordinates (x, y) during its traversal of the beamline7
. The phase  contains all aberrations, i.e., any deviation of the actual phase from the required phase. Clearly, the aberrations
  can be corrected by the SLM by subtracting
  from
from  .
.
A key step is the (nontrivial) determination of the exact phase error inside the vacuum chamber. We resort to a method reminiscent of the Shack–Hartmann procedure [48, 49]. We divide the phase pattern on the SLM into two parts, as shown in figure 3(a). A small circular area of the SLM is selected, and imprinted with a constant phase. The remaining area of the SLM outside the circular region is imprinted with a linear phase pattern which causes all the light incident on it to be deflected at a large angle, such that it no longer hits the MOT. Therefore, the excitation laser impinging on the MOT is reduced to a single narrow beam, originating from the small circular area on the SLM. One can think of the phase pattern as if modifying the original pupil function P to an effective pupil function P' corresponding to the small circular area.
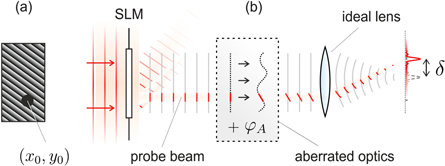
Figure 3. Method for sampling the phase aberration  of the optical system. (a) SLM phase pattern, used for (b) sending a small probe beam through the beamline, which experiences only a small, approximately linear part of
  . The gradient of
  can then be recovered from the displacement δ of the focal spot. In practice, the lens is part of the optical system, but for conceptual simplicity it is drawn separately.
Download figure:
Standard image High-resolution imageAs the narrow beam passes through the optical system, it samples only a small part of the total phase aberration, in a small area around the coordinates  (see figure 3(b)). To a first approximation the phase aberration in this small area, as experienced by our probe beam, is linear in x and y. The effect of a purely linear phase is to move the intensity pattern in the focal plane:

Our phase pattern thus produces a single spot, whose size and shape are determined by the pupil function P', whereas its displacement is proportional to the gradient of the phase aberration, with  and
and  in equation (5). The position of the spot in the focal plane is detected by measuring the displacement of the ion spot on the detector, allowing us to determine the local gradient of the phase aberration. By varying the coordinates
  we can sample
  in its entirety. By subsequently fitting the gradient data with a smooth polynomial composed of rectangular Zernike polynomials [50], we reconstruct the total phase aberration
  .
.
3. Results
We now turn our attention to the creation of a periodic array of (Rydberg) excitations in our atomic cloud. But first, we carry out the aberration correction scheme as described in the previous section. The diameter of the aberration probing beam determines the size of the displaced spot in the focal plane, with smaller (larger) diameters leading to larger (smaller) spot sizes. We found a sampling beam diameter of 1 mm to give a good tradeoff between the precise aberration sampling in the SLM plane associated with narrow probe beams, and the accurate displacement measurements in the focal plane associated with wider beams. At this diameter, a total of  measurements are taken in order to cover the entire SLM surface. Since the only variation between measurements is the SLM pattern, which can be controlled electronically, the whole sequence of measurements is easily automated. Figure 4(a) shows the measured ion spot displacements in the x and y directions, denoted by
  , respectively, as a function of the sampling coordinates
  on the surface of the SLM. There is a clear dependence of the measured spot displacement on the sampling coordinates. The corresponding root-mean-square (rms) wavefront error is more than a wavelength, which can be classified as highly aberrated. Near the edges of the sampling area no ion signal was visible, and hence no data points are shown. Light emanating from these areas of the SLM is obstructed by the accelerator structure before it reaches the MOT. The total usable area of the SLM is determined to (approximately) range between
  , and
, and  .
.
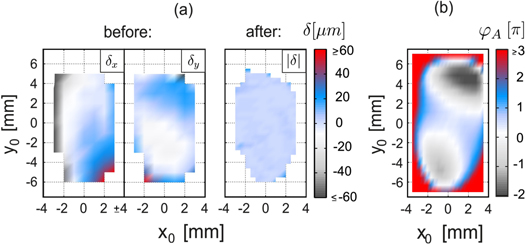
Figure 4. (a) Measured spot displacement δ before and after aberration correction, showing significant flattening of the wavefront. The probe beam is blocked near the edges, hence no data is shown there. (b) Phase aberration  as subtracted from the wavefront.
Download figure:
Standard image High-resolution imageThe reconstructed phase aberration  , as shown in figure 4(b), is then subtracted from the light field by the SLM. In practice, the procedure is iterated ∼5 times, since the path of the probe beam through the optical system is slightly altered by imprinting a phase with the SLM. The final spot displacements after iteratively correcting the phase aberrations (see figure 4) are significantly reduced, and the aberrations have been removed to a large extent. The rms wavefront error associated with the final displacements is approximately
  , suggesting a performance at the diffraction limit (
 [51]).
After correcting the phase aberration we proceed by creating intensity patterns consisting of arrays of spots. For a single experimental shot we illuminate the cloud below saturation intensity for  , after which the ions are extracted. The detector is exposed for 100 s at a 10 Hz repetition rate. Figure 5(a) shows the resulting ion detector image with a 10 × 10 spot array, measured before the aberration correction was applied. Figure 5(b) shows the same spot pattern, after applying the aberration correction while keeping all other parameters the same, showing a significant improvement in pattern quality. The spacing between the spots is approximately
  in the x-direction, and
  in the y-direction, with a spot size which would correspond to a diffraction limit of
  . This agrees well with the theoretical diffraction limit from equation (3), taking into account the reduced aperture due to beam clipping. Smaller spacings are possible, we are able to resolve individual spots down to a spacing of
  . Figure 5(c) shows an array of spots, with the atoms in the target locations excited to the Rydberg 82D state. The spacing between the spots is approximately
  in the x-direction, and
  in the y-direction. A distinct intensity gradient is visible across the spot pattern, due to density variations of the atomic gas. Finally, figure 5(d) further demonstrates the capability of the SLM to produce arbitrary intensity patterns in the MOT.

Figure 5. Ion detector signal. (a) 10 × 10 array of spots, no aberration correction, excitation to the continuum (ionization). (b) Identical settings as in (a), but after aberration correction. (c) 10 × 10 array of spots, atoms excited to the 82D Rydberg state. (d) Complex pattern demonstrating the ability of the SLM to create arbitrary intensity patterns (ionization). The spatial coordinates are calculated back to positions  in the MOT from where the detected ions originated. The detector images suffer from a background glow, which can be traced back to the pointspread function of a single detected ion.
Download figure:
Standard image High-resolution image4. Conclusion
In conclusion, we have demonstrated the ability to excite atoms to the Rydberg state or the continuum at well defined, programmable locations in an ultracold atomic gas. We employed an SLM for delivering high quality optical patterns inside a vacuum chamber, controlling the phase of the light field to well within a wavelength, despite a highly aberrated optical beamline. The aberrations are characterized by observing the ion signal resulting from small probe beams, that are sent by the SLM along different paths through the optical beamline. The SLM could then be used to subtract the phase aberration from the light field, removing the aberrations.
Acknowledgments
This work is part of the research programme of the Foundation for Fundamental Research on Matter (FOM), which is part of the Netherlands Organisation for Scientific Research (NWO).
Footnotes
- 6
Original Rydberg portrait credit: AIP Emilio Segre Visual Archives, WF Meggers collection.
- 7
The validity of this assumption depends also on the SLM phase pattern
 , which can affect the path of light beams, and it depends on the length of the beamline. We have verified that the approximation holds for our experimental conditions.
