


Abstract
Nuclear reactors are the most intense man-made source of antineutrinos, providing a useful tool for the study of these particles. Oscillation due to the neutrino mixing angle  is revealed by the disappearance of reactor
  over ∼km distances. Use of additional identical detectors located near nuclear reactors reduce systematic uncertainties related to reactor
  emission and detector efficiency, significantly improving the sensitivity of oscillation measurements. The Double Chooz, RENO, and Daya Bay experiments set out in search of
  using these techniques. All three experiments have recently observed reactor
  disappearance, and have estimated values for
  of 9.3◦ ± 2.1°, 9.2◦ ± 0.9°, and 8.7◦ ± 0.4° respectively. The energy-dependence of
  disappearance has also allowed measurement of the effective neutrino mass difference,
  ≈
≈  . Comparison with
  ≈
≈  from accelerator
  measurements supports the three-flavor model of neutrino oscillation. The current generation of reactor
  experiments are expected to reach ∼3% precision in both
  and
and  . Precise knowledge of these parameters aids interpretation of planned
  measurements, and allows future experiments to probe the neutrino mass hierarchy and possible CP-violation in neutrino oscillation. Absolute measurements of the energy spectra of
  deviate from existing models of reactor emission, particularly in the range of 5–7 MeV.
Export citation and abstract BibTeX RIS

Content from this work may be used under the terms of the Creative Commons Attribution 3.0 licence. Any further distribution of this work must maintain attribution to the author(s) and the title of the work, journal citation and DOI.
1. Introduction
Nuclear reactors have been essential in revealing the nature of the neutrino. In the 1956, detection of antineutrinos from nuclear reactors served as the first direct evidence of this subtle particle [1]. A decade ago, observation of the energy-dependent disappearance of reactor antineutrinos provided the most distinct evidence for neutrino flavor oscillation [2, 3]. This confirmation of oscillation demonstrated that lepton flavor is not conserved, and indicated that the neutrino has mass. These significant changes to the standard model leave us with a qualitatively different picture of fundamental physics [4].
Aside from establishing that neutrinos do oscillate, experiments using reactor antineutrinos have allowed us to measure four of the six parameters of the standard oscillation model (see table 1). Measurement of the disappearance of reactor  over ∼100 km distances has given the most precise estimate of
  , as well as a value for
  consistent with that obtained using neutrinos from the Sun [3]. More recently, precision measurements of reactor
  disappearance over ∼2 km distances have revealed
  , and measured
  with precision comparable to experiments using neutrinos generated by particle accelerators. The significant size of
  has opened the door for future experiments aiming to measure the ordering of the neutrino mass states and to test for charge–parity violation in neutrino oscillation [5, 6].
Table 1. Three-flavor neutrino oscillation parameters.
| Parameter | Value | Primary measurement techniques |
|---|---|---|

|
34 ± 1° | Solar  disappearance, reactor disappearance, reactor  disappearance disappearance |

|
45 ± 8° | Atmospheric  disappearance, accelerator disappearance, accelerator  disappearance disappearance |

|
8.7 ± 0.4° | Reactor  disappearance, accelerator disappearance, accelerator  appearance appearance |

|
+(7.50  ) × 10−5 eV2 ) × 10−5 eV2 |
Reactor  disappearancea disappearancea
|
 , , 
|
± (2.4 ± 0.1) × 103 eV2 | Accelerator  disappearance, reactor disappearance, reactor  disappearanceb disappearanceb
|
| δ | Unknown | Future accelerator  , ,  appearance appearance |
aSolar  disappearance determines the sign of
  via the MSW effect.
bCurrent experiments are unable to discriminate these two oscillations at nearly identical frequency, reporting only a single effective frequency
via the MSW effect.
bCurrent experiments are unable to discriminate these two oscillations at nearly identical frequency, reporting only a single effective frequency  for muon neutrino disappearance or
  for electron antineutrino disappearance.
Here I will discuss the recent progress in measurement of reactor antineutrino oscillation, with a focus on the Double Chooz, Daya Bay, and RENO experiments. Section 2 describes the production of antineutrinos from nuclear reactors. Section 3 discusses the method of detection of reactor  . Section 4 outlines the oscillation signal for these experiments. Section 5 presents the results from each of the experiments. Section 6 looks at the implications of the non-zero value of
  and future prospects for oscillation measurements using reactor antineutrinos.
2. Antineutrinos from nuclear reactors
Of the man-made sources of neutrinos and antineutrinos, nuclear reactors are the most prolific1
. A standard 3 GWth commercial electric power reactor generates approximately 1021  every second. In general, heavier nuclei require a larger ratio of neutrons to protons to remain stable. As these heavy nuclei fission within the reactor core, the resulting nuclear fragments are neutron-rich. The fragments subsequently beta decay until they reach a stable neutron-to-proton ratio

On average, six beta decays occur as a result of each nuclear fission. This necessity to reach a stable neutron-to-proton ratio causes reactors to emit antineutrinos, while the fusion of light nuclei within the sun emits neutrinos.
The total antineutrino flux emitted by a reactor can be expressed as a sum of  emission due to each fissioning isotope i,

 is the thermal power generated by the reactor. Dividing the thermal power by the average energy per fission
  gives the total fission rate within the reactor,
  . The fission fractions
  are defined as the rate of fissions of isotope i over the total rate of all fissions. The average energy released per fission in the reactor is given by
  , where
  is the average the energy released by a single fission of isotope i. Si(E) is the average energy spectrum of
  emitted by the fission of isotope i.
  is a few-% correction to this spectrum based on reactor non-equilibrium effects.
  is a possible contribution from spent nuclear fuel which may be stored near the reactor core.
The antineutrino flux is strongly correlated with the thermal power generated by the reactor,  . The thermal power is monitored as part of reactor operation and power generation. By measuring the temperature and flow rate of cooling water in the reactor, the thermal power is known to within ∼0.5% [7]. For a standard commercial pressurized water reactor, fission of the four isotopes 235U, 238U, 239Pu, and 241Pu generate more than 99% of the antineutrinos [8]. The relative fission rates of these isotopes at any given time depends on the specific reactor fuel composition and operation characteristics. Typical fission fractions fi for a standard reactor are approximately 0.56:0.08:0.30:0.06 for these four dominant isotopes. The total
  emission has only a weak dependence on the fission fractions, given that the energy release
  and spectra Si are similar among the isotopes. The energy released per fission has been estimated by comparing the mass of the fission products relative to the fission parent. The respective values are 202:206:211:214 MeV per fission [9, 10].
The energy spectra of emitted antineutrinos, Si(E), decline steeply with energy and are negligible above 10 MeV. The shape is given by the sum of a large number of beta decay antineutrino spectra with a distribution of endpoint energies. Two methods are commonly used to estimate these energy spectra. In the ab initio approach, tables of known nuclear energy levels are used to calculate the distribution of beta decays required for the fission fragments to reach stability [11–13]. Due to insufficient nuclear data for highly-unstable fission fragments, the precision of this method is limited to ∼10% up to ∼8 MeV. In the alternate  conversion approach, the measured beta decay
  energy spectra are used to estimate the corresponding
  spectra. In the early 1980 s, samples of 235U, 239Pu, and 241Pu were placed in the neutron flux of a reactor, and the total beta decay
  spectra were measured with a magnetic spectrometer [14–16]. More recently, a corresponding measurement for 238U was performed [17]. The spectra were each fit as a sum of 30 individual
  beta decay spectra. Each component
  was then converted to the corresponding
  spectrum, assuming the expected correlation between the two spectra. The original calculation using this approach claimed uncertainties of 3–4% on the estimated
  spectra. A recent re-evaluation used a hybrid approach, incorporating the tables of known beta decays into the
  conversion method [13]. This allowed for improved handling of small corrections to the energy spectrum due to the known charge of the nucleus. The improvements resulted in similar
  spectra, but with a
  shift in the total normalization. A detailed study of the uncertainties in the reactor antineutrino spectrum is given in [18]. A recent study suggested that distortion of the energy spectra due to forbidden beta decays may increase this uncertainty to ∼5% or more [19]. Fresh reactor fuel which has not yet achieved equilibrium and spent fuel commonly stored near a reactor can introduce ∼1%-level corrections to the predicted flux and spectrum [20, 21].
Absolute measurements of the  flux from reactors are 6% lower than the standard predictions based on the
  conversion. This deficit has been considered possible evidence of oscillation to a hypothetical fourth antineutrino [22]. Recent measurements of the
  energy spectrum show a ∼10% disagreement with these predictions in the region of 5–7 MeV [23–25]. The ab initio calculation of [26] predicts a spectrum consistent with measurements, which is unexpected given the large uncertainties present in the calculation. According to this calculation, beta decays to the ground states of eight prominent fission daughters (96Y, 92Rb, 142Cs, 97Y, 93Rb, 100Nb, 140Cs, and 95Sr) contribute 42% of the
  flux within 5–7 MeV and result in a spectral shape similar to that seen in measurements. Dedicated measurements of the beta decays of these prominent isotopes would reduce the uncertainties associated with this calculation.
3. Detection of reactor antineutrinos
The common detection method for reactor  is inverse beta decay (IBD)

The simultaneous production of both a positron and a free neutron provide a distinct signal in most  detectors, significantly reducing backgrounds for this rare interaction. The positron carries away most of the excess kinetic energy, allowing a measurement of the
  energy. It was via this process that the antineutrino was first detected in 1956 [1].
The  energy threshold for this interaction is 1.8 MeV. To first order the cross section is proportional to the square of the
  energy, and is roughly 7 × 10−43 cm2 at 4 MeV. The cross section is related to neutron decay by crossing symmetry, which provides the standard method for its calculation [27].
To have a measurable rate of IBD interactions requires a large target of protons (1H atoms). In addition, the target must allow for detection of the positron and the free neutron. The most common approach is a large volume of organic liquid scintillator, which serves as both target and detector. The organic molecules in scintillator provide sufficient Hydrogen targets. The scintillator emits light when ionized by the positron and annihilation gammas, and the amount of light provides a measurement of the positron energy. The  energy can be estimated as
  MeV, where
  is the positron kinetic plus annihilation energy.
The free neutron recoils with up to ∼100 keV of energy, and thermalizes after a few nuclear scatters. Once thermalized the neutron is captured by another nucleus, which de-excites by emitting gamma rays

These gamma rays also ionize the scintillator, producing a delayed signal a short time after the positron. The energy of the delayed gamma rays depend on the capturing isotope. For organic scintillators,  of neutrons capture on 1H with a mean capture time of ∼200 μs, and release a single 2.2 MeV gamma ray. Alternatively, the scintillator can be doped with an isotope specifically intended to capture the neutron. A common example is natGd, which releases a few gammas with a total energy of ∼8 MeV. Even at concentrations as low as 0.1% of the scintillator mass, the very large capture cross sections of 157Gd and 155Gd are such that ∼80% of neutrons capture on Gd, and the mean capture time is shortened to ∼30 μs. The number of IBD interactions per day for such a scintillator detector of mass M at distance L from a reactor of power P is
 ![${{N}_{{\rm IBD}}}\approx 1\times M[{\rm ton}]P[{\rm G}{{{\rm W}}_{{\rm th}}}]\;T[{\rm day}]/{{L}^{2}}[{\rm k}{{{\rm m}}^{2}}]$](https://content.cld.iop.org/journals/1367-2630/17/2/025003/revision1/njp507805ieqn88.gif) , neglecting the effects of oscillation.
, neglecting the effects of oscillation.
4. Oscillation of reactor antineutrinos
Oscillation measurements using reactor antineutrinos are generally searches for  disappearance. For antineutrinos with energy of a few MeV, there is insufficient energy to create an outgoing muon or tau lepton in an IBD interaction. As reactor
  oscillate to
  and
and  , they lose the ability to interact via IBD. Measurements of the
  flux versus distance from the reactor are used in searches for this
  disappearance. The energy-dependence of reactor
  disappearance is currently the most distinct evidence in support of neutrino oscillation.
Neutrino oscillation is driven by the assumption that neutrinos have mass and that the mass eigenstates are not equivalent to the weak interaction (flavor) eigenstates. Instead, they are related by a unitary matrix U,

In the three-flavor PMNS model of neutrino mixing, U is commonly decomposed into three angles  , an off-diagonal phase δ, and two possible diagonal phases
  and
and  ,
,

The diagonal phases have no observable impact on oscillation, so are not considered here. The size of the off-diagonal terms in this matrix determine the amplitude of neutrino oscillation. The differences of the neutrino masses squared,  , determine the frequency of oscillation. Since
  , only two are independent. Table 1 presents the current best estimates for these parameters, and the experimental methods used to obtain these values.
In the three-flavor model, the probability for a  of energy E to be measured as a
  after propagating a distance L is

where ![${{\Delta }_{ji}}\simeq 1.267L[{\rm m}]\Delta m_{ji}^{2}[{\rm e}{{{\rm V}}^{2}}]/E[{\rm MeV}]$](https://content.cld.iop.org/journals/1367-2630/17/2/025003/revision1/njp507805ieqn103.gif) . The mixing angle
. The mixing angle  and the complex phase δ do not influence reactor
  disappearance. Effects from interactions with earth matter are also negligible. Equation (7) demonstrates that reactor antineutrino experiments are capable of probing four of the six oscillation parameters. At short distances the oscillation due to the two nearly equivalent mass differences
  and
and  are indistinguishable. Reactor experiments report a single effective frequency

 ± 0.023 × 10⁻³ eV2, where the plus sign is used if the neutrino mass hierarchy is normal, while the minus sign is used if the hierarchy is inverted2
.
± 0.023 × 10⁻³ eV2, where the plus sign is used if the neutrino mass hierarchy is normal, while the minus sign is used if the hierarchy is inverted2
.
Figure 1 shows the predicted  survival probability versus distance from the reactor, integrated over the reactor
  energy spectrum and IBD cross section. This illustrates the distance regimes for oscillation reactor
  experiments. Closer than a few hundred meters, no significant oscillation is expected. Between a few hundred meters and ten kilometers, small-amplitude oscillation due to
  dominates. Beyond ten kilometers, large-amplitude
  oscillation takes over, with a survival minimum at ∼60 km. Each oscillation is damped at larger distances due to the averaging over reactor
  of different energies.

Figure 1. Reactor  oscillation survival probability versus distance from reactor (blue line). The probability is averaged over the energy spectrum of reactor antineutrinos, and weighted by the inverse beta decay cross section. The prominent deficit at 60 km is due to oscillation driven by the
  mass difference, while the deficit at 1.6 km is due to
  ≈
≈  . The values of
  and
and  determine the corresponding amplitudes of neutrino flavor change at these two distances.
Download figure:
Standard image High-resolution imageThe broad energy spectrum of reactor antineutrinos and the energy-sensitivity in  detection makes reactor experiments ideal for the measurement of oscillation. Figure 2 demonstrates the expected oscillation distortion of the positron spectrum at a variety of distances from a standard reactor. The Kamioka Liquid Scintillator Antineutrino Detector (KamLAND) was the first experiment to clearly measure this energy-dependent signature, solidifying acceptance of neutrino oscillation [2].

Figure 2. Calculated oscillation distortion of the positron energy spectrum at 0, 1.6, 60, and 180 km from a nominal nuclear reactor. At 1.6 km, oscillation driven by the larger mass differences ( ≈
≈  ) results in an energy-dependent deficit centered at 3 MeV. The amplitude of this oscillation is given by
  . The first oscillation minimum driven by the smaller mass difference (
 ) is reached at 60 km. The larger amplitude of
  causes significant
  disappearance. Oscillation from the larger mass difference is still visible as a high-frequency small-amplitude fluctuation on the residual spectrum. The second
  oscillation minimum is reached at 180 km, which is conveniently the flux-weighted average distance of the reactors measured by the KamLAND experiment. At this distance, measurement of the high-frequency component of the oscillation is in practice compromized by the finite detector resolution and the averaging over
  from multiple reactors at different distances.
Download figure:
Standard image High-resolution image5. Recent experimental results
The past two years have shown dramatic progress in oscillation measurements at ∼1 km distances from nuclear reactors. In particular, these experiments have provided precise measurements of the mixing angle  , and are providing complementary measurements of the larger mass difference
  . The details of these short-distance oscillation results are discussed in this section. Before looking at these recent results, it is useful to review previous measurements at these distances.
Around the turn of the century, two experiments attempted to measure reactor  oscillation at 1 km. The Chooz experiment used a 5 ton monolithic target of Gadolinium-loaded scintillator at a distance of 1.0 km from two reactors at the Chooz nuclear power facility in the Ardennes region of France [28]. The Palo Verde experiment used an 11 ton segmented detector ∼0.9 km from the three reactors at the Palo Verde nuclear power station in Arizona [29]. Neither experiment found a significant deficit due to oscillation, limiting the mixing angle
  to less than 11° at the 90% C.L. [28, 29]. An important lesson learned from these experiments was that radiopurity and self-shielding of monolithic detectors provided distinct advantages. In addition, further development was required to produce a chemically stable Gadolinium-loaded liquid scintillator.
Measurements of muon neutrinos over the past decade motivated a new generation of reactor experiments. The disappearance of ∼GeV atmospheric and accelerator muon neutrinos of over distances of 102–103 km implied a mass splitting  of approximately 2.4 × 10⁻³ eV2 [30–32]. According to the three-flavor neutrino model, this implied that reactor
  would oscillate over distances of ∼1 km. The amplitude of this oscillation would be given by the mixing angle
  . Given that the Chooz and Palo Verde experiments had not observed significant oscillation, a range of theoretical models were proposed which predicted that
  would be exactly or nearly zero [6, 33].
The precision of the previous searches for  were limited to a few percent due to uncertainties in the rate of
  emission from nuclear reactors, in the interaction cross section, and the detector efficiency. To enable more precise experiments, Mikaelyen and Sinev proposed a relative measurement using an additional detector located near the reactor to constrain the emitted
  flux before significant oscillation [34]. In this manner the precision of oscillation searches would be improved, and primarily limited by uncertainty in the relative acceptance and efficiencies of the two detectors. While they had proposed to make this measurement at the Krasnoyarsk reactor facility in Russia, many other candidate sites were eventually considered: Angra (Brazil), Daya Bay (China), Chooz, Craus, Penly (France), Kashiwazaki-Kariwa (Japan), Kuo-Sheng (Taiwan), Braidwood, Byron, Diablo Canyon, La Salle, Limerick, Peach Bottom, and Wolf Creek (USA) [35]. Only three proposed experiments proceeded to construction: the Double Chooz experiment at Chooz in the Ardennes region of France [36], the Daya Bay experiment near Dapeng city in the Guangdong province of China [37], and the RENO experiment near Yonggwang city in South Korea [38].
Each site presented particular advantages. The Chooz reactor facility had an existing small underground cavity at 1.0 km from the two reactors3
, requiring excavation only for a single detector site located nearer to the reactors. The other experiments required excavation of multiple cavities. The Yonggwang and Daya Bay sites are both among the world's largest reactor facilities. With six nuclear reactor each, they are among the most intense man-made sources of antineutrinos. The Daya Bay facility is at the foot of a steep mountain slope. Construction of near and far detectors beneath this slope gives significant cosmic ray shielding and low cosmogenic backgrounds. At the same time, the layout of the six reactors at Daya Bay required at least two near detectors to sufficiently constrain the reactor  flux. Table 2 summarizes the main characteristics of each experiment.
Table 2. Summary of main characteristics of the experiments.
| Reactors | Distance (km) | Depth (m.w.e) |
 Target (ton) Target (ton) |
|||||
|---|---|---|---|---|---|---|---|---|

|
Power( ) ) |
Near | Far | Near | Far | Near | Far | |
| Double Chooz | 2 | 8.5 | — | 1.05 | — | 300 | — | 8.3 |
| RENO | 6 | 16.8 | 0.408 | 1.444 | 120 | 450 | 16 | 16 |
| Daya Bay | 6 | 17.4 | 0.512 | 1.579 | 250 | 860 | 40 | 80 |
| 0.561 | 265 | 40 | ||||||
The antineutrino detectors used by the three experiments share many common features. All are composed of three nested liquid volumes, separated by transparent acrylic tanks [39]. At the center is a monolithic multi-ton cylindrical target of Gadolinium-loaded liquid scintillator. This serves as the interaction target for the reactor  . The target is contained within a transparent acrylic tank, and nested within a secondary cylindrical volume of regular liquid scintillator. This second region improves the efficiency for collection of all gamma rays produced by
  interactions within the target. The outermost volume is composed of inactive mineral oil. Photomultiplier tubes (PMTs) are mounted within this region, and detect optical photons primarily produced by particle interactions within the scintillator. The mineral oil shields the scintillating regions from natural radioactivity within the PMTs and other detector materials, as well as external sources of background. The three-zone design gives these detectors ∼80% efficiency for detection of
  IBD interactions followed by neutron capture on Gd within the target volume. The major sources of detector inefficiency are due to neutron capture on Hydrogen instead of Gadolinium and interactions where significant Gadolinium capture gamma energy escapes the scintillating volume of the detector. Interactions followed by neutron capture on Hydrogen can also be studied, but at the cost of increased backgrounds.
The experiments differ in the size and number of antineutrino detectors. The Double Chooz, RENO, and Daya Bay antineutrino targets are 8, 16, and 20 tons, respectively. The Double Chooz and RENO experiments use a single pair of near and far detectors, although the Double Chooz near detector is still currently under construction. As discussed, the Daya Bay experiment required detectors arrayed at two near sites and one far site. The experiment installed a total of eight detectors, two at each near site and four at the far site. The use of multiple detectors at each site not only increases the total signal rate, but it also allows side-by-side confirmation of relative detector acceptance and efficiency [40].
Due to the particular delayed-coincidence signal pair produced by IBD, few processes introduce backgrounds for  detection. The most prominent are accidental and cosmogenic backgrounds. Accidental backgrounds refer to two uncorrelated signals from natural radioactivity which happen to mimic the pair of signals of a
  interaction. Prominent cosmogenic backgrounds are neutrons produced by cosmic ray muon interactions within the detector or surrounding materials, and cosmic ray production of 9Li or 8He within the detector. These isotopes beta decay with the additional emission of a neutron from the excited daughter nucleus. To reduce backgrounds, each experiment has a shielding system surrounding their antineutrino detectors. The extent of these systems varies between experiments. The Double Chooz experiment used an additional 50 cm layer of liquid scintillator as well as a 1 m thick passive oil buffer. This active region uses 78 PMTs to identify cosmic rays and external gamma rays. Around this layer, 15 cm of steel provides additional passive shielding of gamma rays from natural radioactivity in the surrounding rock. Two layers of instrumented plastic scintillator strips above the detector veto cosmic rays. The RENO detectors are submerged in a 1.5 m thick cylinder of ultrapure water. The water pools attenuate external gamma rays and neutrons, but also include PMTs which identify cosmic rays via their Cherenkov light emission within the water. The multiple detectors at each Daya Bay site are submerged within a common 10 m deep pool of ultrapure water. The pools provide at least 2 m of water between the detectors and the surrounding rock. Each water pool is optically separated into an outer and inner region which can be independently used to veto backgrounds. Four layers of resistive plate chambers above each pool provide additional cosmic ray identification. Vetoing the time periods following cosmic rays removes the majority of cosmogenic backgrounds. The veto results in additional inefficiency of 2–20% for these three experiments, depending on the specific detector configuration and depth underground.
To provide a quantitative comparison of the experiments, table 3 summarizes the latest measured signal rates and estimated background fraction reported by each [41–43]. The statistical sensitivity to oscillation is dominated by the measured event rates at the far detectors. The uncertainty in the background contribution also limits the precision of the relative comparison of the near and far sites.
Table 3.
Measured reactor  signal and background for the experiments, averaged over the reported data period.
| Signal rate (day−1) | Background (%) | Approx. Precision (%) | ||||
|---|---|---|---|---|---|---|
| Near site(s) | Far site | Near site(s) | Far site |
 , 1 yr , 1 yr |

|
|
| Double Chooz | — | 36.2 | — | 2.2 ± 0.5 | 0.9 | 1.5 |
| RENO | 758.2 | 75.0 | 2.9 ± 0.3 | 6.5 ± 0.8 | 0.6 | 0.8 |
| Daya Bay | 1067.1 | 219.1 | 2.5 ± 0.2 | 4.8 ± 0.2 | 0.4 | 0.3 |
| 489.9 | 2.0 ± 0.4 | |||||
All three experiments began collecting data in 2011. Only the RENO experiment had completed construction at that time. The Double Chooz far detector was finished, but construction of the near detector had not yet begun. The Daya Bay experiment began data collection with two near detectors in August of 2011. By December of 2011, three near and three far detectors were in operation. The final two detectors were still under construction, but their installation was delayed to allow for an initial six-detector measurement to be completed. Given the comparable schedules, there was significant competition to obtain the first definitive measurement of oscillation.
The Double Chooz experiment was first to report a result, announcing an indication of  disappearance in November 2011 [44]. In 101 days of data, 4121
  candidate events were identified in the far detector. With only the far detector in operation, the precision was hampered by uncertainties in the absolute reactor
  flux and interaction cross-section. To overcome these uncertainties, they constrained the expected
  interaction rate using a 1994 measurement at 15 m from the Bugey reactor by the Bugey4 experiment [45]. The Double Chooz analysis applied a 0.9 ± 1.3% correction to the Bugey4 measurement to account for the differences in the predicted reactor
  flux between the two experiments. In addition to the rate deficit, they also reported a distortion of the positron energy spectrum consistent with that predicted by the three-flavor oscillation model using
  from the MINOS experiment. The rate and spectral distortion gave
  . This result excluded
  at 1.9σ.
On 8 March 2012, the Daya Bay experiment announced a 5.2σ discovery of  disappearance [46]. With 55 days of data taken from 24 December 2011 until 17 February 2012, 10416
  candidates were identified in three far detectors. During the same period, 80 376 candidates were collected in three near detectors. The rates measured by the near detectors were used to predict the rate at the far detector, assuming no oscillation. A weight was applied to the rate measured in each near detector, based on the integrated thermal power and distance of the six reactor cores. The far detectors measured a rate 0.940 ± 0.011(stat) ± 0.004(syst) relative to the prediction. The rate measured in each detector was compared to that predicted depending on the value of
  . The oscillation frequency was allowed to vary, but constrained according to the MINOS measurement of
  . The predicted rates were not constrained according to the model of reactor
  emission. This ensured that the near detectors determined the total flux, and that differences between the modeled and true flux would not bias the oscillation measurement. A value of sin2 2θ13 = 0.092 ± 0.016(stat) ± 0.005(syst) was reported. Given that the detector systematic uncertainties were better than planned, the measurement precision was limited by statistical uncertainty. An absolute measurement of the reactor
  flux was not reported. The distortion of the energy spectrum at the far site relative to the near site energy spectrum was consistent with oscillation, although the energy spectra were not included in the oscillation analysis.
On 8 April 2012, the RENO experiment reported a similar result, demonstrating  disappearance at 4.9σ [47]. Between 11 August 2011 and 26 March 2012 they had collected 229 days of data, containing 17 102 and 154 088
  candidates in their far and near detectors respectively. A weighted ratio of the far to near detector rates was 0.920 ± 0.009(stat) ± 0.014(sys), showing clear evidence of disappearance. Using a
  statistic, they determined sin2 2θ13 = 0.113 ± 0.013(stat) ± 0.019(sys). While the statistical precision was better than the Daya Bay measurement, the uncertainty in the rate of cosmogenic backgrounds resulted in a slightly lower overall precision. A comparison of the absolute measured flux to the prediction was not reported. The ratio of the far to near energy spectrum was similar to that predicted from oscillation, although there were concerns raised about a slight deviation above 5 MeV [48].
These initial measurements were quickly updated as more data was collected. In June 2012, the Double Chooz experiment reported a total of 8249 interactions detected over 228 days [41]. This analysis incorporated an extensive study of backgrounds which reduced this dominant systematic uncertainty from 3% to 1.5% in the rate measured at the far detector. For 88 days of this data period at least one reactor was shut down, as well as a 22.5 h period where both of the reactors off. Study of these periods provided support that their background estimates were correct. These improvements yielded sin2 2θ13 = 0.109 ± 0.030(stat) ± 0.025(syst), and gave a 2.9σ signal of  disappearance.
The same month, the Daya Bay experiment extended the data set to 139 days [49]. A total of 28 909 far and 205 308 near  interactions were detected. Using a rate-based analysis identical to the previous work, an improved estimate of sin2 2θ13 = 0.089 ± 0.010(stat) ± 0.005(syst) was obtained. This corresponds to
  = 8.7° with a precision of 6.5%, still limited by statistical uncertainty.
The Double Chooz experiment then explored  interactions where the outgoing neutron captured on Hydrogen (n-H), instead of on Gadolinium (n-Gd) within the detector [50]. With Hydrogen present in both the innermost and secondary scintillating detector volume, this tripled their target volume. In January 2013 they reported a n-H study using the same data period as their previous n-Gd study. The increased signal statistics came at the cost of increased background and systematic uncertainty. The data contained 36 284 n-H candidate interactions, of which 52% were estimated to be background. An analysis of the rate and energy spectrum provided sin2 2θ13 = 0.097 ± 0.034(stat) ± 0.034(syst), consistent with but having slightly lower precision than their measurement using n-Gd interactions.
A unique capability of the Double Chooz experiment is the ability to make a background-only measurement when both reactor cores are simultaneously shut down. Such a measurement is unlikely at the larger Daya Bay or RENO facilities. The experiment reported a study of a combined 7.53 days of data collected while both reactors were off [51]. A total background rate of 1.0 ± 0.4 events per day was found. This result supported the earlier estimates of backgrounds, in particular those of cosmogenic origin. This allowed an alternate analysis approach, estimating  from the variation in far detector total rate versus reactor power [52]. A combined analysis of both the n-Gd and n-H rates yielded sin2 2θ13 = 0.102 ± 0.028(stat) ± 0.033(syst), consistent with their previous analysis approach.
The RENO experiment updated their far versus near detector rate analysis in March 2013 [43]. With a total of 403 days of data from the far detector, they identified 30211  interactions. With a corresponding 369 days from the near detector, 279 787 interactions were found. From the comparison of far and near detector rates they estimated sin2 2θ13 = 0.100 ± 0.010(stat) ± 0.015(syst), giving a 10% measurement of
  . The precision was limited by a combination of the systematic uncertainty in the cosmogenic background, the
  flux distribution between the six reactor cores, and statistical uncertainty at the far detector.
On 21 August 2013, the Daya Bay experiment reported an analysis of the energy dependence of reactor  disappearance [42]. Using 217 days of data, a total of 41 589 and 296 721
  interactions were identified at the far and near detectors respectively. Given the high statistical precision of the measured energy spectra, detailed characterization of systematic effects in energy was required. In particular, the nonlinearity of scintillation light production and of the electronics were intensively studied. Energy loss due to particle interaction in the thin acrylic vessel containing the scintillator target also required consideration. After accounting for these effects, a significant distortion of the far energy spectra relative to that measured near the reactors was observed. In addition, a deviation of the spectra at the near detectors was found relative to the prediction, consistent with the small amount of oscillation present over these short distances. The comparison of the measured rates and spectra of near and far detectors gave sin22θ13 = 0.090 + 0.008 − 0.009. This corresponds to
  = 8.7° with 5% precision, which is primarily limited by statistical uncertainty. Using only the rate information gave a comparable sin2 2θ13 = 0.089 ± 0.009. Neglecting knowledge of the relative detector rates, a spectral-only comparison was also possible. This yielded sin22θ13 = 0.108 ± 0.028, although the precision is significantly poorer than that provided by the rates alone.
The precision of the Daya Bay energy spectra allowed a simultaneous measurement of the oscillation frequency, and hence  . It was no longer necessary to rely on the frequency estimated from the MINOS measurement of
  using muon neutrinos. Combined analysis of the rate and spectrum gave
  ) × 10−3eV2, a 7.5% measurement. The measurement was consistent with that from muon disappearance,
  = (2.41 + 0.09 − 0.10) × 10−3 eV2. In this manner it provided the first precise connection between low-energy
  and high-energy
  /
/ disappearance measurements, supporting the three-flavor model of neutrino oscillation.
5.1. Current status
Figure 3 summarizes the evolution of the measurement of sin22θ13 over the past two years. In this short time our knowledge of the mixing angle  has gone from
  to 8.7° ± 0.4° now provided by the Daya Bay experiment. This precision will continue to improve over the next few years. The Double Chooz near detector is under construction, and is expected to begin operation in 2014. This should allow observation of reactor
  disappearance without relying on the Bugey4 measurement to provide an estimate of the absolute reactor flux. The RENO experiment has collected approximately 1000 days of data to date. With the increasing statistical precision, methods to reduce the systematic uncertainty from backgrounds are required. Unfortunately a small amount of
  accidentally leaked from their neutron calibration source, introducing a new background into the scintillator of their detectors. In October 2012, the Daya Bay experiment began operation of all eight detectors. The experiment has now collected over
  reactor
  interactions in the n-Gd channel. A roughly equal rate from the n-H channel have also been collected, and an oscillation measurement using this independent data is expected. Preliminary results, including improved oscillation measurements from all three experiments, were recently presented at the 26th International Conference on Neutrino Physics and Astrophysics [23, 53, 54], with the Double Chooz measurements already published [24]. After a planned five years of operation, and with roughly
  expected
  interactions, the Daya Bay experiment should reach a precision of 2–3%, or 0.2°. Even planned future long-baseline neutrino experiments are not expected to surpass this precision.
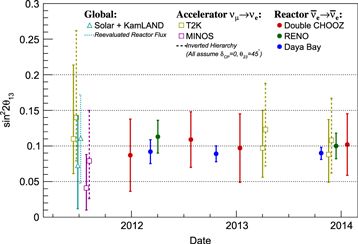
Figure 3. Evolution of measurements of  over the past three years. In 2011, slight tension in the value of
  measured by solar
  and reactor
  experiments suggested that
  might not be zero. At the same time, indications of
  appearance in
  accelerator beams also supported this notion. In 2012, clear observation of reactor
  disappearance cemented the presence of neutrino oscillation due to
  , and provided a precise value for this mixing angle. In 2013, improved precision showed consistency between both reactor and accelerator experiments, supporting the three-flavor model of neutrino oscillation. Successive results from the same experiment are highly correlated.
Download figure:
Standard image High-resolution image5.2. Accelerator  measurements

For the context of  , it is useful to briefly mention recent accelerator neutrino measurements. In addition to reactor
  disappearance,
  appearance in long-baseline beams of accelerator
  is sensitive to
  [6]. An initial search performed by the MINOS experiment in 2009 measured a slight excess of
  above the estimated background [55]. In June 2011 the T2K experiment reported the detection of 6
  events in a
  beam with only 1.5
  0.3 background predicted, signifying 2.5
  evidence of oscillation due to
  [56]. Soon after, the MINOS experiment reported 62 interactions observed, but with an expected background of 49.6
  7.5 their result only reached 1.6
  significance. The T2K experiment reported 11
  interactions in late 2012 [57], and by July 2013 observed of a total of 28
  interactions with an expected background of 4.9
  0.6 [58]. Estimation of
  from the rate of
  appearance was hindered by dependence on other oscillation parameters such as
  ,
,  ,
,  , and the neutrino mass hierarchy. Assuming
  = 2.4
= 2.4  eV
eV  ,
,  = 0.5, and
  = 0, they estimated
  = 0.140 + 0.038 − 0.032 or
  = 0.170 + 0.045 − 0.037 for the normal and inverted mass hierarchy respectively.
While the overall precision of accelerator appearance measurements does not match that provided by reactor  disappearance experiments, these results still provide additional support of the three-flavor neutrino oscillation model. Given the correlation of
  appearance rate with other neutrino oscillation parameters, the value of
  measured from reactor experiments can be used to interpret the accelerator results. In fact, slight tension between the latest measurements of
  from the Daya Bay and T2K experiments has been considered possible evidence of a non-zero value of the CP-violating phase
  .
.
6. Implications and future prospects
With the discovery of the unexpectedly large value of  we now have our first glimpse of the three-flavor structure of neutrino mixing. It is an outstanding theoretical question to explain this pattern of neutrino mixing. It is also unclear why the quarks show such small mixing angles in contrast to the neutrinos.
The large value of  also has consequences for future neutrino measurements. It allows for new experiments to probe the neutrino mass hierarchy over the coming decade, using reactor, atmospheric, and accelerator neutrinos [5]. Reactor antineutrinos propagating a distance of
  will show two small amplitude oscillations due to the slightly different mass splittings
  and
and  [59–61]. Regardless of the hierarchy, these two frequency components will be separated by a fixed offset given by
  . Yet since the amplitude of the
  oscillation will be roughly twice as large as the
  oscillation, the hierarchy is shown by whether the smaller-amplitude
  oscillation is at a higher or lower frequency than the larger-amplitude
  oscillation. Discrimination of these two frequency components in the
  energy spectrum requires a detector with unprecedented energy resolution and absolute calibration of the energy scale [62]. Unexpected structure in the reactor
  energy spectrum may present a systematic issue for determination of the hierarchy, although the impact has not yet been quantified [26]. Plans for such an experiment are being pursued [63, 64]. The large value of
  also introduces a matter-enhanced resonant oscillation for atmospheric neutrinos with energies of 5–10 GeV traversing particular trajectories through the earth's mantle and core [65, 66]. For the normal hierarchy the resonant oscillation only occurs for neutrinos, while for the inverted hierarchy it only occurs for antineutrinos. Large detectors with the capability to determine the neutrino direction, energy, and discrimination of
  from other neutrino flavors are required for such a measurement [5, 67].
A non-zero  is essential for searches for neutrino CP-violation using long-baseline accelerator
  appearance. The existing T2K and NO νA experiments may be able to provide some information about CP-violation, depending on nature's choice of the value of
  , and the mass hierarchy [68, 69]. The planned long-baseline neutrino experiment should have the best sensitivity to CP-violation [70]. Continued improvements in the precision of
  and
and  from the current generation of reactor
  experiments will aid the interpretation of these future neutrino oscillation measurements. Corresponding improvements in precision from other experimental techniques may allow for tests of unitarity of the neutrino mixing matrix, and probes of non-standard neutrino models.
Over the coming years, the existing reactor experiments will continue to improve their measurement of both  and
and  . The Daya Bay precision is expected to reach between 2 and 3%. This would surpass the existing 5% precision of
  provided by the MINOS experiment. Future results from the NOνA and T2K experiments intend to reach
  precision on
  [6]. Possible tension between these electron and muon neutrino results could provide a hint of the neutrino mass hierarchy at the 1 to
  level, although definitive discrimination would likely require 1% precision in both measurements.
The current generation of reactor  experiments will make additional measurements, beyond the oscillation parameters of
  and
and  . In particular, detailed comparison of the rates and energy spectra of reactor
  with models of the nuclear processes within the reactor will help us improve these models. The differences may also address the current observation of a 6% measured deficit in the flux relative to these models, called the 'reactor antineutrino anomaly' [22]. Detailed study of the rate and spectral deviations between the far and near detectors are sensitive to percent-level mixings to a hypothetical fourth neutrino state [71]. These measurements complement future planned measurements at very short distances (
 m) from reactors [6, 72]. Improvements in our understanding of the emission of
  from nuclear reactors, from both direct measurements and theoretical efforts, would elucidate these open questions.
7. Conclusion
As the most intense man-made source of antineutrinos, nuclear reactors have served an important role in neutrino physics. Reactors not only provided the first detection of this elusive particle, they also allowed measurement of four of the six parameters describing neutrino oscillation. The KamLAND measurement of reactor  provided the first distinct evidence of the particular disappearance and regeneration pattern from neutrino oscillation. Over the past two years, new reactor
  experiments (Double Chooz, RENO, Daya Bay) have measured the mixing angle
  . With all three neutrino mixing angles now measured, we are left with the theoretical puzzles of explaining this significant pattern of mixing, and describing why it is different from that observed for quarks. Knowledge of
  allows improved interpretation of current and future accelerator
  appearance measurements. New experiments to measure the neutrino mass hierarchy and possible CP-violation are now possible given the value of
  . The recent Daya Bay experiment spectral measurement provides the most precise example of oscillation disappearance and regeneration. The observed oscillation frequency has been used to determine the neutrino mass-squared difference
  , consistent with
  from
from  disappearance experiments. This precise agreement between measurements of
  reactor
  and
and  accelerator and atmospheric
  strongly supports the current three-flavor model of neutrino oscillation.
Acknowledgments
I would like to thank Cheng-Ju Lin, Herb Steiner, and Kam-Biu Luk for helpful comments during preparation of this manuscript. This work was supported under DOE OHEP DE-AC02-05CH11231.
Footnotes
- 1
While the most destructive of nuclear weapons can produce a
flux comparable to the annual emission by a commercial reactor, their use for fundamental antineutrino studies was only briefly considered in the early days of the atomic age. - 2
Measurements of muon neutrino disappearance also report an effective mass difference
. Relating this to the fundamental neutrino mass difference not only requires knowledge of the mass hierarchy, but also corrections for matter-enhanced oscillation effects. - 3
The same cavity was previously used by the Chooz experiment.


