


Abstract
The optical gradient force provides optomechanical interactions, for particle trapping and manipulation, as well as for near-field optical imaging in scanning probe microscopy. Based on recent spectroscopic experiments, its extension and use for a novel form of chemical scanning probe nano-imaging was proposed. Here, we provide the theoretical basis in terms of spectral behavior, resonant enhancement, and distance dependence of the optical gradient force from numerical simulations in a coupled nanoparticle model geometry. We predict an asymmetric line shape of the optical gradient force for molecular electronic or vibrational resonances, corresponding to the real part of the dielectric function of the sample materials. Yet the line shape can become symmetric and absorptive for collective polaritonic excitations. The corresponding magnitudes of the force range from fN to pN, respectively. The distance dependence scales considerably less steeply than simple point dipole model predictions due to multipole effects. The combination of these characteristics of the optical gradient force offers the chance to experimentally distinguish it from competing processes such as thermal expansion induced forces. In addition we provide a perspective for further resonant enhancement and control of optical forces.
Export citation and abstract BibTeX RIS
1. Introduction
The combination of scanning probe microscopy with optics offers optical spectroscopy with nanometer spatial resolution. Under light illumination, the induced coupled optical polarization between scanning probe and sample forms the basis of scanning near-field optical microscopy (SNOM) [1, 2], with the near-field signal typically detected by far-field scattering. The coupled optical polarization is expected to also give rise to an optical gradient force between the tip and the sample as illustrated in figure 1(a) [3, 4].

Figure 1. (a) Optical gradient force induced by excitation of coupled optical polarization between tip dipole ( ) and sample image dipole (
 ), with resulting force F
  . (b) The optical excitation is accompanied by absorption, with the resulting thermal expansion
  giving rise to a competing force reaction of the atomic force microscope tip.
Download figure:
Standard image High-resolution imageOptically induced forces, associated with gradient, scattering, and thermal expansion, have been studied in scanning probe microscopy for topographic and near-field optical imaging with a focus on the spatial dependence, as well as for particle trapping and manipulation [4–6]. In scanning probe microscopy, the optically induced forces, as competing factors to the van der Waals force, have been studied in the context of topographic artifacts in SNOM imaging [7–12]. Used as the signal of interest in itself, the nanomechanical detection of the optically induced forces has also enabled an alternative to photon detection for near-field optical imaging [3, 13–16]. In addition, a trapped particle as a probe was used for near-field optical or force mapping in photonic force microscopy [17–20]. However, despite several theoretical studies [4, 21–25], these works provided limited insight into the spectral characteristics of the optical gradient force and its dependence on electronic and vibrational material resonances of the sample. While the frequency dependence of the optically induced force is often explored in optical trapping of micro-/nanoparticles [5, 26–32], and in the optically induced mechanical response of plasmonic structures [33, 34], the extension for spectroscopic nano-imaging was not explored.
Recently, the concept of using the optical gradient force for scanning probe optical spectroscopy was proposed based on empirical experimental observations [35–37]. However, key questions on the spectral line shape of the force spectrum and its relation to conventional absorption spectroscopy have not been explored. In addition, experimental efforts on measuring the optical near-field gradient force have not been conclusive. For example, a force image of a metal bowtie antenna on resonance at  was interpreted to result from an optical gradient force [38]. In contrast, similar force images on gold split ring resonators were attributed to thermal expansion [39]. For molecular electronic as well as vibrational resonance spectroscopy symmetric absorptive spectral lineshapes were observed and attributed to the optical gradient force [35, 39, 41], in marked contrast to the predictions in this work of an asymmetric spectral response. In addition, a nearly instantaneous (few ps) response from ultrafast experiments [42] and polarization dependence in imaging plasmonic particles [43] showed characteristics of the expected optical gradient force behavior. However, both experiments lacked spectroscopic information which would be desirable for a unique assignment. The situation is equally confusing regarding theory. Most studies so far have treated both tip and sample as point dipoles [35, 40], even at close proximity where the dipole approximation fails, or only calculated the distance dependence of the force without considering its spectral response [44]. This leaves key questions open on the experimental feasibility and distinguishing spectral characteristics.
Here, we numerically calculate the optical gradient force between a scanning tip and different types of sample materials across their resonances. We predict the spectral behavior of the optical gradient force based on a coupled nanoparticle model geometry using Maxwell's stress tensor. In general, the real and imaginary part of the complex dielectric function ( ) across a resonance follow an asymmetric (dispersive) and a symmetric (absorptive) line shape, respectively. The spectroscopic response of the optical gradient force is found to give a dispersive line shape corresponding to the real part of the dielectric function for molecular electronic or vibrational and other single particle excitations, in contrast to recent experimental claims of gradient force nano-spectroscopy [35, 40]. We find that only polariton resonances can give rise to an absorptive spectral line shape. The effect is distinct from the accompanying thermal expansion due to optical absorption (figure 1(b)), which results in absorptive resonance spectra in all cases [45–47]. While the optical gradient force off-resonance is below the thermal cantilever noise limit of a room temperature atomic force microscope (AFM), we assess that in the cases of collective plasmonic and phonon polariton resonances the force in the pN range should be detectable in typical room temperature experiments. The optical gradient force for molecular electronic and vibrational resonances could also be detectable with improved force detection or under cryogenic conditions, as established in cavity optomechanics [48].
2. Numerical simulation
In this work, we numerically calculate the optical gradient force between the tip and sample using finite element electromagnetic simulation (COMSOL Multiphysics, RF and AC/DC Module). The time averaged force  on the illuminated tip is given by intergrating the Maxwell stress tensor
  as
as

with tip surface S and surface normal  . The components of the Maxwell stress tensor
  have the form of

where Ei is the ith component of the electric field, Bi is the ith component of the magnetic flux field. Under a plane wave incidence with vertical polarization, it is well known that the gradient components of the force dominate the vertical direction (along the tip axis), while the radiation pressure acts in the transverse direction [4, 22]. Thus only the gradient force, which is responsible for the tip–sample interaction in the vertical direction, is considered. Since the radius of the tip apex  is much smaller than the laser wavelength λ, the near-field tip and sample interaction under plane wave illumination can be analyzed in the quasistatic approximation by assuming the probe to be a polarizable sphere with radius r. The resulting field distribution on the sample can be effectively reduced to an image sphere of radius r, as shown in figure 1(a). This coupled nanoparticle geometry has been used extensively and with great success, predicting general behaviors accurate to within an order of magnitude [4, 5, 29]. While the exact geometry of tip and sample affects both the details of magnitude and spectral response of the optical gradient force [49, 50], especially for strong polaritonic resonances, the limiting case of two finite spheres provides enough general insight into the spectral variation of the force spectrum and its distance dependence.
Considering incident polarization along the tip axis, and rotational symmetry along the  -axis allows simulation in reduced dimensions to decrease the computational complexity. For the field simulation, a dense mesh with element size of 0.2 nm or less is applied near the spheres, and the distant surrounding is meshed with maximum element size of 20 nm. A uniform electric field
  V m−1 along the
  direction is applied. This electric field corresponds to an average laser intensity of
  as used under typical experiment conditions [35, 51].
We consider two types of resonant processes of the sample: i) molecular electronic and vibrational resonances, and ii) plasmonic resonances. The results are readily generalizable to samples with other types of resonances including phonons, excitons, and related polaritons. For the case of an electronic resonance, a sample consisting of Rhodamine 6G (R6G) dye molecules is modeled as a single harmonic oscillator for its dielectric function  , with transition energy of 2.42 eV, and line width of 0.41 eV, as a best fit to experimental results. A tungsten tip with
  is used to ensure a flat spectral response of the tip in the relevant visible spectral region. For the molecular vibrational resonance, a gold tip sphere is used to interact with a sample sphere (both with r = 10 nm) of poly(methyle methacrylate) (PMMA) with characteristic carbonyl resonance (C = O) at 1729 cm−1. Finally, to study the case of plasmonic resonance, two silver spheres of
  are modeled as the tip and sample system.
3. Results
Figure 2(a) shows the resulting force spectrum between the tungsten tip and R6G sample at a distance of  . The force spectrum follows the trend of the real part of the dielectric function
  shown in figure 2(b). The relatively small force variation between 23 fN to 25 fN across the resonance is due to the large broadband offset as a result of
  , which is a characteristic property of the dielectric function for molecular electronic resonances.
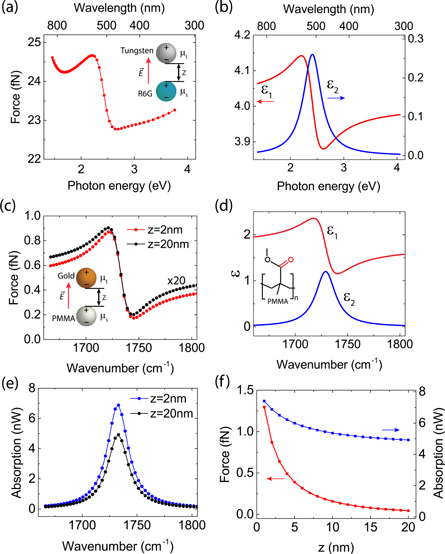
Figure 2. (a) Electronic resonant force spectrum between a tungsten tip and R6G sample (both of radius  nm) subject to an optical field
  V m−1, separated by
  nm. (b) Dielectric function of R6G
  modeled as a single harmonic oscillator. (c) Corresponding force spectra between a gold sphere and PMMA sample of radii
  nm. Dispersive force spectrum at separation distance
  nm (multiplied by 20, black) compared to force spectrum at
  nm (red). (d) Dielectric function of PMMA
  around the carbonyl resonance at 1729 cm
 . (e) Simulated PMMA absorption at distances
  nm (black) and
  nm (blue). (f) The distance dependence of the optical force (red) on resonance shows a complex distance scaling, neither following a simple dipole–dipole power law nor exponential scaling. The slight increase of optical absorption (blue) is due to local field enhancement in the gap region.
Download figure:
Standard image High-resolution imageCorrespondingly, figure 2(c) shows the force spectrum of the Au sphere interacting with the carbonyl vibrational resonance of PMMA at a separation of  (black). The force increases 20 times in magnitude to a peak value of
  fN when decreasing the distance to
  (red). Due to the smaller vibrational dipole moment compared to the electronic counterpart, the force is much weaker than the case of R6G but exhibits a larger relative spectral variation across the resonance from 0.2 fN to 1 fN (for z = 2 nm). Irrespective of distance, and similar to the electronic resonance case, the force spectra are dispersive and follow the real part of the dielectric function of PMMA
  (figure 2(d)). For comparison, figure 2(e) shows the absorption spectra at
  and
and  in black and blue, respectively. In contrast to the force spectra, the absorption spectra show the well known symmetric resonance behavior corresponding to the imaginary part of the dielectric function
  . Except for a change in magnitude, peak position and line shape of both optical gradient force and absorption spectra are invariant with respect to tip–sample distance. The distance dependence of the optical force on resonance (red) is shown in figure 2(f). Due to increasing multipole contributions with decreasing distance, the distance scaling follows neither a simple exponential nor power law, and is far more shallow than what one would expect based on a simple dipole–dipole interaction (
 ). The magnitude of absorption (blue) only increases slightly due to local field enhancement with decreasing distance.
Figure 3(a) shows the force spectrum of two silver spheres (r = 10 nm) separated by  for an applied optical field of
  m−1. The plasmonic resonant force spectrum with a slight asymmetry peaks at 3.5 eV with
  fN. For comparison, figure 3(b) shows the absorption spectrum for the two silver spheres. The normalized complex polarizability of a silver sphere
  is shown in the inset. As can be seen, both optical gradient force and absorption spectra follow the imaginary part of polarizability
  .
.
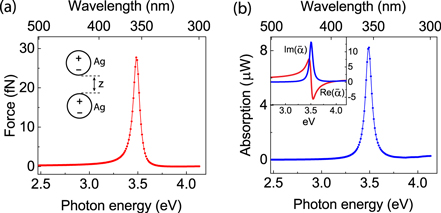
Figure 3. (a) Optical gradient force spectrum of two silver spheres with radius  nm separated by
  nm subject to external optical field
  V m−1. (b) Absorption spectrum of the two spheres with symmetric resonance at 3.5 eV. Inset: real and imaginary part of the normalized polarizability
  for a silver sphere. Force and absorption spectra follow the imaginary part of
  .
.
Download figure:
Standard image High-resolution imageFigure 4(a) shows the spectral evolution of the force as a function of distance. When the separation of the two spheres decreases from  to
to  , the optical gradient force increases by a factor of
  reaching
  pN. Correspondingly, the resonance frequency of the force spectrum red-shifts due to the plasmonic coupling between the two spheres [52]. In contrast, the magnitude of optical absorption does not change significantly with separation as shown in figure 4(b). The distance dependence of the optical gradient force on- (red) and off-resonance (blue) is plotted in figure 4(c). Both increase with decreasing distance approximately following a power law
  , with
  , i.e. again less steep than the point dipole
  dependence.

Figure 4. Simulated optical gradient force (a) and absorption (b) spectra for two silver spheres of  nm at different separations. The peak magnitude of optical force on resonance increases by a factor
  nm to
nm to  nm. Meanwhile the resonance of the force spectrum red shifts due to plasmonic coupling. In comparison, the magnitude of the corresponding absorption spectra has no significant distance dependence. (c) The optical gradient force, both on-resonance (red) and off-resonance (blue), follows a power law distance dependence on
  .
.
Download figure:
Standard image High-resolution image
4. Discussion
The different spectral behaviors of the optical gradient force can be rationalized based on the dipole–dipole interaction assuming two independently polarized spheres when  , with resulting force proportional to the polarizabilities of the tip
  and sample
  , [4],

with  . For typical metallic tips,
  because of the Drude response in the infrared with large values for real and imaginary part of the tip dielectric function [53]. Thus for a non-resonant tip with
  ,
,  , i.e., the force is proportional to
  in contrast to the result in [41]. This explains the asymmetric force spectra in figure 2 for a tungsten tip and a R6G sample in the visible, and a gold tip and a PMMA sample in the infrared. In general, a dispersive line shape is spectrally broader than an absorptive line shape, thus making the optical gradient force spectra extend more outside of resonance than corresponding absorption spectra. It is interesting to note that the optical gradient force can in principle also become repulsive for
  crossing zero. When tip and sample consist of the same material (e.g. silver), the force spectrum is proportional to the square of the polarization, i.e.
  , and is absorptive when
  crosses zero as for the case of two plasmonic silver spheres.
In the following we address the feasibility of measuring the optical gradient force and its distinction from thermal expansion. The sensitivity of force detection in AFM is limited by thermal fluctuations of the cantilever [54, 55]. The smallest detectable force is when the cantilever oscillation amplitude equals that induced by thermal noise given by

with Boltzmann's constant kB, temperature T, spring constant k, detection bandwidth B, and Q factor of the cantilever. The minimal detectable force gradient due to a change in sample–tip interaction operating in non-contact mode can also be derived as [54, 55]

with cantilever oscillation amplitude A0. Using typical values from force detection experiments [35–38, 47, 56], we get  pN (T = 300 K, k = 3 N m−1, B = 10 Hz,
  ,
,  ) and
) and  pN nm−1 (
 , T = 300 K, k = 3 N m−1, B = 10 Hz,
  ,
,  ). As shown in figure 4(c), the optical gradient force based on a plasmonic resonance can reach a few pN. Thus a plasmon resonance induced force should be detectable under typical laser intensities below the sample damage threshold. In contrast under the same laser power, force detection due to molecular electronic and vibrational resonances is two orders of magnitude below the detection limit of conventional room temperature AFM. Though larger forces can be achieved with higher laser power, potential sample damage limits practical laser power to below
  [11]. We can also compare the optical gradient force to the van der Waals force of a sphere-plane geometry, which has a
  distance dependence in comparison to the
  of optical gradient force at long distance [32, 57]. The optical gradient force is typically weaker than the van der Waals force at short distances, however, under plasmonic resonances the optical gradient force can exceed the van der Waals force [29, 32].
The effect due to thermal expansion  can be estimated based on
  [47]. Assuming a sample thickness of 10 nm, typical thermal expansion coefficients
  K−1, and a sample temperature increase of a few K after laser illumination [11, 47], we get a thermal expansion value of
  0.1—100 pm. When this expansion of the sample is modulated at a resonance frequency of the cantilever, the corresponding force becomes
  , where k is the cantilever spring constant of typically 3 N m−1, and
  100—200. The resulting force is in the range of
  pN—1 nN. Thus the thermal expansion effect can readily be measured with AFM as shown experimentally even down to monolayer sensitivity with a single chemical bond expansion of a few pm [47].
In previous attempts to detect the optical gradient force, a large force magnitude of  pN and an excellent agreement of the force spectrum with the far-field molecular absorption spectrum [35, 40] strongly suggest that the observed experimental results were in fact due to thermal expansion and not due to the optical gradient force as claimed. Optical gradient force detection has also been assigned to the force contrast on bowtie antennas reaching a few pN on resonance [37]. This assignment is feasible in principle according to our predictions. However, a force due to thermal expansion of similar magnitude is expected, leaving the underlying mechanism of the imaging contrast unclear.
In practice, the differences both in distance dependence and spectral frequency dependence of the optical gradient force and thermal expansion can be used to differentiate the two mechanisms. Notably, the optical gradient force is a longer range effect, determined by the spatial extent of the near-field of the tip apex, and thus follows a continuous change with distance as determined by the tip radius (figure 2(f) and figure 4(c)). In contrast, the force exerted on the tip through sample expansion requires a direct physical tip–sample contact, and should decay on even sub-nm distances above the sample, independent of tip radius.
A way to differentiate the two mechanisms in imaging plasmonic optical antennas is to map the spatial force distribution. The optical force is proportional to the local optical electric field, while the thermal expansion/absorption is due to resistive heating associated with electric currents. Thus distinct spatial maps result for the two different mechanisms since the current distribution peaks at the positions of minima in the electric field in optical antennas [58].
Fundamentally, the optical gradient force due to optical polarization and thermal expansion due to energy dissipation are two dynamic processes occurring on different time scales. This provides an additional opportunity for their distinction. Optical polarization with coherent excitation is induced nearly instantaneously in the fs to ps range, as determined by the spectral line width. In contrast, thermalization of an optical excitation underlying optical absorption leads to thermal expansion on ns time scales.
5. Conclusion and outlook
In summary, the dispersive line shape in probing electronic and vibrational material resonances as related to the real part of the dielectric function of the sample can serve as a distinguishing attribute in optical gradient force spectroscopy. Albeit weak with forces in the fN to pN range, their detection with advanced atomic force microscopy techniques can provide a novel form of optical scanning probe for nano-imaging and -spectroscopy. The magnitude of the force can be increased by exploring the resonance enhancement with a sharp gradient on resonance, such as slow light and electromagnetically induced transparency. The gradient force spectroscopy can also be expanded to nonlinear and coherent interaction with multiple light fields.
Compatible with a wide range of spectroscopies, including coherent and ultrafast techniques, optical gradient force spectroscopy can complement related all-optical scattering scanning near-field optical microscopy (s-SNOM). Our calculation provides guidance for the key parameters of strength, distance dependence, and spectral behavior for a simplified tip geometry, yet can readily be extended to specific tip geometries and other optical processes, including inelastic, e.g. Raman, as well as nonlinear excitations.
Acknowledgments
Funding from the National Science Foundation (NSF Grant CHE 1306398) and AFOSR (grant FA9550-14-1-0376) is gratefully acknowledged. We thank M A Belkin, H K Wickramasinghe, and A Belyanin for valuable discussions.