


Abstract
Broadband amplification employing stimulated Raman backscattering is demonstrated. Using seed pulses with a bandwidth of about 200 nm, we study the amplification in a wide spectral range in a single laser shot. With chirped pump pulses and a Ne gas jet, we observed under optimized conditions, amplification in a range of about 80 nm, which is sufficient to support the amplification of sub-20 fs pulses. This broad amplification range is also in excellent agreement with PIC simulations. The conversion efficiency is at certain wavelengths as high as 1.2% and was measured to be better than 6 × 10⁻³ on average.

Original content from this work may be used under the terms of the Creative Commons Attribution 3.0 licence. Any further distribution of this work must maintain attribution to the author(s) and the title of the work, journal citation and DOI.
1. Introduction
State of the art high power laser systems rely either on chirped pulse amplification (CPA) in solid state laser media [1] or optical parametric chirped pulse amplification [2] in nonlinear crystals. These systems find a wide range of applications in laser plasma particle accelerators [3], x-ray lasers [4], laser ignition for fusion experiments [5] and studies of ultra-short atomic and molecular processes [6].
For CPA, the laser pulses are stretched prior to amplification to keep the intensity below the optical damage thresholds of the amplifying crystals and the compression gratings. For the latter, the damage threshold intensity is on the order of 1012 W cm−2, while the crystals can sustain intensities only in the order of a few GW cm−2 [7]. Despite these limitations of state of the art CPA based laser systems, peak intensities of about 1022 W cm−2 [8] can be reached. However, for achieving higher intensities, the temporal stretching cannot be substantially increased, so the dielectric compression gratings and the amplification media have to become larger, making them very expensive if technically possible at all.
Plasma-based amplification schemes aim to achieve pulse amplification and compression in plasma and in this way circumvent the limitations set by the damage threshold. In these scenarios, the energy of a long pump pulse is transferred into a counter-propagating ultra-short seed pulse via the plasma wave. The plasma wave, driven by the ponderomotive beat of pump and seed beam can either be an electron Langmuir wave (stimulated Raman backscattering, SRBS) [9] or an ion wave (stimulated Brillouin backscattering, SBBS) [10]. In the present work, we present results on SRBS driven amplification. In order to resonantly drive an electron plasma wave to scatter the pump off, the frequency of the ponderomotive beat of pump and seed has to match the Langmuir frequency . Here and are the frequencies of pump and seed, respectively, vthe the thermal electron velocity, k the wave-number of the plasma wave and the electron plasma frequency where e is the electric charge, me the electron mass and the vacuum permittivity. For counter-propagating beams the wave vector k of the plasma wave is given by , where are the wave-numbers of pump and seed, respectively. Raman scattering only occurs for electron densities , where is the critical density. If the product of wave vector and Debye length fulfills , Landau damping can be neglected.


In the past, SRBS amplification was studied using (sub-)picosecond seed pulses [11–13]. Under optimized conditions, it was also possible to reach the nonlinear pump depletion regime [11, 14], where the seed pulse extracts a substantial amount of energy from the pump pulse. So far the most successful experiment reports an increase of the seed energy from 16 μJ to 5.6 mJ accompanied with a pulse compression down to 50 fs [15].
Another class of experiments in a different parameter range draw on highly chirped femtosecond laser pulses for the pump and lower plasma densities [16]. However, for this parameter range the best numbers for the conversion efficiency obtained with simulation do not agree with the experimental results. Additionally the experiments suffer from simultaneously occurring plasma effects like particle trapping [17] and ion acoustic waves originating from the Langmuir decay instability [18]. Besides particle trapping and wave-breaking, most of the additional unwanted effects appear mainly in low plasma density configurations, where the coupling between density fluctuations at and is expected to lead to a saturation of SRBS [19] amplification.


In this article we report on SRBS amplification of femtosecond seed laser pulses pumped by chirped sub-picosecond pulses. With this setup, we have identified the parameter range where we were able to measure broadband amplification. The manuscript is organized as follows. In section 2 we give a short theoretical summary. Subsequently, section 3 discusses the ionization of the neutral gas-jet by the pump pulse. The ionization profile is used to calculate the conversion efficiency and select the best parameter range for our broadband amplification scheme. The measured results are then presented in section 4. The paper is concluded by a short summary of the main results.
2. Theory
We consider two exactly counter-propagating laser pulses of frequency and wavenumber () and (), respectively. In the region of spatial overlap the fields of the pulses will beat with frequency and wavenumber . If this beat is in resonance with the electron Langmuir frequency, i.e. , the ponderomotive force associated to the beat will resonantly drive a electron density modulation, off which subsequently the pump is backscattered into the seed.


The time-scale on which the electron density modulation grows is determined by the inverse of the growth rate γ, which can be obtained from the complex solution to the dispersion relation ([20], equation (7.21))


In the weak coupling regime the linear growth rate of SRBS is given by . The two main parameters here are the plasma electron density ne and the dimensionless amplitude of the pump vector potential. Here IP is the pump intensity and the pump wavelength, the normalized seed amplitude aS is defined accordingly. The maximum growth rate is obtained for , but also slightly off-resonant waves are amplified, however, with a reduced growth rate. The total bandwidth over which growth is predicted is , centered around kR. Seed pulses which have a spectrum broader than will be amplified in the linear phase, however at first they will be stretched, since only the resonant part of their spectrum is amplified [21].

![${a}_{{\rm{P}}}\approx \sqrt{7.32\times {10}^{-19}{\lambda }_{{\rm{P}}}^{2}[\mu {\rm{m}}]{I}_{{\rm{P}}}[{\rm{W}}\,{\mathrm{cm}}^{-2}]}$](https://content.cld.iop.org/journals/1367-2630/18/7/073048/revision1/njpaa319eieqn23.gif)


To minimize dispersion inside the plasma and limit the growth time of competing instabilities, the region where spatial overlap is realized should be limited. It is favorable to maximize γ in order to drive the density grating as quickly as possible. However, increasing the pump amplitude aP beyond results in wave-breaking of the plasma wave, which will deteriorate the energy transfer from pump into seed [9, 22]. Increasing on the other hand the plasma density ne goes along with the increased risk of spontaneous backscattering triggered by density modulations from noise. Chirping of the pump pulse or introducing a density gradient can help to mitigate spontaneous backscattering since the resonant frequency ω is constantly detuned [23, 24]. Experimentally, often both detuning features are present at the same time, but of varying importance. The picosecond pump pulse is typically chirped since it is obtained from a short pulse laser system. The plasma density on the other hand can be inhomogeneous, in particular for gas-jet targets. Different ionization levels of the gas species may introduce a further inhomogeneity of the plasma density. Since the Raman wavelength depends on the plasma density, plasma inhomogeneities open up the possibility of broadband amplification.

Once the seed amplitude aS is of the same order as the pump amplitude aP, the depletion of the pump can no longer be neglected. The nonlinear interaction between pump, seed and plasma wave can be described by three-wave envelope models (assuming the absence of kinetic effects, e.g. wave-breaking) [9]. Even though the seed amplitude is larger than the pump amplitude, the net flow of energy from pump to seed is still upheld. The evolution of the seed envelope asymptotically takes place in a self-similar way [9]. The maximum seed amplitude grows proportional to the propagation distance of the seed inside the pump, at the same time the seed contracts in longitudinal direction. This nonlinear stage of the interaction also goes along with a spectral broadening of the seed.
3. Methods
In the presented experiment, the 30 fs long output pulse from a 40 TW Ti:sapphire laser system at 800 nm central wavelength is chirped and split into pump and seed pulse. The seed pulse is focused into a gas filled hollow core fiber for spectral broadening [25]. The output spectrum has its maximum at 840 nm, and a substantial part of the total energy of (120 ± 20) μJ can be found in a range of 600–920 nm. At the exit of the fiber a set of chirped mirrors compresses the pulses down to (5.9 ± 0.4) fs [26] under optimized conditions. However, in this experiment the pulses were not compressed to their bandwidth limit due to additional dispersion in the experimental setup. Nevertheless, seed intensities of 1013 W cm−2 are reached by focusing the pulse with a f/12 off axis parabolic mirror. All spectra are spatially integrated and measured with a fiber coupled spectrometer (OceanOptics USB 4000). With a 100 μm fiber entrance the focal spot of the amplified beam can not be significantly larger than the 20 μm focus of the initial seed beam.
As shown in figure 1, pump and seed beams are crossing under an angle of 120 mrad, to separate the pump beam from the amplified seed beam and to avoid damage to the amplifier chains by the transmitted beams. Further spontaneous Raman background signal is spatially filtered as spontaneous scattering at this angle is inefficient. The 60 nm FWHM wide pump pulses (∼25 fs at best compression) are stretched to 600 fs by detuning the separation of the gratings in the compressor. The 500 mJ pump pulses are focused with a f/11 spherical mirror to a spot size of 20 μm, corresponding to a peak intensity of 1016 W cm−2. The spatial overlap in the focal region is checked by observing the scattered light from a 20 μm thick tungsten wire. The temporal overlap is monitored by side view imaging of the plasma channel of probe and pump with a part of the seed beam as shown in figure 1. The spatial overlap region is about 400 μm long.


Figure 1. Experimental setup in the JETI vacuum chamber. The seed and side view beam paths passed additionally delay lines which is not shown here. The seed pulses are spectrally broadened in a gas filled hollow core fiber and subsequently compressed before they enter the setup as shown on the right.
Download figure:
Standard image High-resolution imageThe plasma is generated in a pulsed neon gas jet. In order to determine the redshift of the backscattered signal the neutral gas density of the jet was characterized employing a 3D tomographic reconstruction method [27]. The density profile resembles a top-hat function with a length of 1mm and density variations below 5% of the plateau value. The ionization rate [28] can be calculated with the atomic parameters for neon [29–31]. Subsequently the fraction of ionized atoms is calculated with the actual temporal pulse profile derived from a third order autocorrelation measurement. Knowing the neutral gas density, it is then possible to calculate the temporal evolution of the plasma density ne(t). The results of this calculation are summarized in figure 2. As ionization is highly nonlinear dependent on laser intensity, as soon as the necessary intensity is reached the energy level is fully ionized within a few laser cycles. This process reaches saturation as soon as the laser intensity is not any more sufficient for the next level and shows density plateaus in the time representation.

Figure 2. From the 3rd order autocorrelation of the chirped pump pulse the measured pulse duration is 600 fs. The pulse intensity is above the ionization threshold over a range of about 3 ps. The ionization fraction of the later presented PIC simulation are shown for comparison.
Download figure:
Standard image High-resolution image4. Results
In our setup we changed the backing pressure of our pulsed gas jet from 1 to up to 11 bars corresponding to neutral gas densities of 8 × 1018 cm−3. We scanned the density of ne between 5 × 10⁻⁵ to 0.009 nc, as well as pump intensities from 1012 to 1016 W cm−2. Above we observed a substantial enhancement of the signal. For densities around ne = 0.002 nc (ne = cm−3) and pump intensities of a few times 1015 W cm2 the highest gain has been achieved. Further increasing of the density above ne = 0.003 nc resulted in in a degradation of the beam and a reduced amplified signal. A similar effect occurs when scanning the temporal delay between the pump and seed pulses. As the delay is changed, the interaction between pump and seed pulse takes place at another position inside the gas jet and thus at a different plasma density. Whereas at times where the seed arrives early a very low amplification can be measured, at later times the signal is completely suppressed by scattering and defocusing in the plasma. In the experiment, we were only able to measure a signal in a delay range of ± 500 fs around the setting for the maximum gain.


A comparison of the the reference spectrum with the measured amplified seed spectrum indicates amplification in the range from 785 to 910 nm for ne = 0.002 nc and peak intensities of up to 1016 W cm−2. The truncation of the long wavelength part of the spectrum also coincides with the fiber broadened seed beam. The small signal gain is ( with ). According to equation (1), for a cold plasma formed from singly ionized neon the necessary redshift for amplification of the seed pulses should be in the order of 35 nm for a pump wavelength of 800 nm which is consistent with the central wavelength of our seed beam. Under these conditions the conversion efficiency of the whole pulse can be calculated to be .


We carried out one-dimensional particle-in-cell (PIC) simulations using the EPOCH code [32] with the goal to model the process as precisely as possible. In the simulations the pump pulse enters a slab of neutral Ne gas which is then ionized by the pulse; the ionization is self-consistently handled by the EPOCH code. Subsequently, the seed, injected from the opposite side of the simulation box, interacts with the pump inside the created plasma and is amplified. From the simulations we then obtain two pieces of information. First, we extract the plasma density profile at the front of the pump pulse. This allows us to validate the ionization results obtained by the PPT ionization code. Second, while the seed propagates in the plasma and undergoes amplification, we can reconstruct the seed spectrum. For this we need to separate the electric and magnetic fields into left and right propagating parts, which is strictly only possible in vacuum. The temporal evolution of the seed spectrum will give insight into the dynamics behind the amplification mechanism. At the end of the simulation, the seed has left the plasma and we then can compare the seed spectrum from the simulation to the experiment.
Before discussing the results, let us describe the details of the simulation setup. The total length of the simulation domain is 1000 μm. Centered in the box is a 800 μm slab of initially neutral Ne gas of density cm−3, which for singly ionized Ne would result in an electron density of 0.001 nc for a laser wavelength with 800 nm. The box is longer than the spatial overlap in the experiment. However with the temporal evolution presented in figure 3 no significant changes in the spectrum appear after 0.5 ps which was also experimentally observed in a separate delay scan. The simulation grid has 90 000 cells, i.e. 36 cells/. We use 500 particles per cell for ions and electrons. The initial pump pulse amplitude is constructed from a sum of (super-) Gaussians with different amplitudes (and exponents) such, that the resulting intensity profile matches that of the measurement shown in figure 2 in the time interval of −1 to 1 ps. The maximum intensity variation between measured pulse and our fit is 20% and less than 10% on average. Since experimentally the pump pulse is obtained by chirping a short pulse, we introduce a quadratic phase to the pump. The amount of chirp is adjusted such, that a 30 fs FHWM bandwidth-limited Gaussian pulse would be stretched to 400 fs FWHM, corresponding to the FWHM pump duration. The central wavelength of the pump is at 800 nm. The seed pulse in the simulation is a superposition of two Gaussian pulses, inspired by the experimental seed spectrum (gray line, figure 3). The first pulse has a spectral width of 5 nm and a central wavelength of 837 nm. The second pulse has 9 nm bandwidth and is centered around 856 nm. Both pulses reach their maximum intensity at the same time. The total intensity of the seed is 1013 W cm−2, evenly split between the two individual pulses. The resulting pulse duration of 55 fs is longer than in the experiment where broad spectral wings with low spectral energy density shorten the seed pulse further. Both, seed and pump, pulses are linearly polarized along the y direction. The longitudinal coordinate is x and the pump propagates from right to left. The timing of both pulses is such that interaction between pump and seed will take place completely inside the plasma.


Figure 3. Comparison of measured spectra with results from a PIC simulation. The temporal evolution of the seed during amplification in the simulation (upper plot) is compared with the final spectra from the measurement (lower part). Significant amplification is observed within 100 fs. The central part of the spectrum at 835 nm is well reproduced by the simulation. Amplified spectrum and simulation show oscillations at the edges of the spectrum. Comparison with the reference spectrum shows no amplification below 785 nm. The 1/10 bandwidth is approximately 80 nm. The vertical dashed line represents the central Raman wavelength at 800 nm for and =800 nm. White horizontal lines indicate growth regions discussed in section 4. The shading in the upper plot (below 820 nm) marks the region where it is not possible to strictly separate pump from seed spectrum in the simulation.


Download figure:
Standard image High-resolution imageLet us now discuss the results we obtain from the simulation. We begin with the electron density profile induced by the pump, see black line in figure 2. About 0.7 ps before the maximum of the pump pulse, ionization of the neutral Ne starts to occur. From there on the pulse intensity increases and so does the electron density. We find two more distinct jumps in n due to Ne being ionized to the second and third level, eventually leading to about n = 0.003 nc around 100 fs before the pump pulse maximum. Only a small fraction of Ne3+ is then further ionized to Ne4+. When we compare the ionization dynamics from the PIC simulation to the results of the PPT calculation we find that the agreement is overall fair. Close to the high intensity central part of the pump the agreement is quite good, while in the lower intensity part of the pump differences are seen. In our case in particular the length of the plateau for the second ionization stage is much shorter in the PIC simulation than suggested by the PPT based calculation. A reason for this could be a steepening of the pulse front as coupling of pump and plasma are not considered in the PPT calculation.
To analyze how the seed spectrum is modified during the amplification we calculate the quantities . The electric field corresponds to the electric field of the seed, propagating along the negative x direction. This decomposition in left () and right () propagating field is not completely accurate inside the plasma, but since the plasma density is small, this approximation is expected to be very good. The Fourier-transform of the seed field is shown in figure 3. In order to analyze what leads to growth of the spectrum, we shortly summarize the evolution of the two most crucial parameters, density and pump intensity, that the seed experiences during the interaction. At time t = 0 pump and seed pulse begin to overlap in a region with non-zero electron density. Between t = 0.2 ps and t = 0.3 ps (phase I) the seed moves in an almost constant plasma density of n = 0.001 nc, the pump intensity is about 1015 W cm−2. During the time t = 0.3 ps to t = 0.4 ps (phase II) the plasma density rises from 0.001 nc to 0.003 nc and the pump intensity grows from to 1016 W cm−2. From t = 0.4 ps on the pulse propagates in a density of 0.003 nc and experiences a pump intensity of greater than W cm−2 for around 100 fs (phase III). Afterwards, the pump intensity decays and the seed growth comes to a halt (phase IV).


Even though the amplification dynamics is affected by very transient changes in density and intensity, linear plane wave backscattering theory can be used to obtain a semi-analytical understanding. To this end, we numerically solve the Raman backscattering dispersion relation for typical parameters of the phases I–IV. In this way we obtain the expected growth rates and seed wavelengths which can be amplified by the Raman process, see figure 4. In phase I the growth rate is of the order and wavelengths in the region between 821 nm to 830 nm could be pumped. Since fs, we cannot expect substantial growth during this phase. In phase II we may use a density of and a pump intensity of W cm−2, leading to fs. The unstable spectrum now covers 824 nm to 850 nm. In this phase we eventually start to observe first growth of the seed spectrum, mostly close to the center of the unstable wavenumber range, where the growth rate is largest. Eventually, in phase III we find the most rapid growth of the seed. The seed is now inside the central part of the pump and experiences for around 100 fs a pump intensity greater than 1016 W cm−2. Here, fs (at 845 nm) and the unstable wavelength regime is between 825 and 866 nm. The rapid growth of the spectral components close to 845 nm we observe in figure 3 is consistent with this estimate. Starting with the beginning of phase III we observe wave-breaking and particle trapping. Figure 5 shows the longitudinal electron phase-space at the front of the seed pulse (figure 5(a)) and at the maximum of the seed (figure 5(b)). Although the pump amplitude is much larger than the wave-breaking amplitude the wave does not break instantly and energy can still be transfered into the seed, in particular at the front. In phase IV, at times larger than 0.5 ps, the seed is in the backside of the pump pulse and we do not see any further amplification. The beat of the pulses still drives a plasma wave that breaks, but the efficiency of the energy transfer seems to drop.


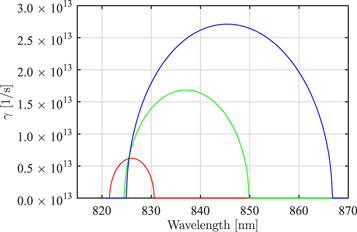
Figure 4. Growth rate obtained by numerical solution of the Raman dispersion relation. Parameters for the curves are: (a) W cm−2, n = 0.001 nc (red line), (b) W cm−2, n = 0.002 nc (green line), (c) W cm−2, n = 0.003 nc (blue line).


Download figure:
Standard image High-resolution image
Figure 5. Electron phase space vx versus x at t = 0.46 ps at the front of the seed (a) and the position of the seed maximum (b).
Download figure:
Standard image High-resolution imageThe spectral phase of the seed pulse is readily available from the simulations. While we see an influence of the final seed phase on the input phase of the seed, overall phase distortion is small at low initial phase distortions. Overall the seed phase remains rather flat, i.e. we expect no substantial increase of the final seed duration due to phase distortions.
Combining information from measurement and simulation allows for a more precise picture of the conversion efficiency. The position where pump and seed pulses are overlapping in time can be deduced from the redshift of the measured spectrum as each ionization level provides only a limited interaction time and only a fraction of the pump pulse interacts with the reflecting plasma wave. In this case figure 3 shows a 100 fs long growth where a fraction of of the total pump energy interacts with the seed pulse. The average conversion efficiency in this interaction region is . After this the spectral width starts to decrease again which necessitates spatial extraction by an overlap angle or spectral clipping in the grating compressor of the pump pulse if the pulse has a high bandwidth and is strongly chirped. On the other hand a hard clip of the neutral gas density by a shock wave would limit the plasma interaction to ideal parameters.


5. Discussion
In the short distance of 400 μm, amplification from 120 μJ to 410 μJ was reached for a bandwidth of 80 nm. The total spectral range over which amplification was observed is determined to be 785 to 910 nm for a Ti:sapphire laser system. The corresponding transform limited pulse duration is 16.7 fs. As the results of the PIC simulation and the experiment show good agreement, a detailed analysis of the temporal evolution of the broadband seed was discussed. Analysis of the temporal phase in the simulation shows no significant increase of chirp in the plasma and therefor a constant pulse duration.
While previous work [16] shows high bandwidth amplification (∼30 nm) with a flat response function and an average spectral efficiency of 1%–5% our scheme extends the accessible amplification bandwidth strongly by adding inhomogeneous electron densities. The experiment also shows that comparatively short pulse durations can access a range of conversion efficiency previously only reached with very long interaction lengths allowing to preserve the pulse duration of the seed. The resulting pulse can reach a three times higher peak intensity compared to previous works. While the conversion efficiency is similar to other works with Ti:sapphire systems, chirp and density gradient schemes can increase the available peak intensity of SRBS processes by an order of magnitude. While typical Nd:glass systems can not use strongly chirped pulses because of their limited bandwidth in the few nanometer range, inhomogeneous density profiles can increase the available bandwidth and subsequently offer SRBS as viable option for pulse shortening of ps-systems.
The bandwidth of our amplified seed changes strongly depending on the temporal overlap with the pump. We see further scaling potential if the pump amplitude is reduced to a few times 1015 W cm−2 and the onset of wave breaking can be delayed allowing for longer energy extraction from the pump and less energy transfer to the pump after wave breaking occurs. This is also critical as wave breaking decreases the bandwidth (see figure 3). While we experimentally observe saturation of conversion efficiency if the initial neutral density is increased, a balance of lower intensity and higher plasma density can be found. This would also allow higher growth rates which is critical for a short interaction scheme.
Introducing an external broadband seed to big laser facilities, this scheme should enable high energy sub-picosecond class laser systems to be converted into a sub-20 fs pulse with similar peak intensity. This would be a big step towards sub-20 fs Raman amplifier proposed by Tajima and Mourou [33]. Further studies are necessary to minimize or intrinsically prevent acquisition of group delay dispersion during the interaction time at intermediate interaction lengths which offer higher conversion efficiencies than in our case.
PIC simulations have shown that the modeling of the theoretical pulse shape in relation to the experimental seed spectrum is important for accurate simulation results. We presented self-consistent simulation results which are in accordance to the PPT ionization rate with the autocorrelation measurement of the pump pulse as input. Further we were able to measure the parameter limits of the interaction region, given by the onset of wave-breaking.
6. Conclusion
We measured a parameter window of plasma density and intensity where the spectrum of a sub 20 fs can be amplified by SRBS. Experimental results are in good accordance with PIC simulations. As most recent experiments rely on a small bandwidth seed this study expands the scope by showing that the discussion on SRBS efficiency should also strongly include intensity considerations of the amplified pulse. To compress amplified pulses, a spatial light modulator can be installed prior to the plasma interaction as the reflection is strongly phase dependent. Dispersion can also be compensated by a plasma gradient originating from ionization of the pump pulse or the neutral gas density. However proposed solutions like the tilt of a gas target suffer of inhomogeneities in the neutral density profile of gas nozzles and ionization gradients from short interaction lengths. One possible solution would be the introduction of complex non-rotation symmetric gas targets. Our study extends the scope of scanned density and intensity parameters for SRBS with Ti:sapphire systems at 800 nm. We show that relatively short [16] laser pulses can be used to efficiently amplify ultra-short seed pulses while reaching comparable conversion efficiency. The presented setup has also the advantage that competing instabilities lack time to develop to subsequently disturb the amplification process.
Acknowledgments
We thank B Beleites, F Ronneberger and W Ziegler for technical support in the experiment. We also thank to D Kartashov for providing a code to calculate ionization rates. We acknowledge support from HGShire/European Regional Development Fund (EFRE)/state of Thuringia (TMBWK) under Grant No. B 715-08008/TR, DFG TR 18, PHELIX and Helmholtz Institute Jena. GL acknowledges computing time granted by the John von Neumann Institute for Computing (NIC) and provided on the supercomputers JUROPA and JURECA at Jülich Supercomputing Centre (JSC). Development of the EPOCH code was in part funded by the UK EPSRC grants EP/G054950/1, EP/G056803/1, EP/G055165/1 and EP/M022463/1.