


Abstract
We introduce a novel method for direct and accurate measurement of refractive index dispersion based on carrier-envelope phase detection of few-cycle laser pulses, exploiting the difference between phase and group velocity in a dispersive medium. In a layout similar to an interferometer, two carrier-envelope phasemeters are capable of measuring the dispersion of a transparent or reflective sample, where one phasemeter serves as the reference and the other records the influence of the sample. Here we report on proof-of-principle measurements that already reach relative uncertainties of a few 10−4. Further development is expected to allow for unprecedented precision.

Original content from this work may be used under the terms of the Creative Commons Attribution 3.0 licence. Any further distribution of this work must maintain attribution to the author(s) and the title of the work, journal citation and DOI.
1. Introduction
The refractive index and its variation with wavelength, dispersion, play a pivotal role in optics and photonics. Both are fundamental properties of optical glasses and therefore need to be known to great precision and accuracy for the design of high-quality optical instrumentation. For the measurement of glass melts, i.e. when samples can be prepared, the v-block method or the spectral goniometric method can be used. The latter can provide measurement accuracies to the 10−6 level for of the refractive index and the dispersion [1].
For optical fibers, the precise value of the refractive index is often of much lesser importance than its dispersion. (Higher-order) dispersion causes pulse broadening and can thus be a severe limitation for the data rates. The above-mentioned measurement techniques are obviously not suitable for testing fibers. In cases, where dispersion compensation is required, it may even be necessary to measure the dispersion in a fiber system. A respective standard measurement approach is the modulation phase-shift method [2] and variations thereof.
Other approaches, typically used for shorter or entirely different samples (liquid or gaseous material for example), include Sagnac-, Mach-Zehnder-, and Michelson-type interferometers, see, e.g., [3, 4]. Interferometric methods are often used as white-light interferometers in order to measure the wavelength-dependent phase shift of a sample inserted into one of the interferometer arms [5]. The refractive index is then retrieved e.g. by applying a Fourier transform algorithm to the measured interferograms [6]. Numerical differentiation of the result then yields the power series coefficients corresponding to the different orders of chromatic dispersion of the refractive index [7]. Such methods therefore have to be considered indirect with respect to obtaining the chromatic dispersion of the sample. Furthermore, repeated numerical differentiation is prone to noise and decreases the precision of the result for each order of the power series.
Other challenges for dispersion measurement include time-dependent phenomena. A very recent development introducing a layer of novel aspects is the measurement and control of the time-dependence of the nonlinear optical susceptibility on the sub-cycle time-scale, see e.g. [8, 9].
Here, we present a new approach to measure first-order dispersion coefficients of transparent media. It is novel insofar as (i) dispersion is measured in a direct way, (ii) it enables ultrafast time resolution (although not used in the present paper), and (iii) it is based on the dependence of the so-called carrier-envelope phase (CEP) [10] of a few-cycle laser pulse on the difference between phase and group velocity in dispersive materials. This CEP changes upon propagation of the light pulse in linear media. In first-order approximation, this change can be described by


where denotes the carrier frequency of the laser radiation, L is the thickness of the medium, vg and vp are the group and phase velocity of the laser pulse. Since vg is a function of the derivative of the refractive index, a measurement of the CEP yields information about the dispersive properties of a medium. The experimental scheme for direct dispersion measurement resembles one half of a Mach-Zehnder interferometer (see figure 1), where the recombination of both beams is replaced by directly measuring the CE phase—on first glance an 'interferometer without interference'. However, there is a distinctive difference: The instrument is not sensitive on the optical path length but directly on the dispersion as shown below.

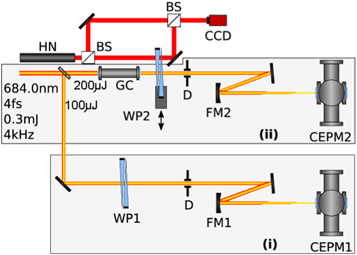
Figure 1. Experimental setup. BS: Beamsplitter, GC: gas cell, WP1/2: glass wedge pair, D: iris diaphragm, FM1/2: focusing mirrors (f = 25 cm), CEPM1/2: carrier-envelope phasemeters, HN: helium-neon laser, CCD: camera. (i) Reference arm and (ii) sample arm. Both CEPMs are connected to a PC with fast digitizers for real-time data acquisition and evaluation.
Download figure:
Standard image High-resolution imageThere are several methods to measure the CEP (or changes/differences thereof), such as interferometers [11, 12], high-harmonic generation [13], terahertz-emission spectroscopy [14], spectral interferometery [15] or stereo above-threshold ionization (ATI) phasemeters [16], CEPMs for short. The CEPM's capability of directly measuring the CEP of a laser pulse without interference with a reference beam removes the requirement for recombination of the reference and sample arm beams. This simplifies the setup and allows the sample and reference arms to be measured separately using stereo-ATI CEPMs. Here, we demonstrate the method by measuring the dispersion of various gases.

2. Experimental setup
Stereo-ATI CEPMs are routinely used to determine the relative CEP of intense (≈1013 W cm–2) few-cycle laser pulses with a precision of mrad for single laser shots. The few-cycle laser pulses are generated with a commercial Ti:Sapphire laser system (Femtolasers Femtopower compact PRO CEP) by spectral broadening in a Ne-filled hollow-core fiber and subsequent recompression using broadband chirped mirrors. Our system routinely delivers 4–5 fs pulses.

As shown in figure 1, the few-cycle laser pulse is split with a 30/70-ultrabroadband beamsplitter. The odd splitting ratio allows for compensation of the Fresnel reflection losses at the sample gas cell windows. Both pulse copies are then sent to different CEPMs, with approximately equal distances from the beamsplitter. Additional glass wedges in each arm are present to fine-tune the chirp of both pulses. One wedge in the sample arm is mounted on a precision linear stage for calibration purposes. During the actual measurement the wedges remain fixed.
The stronger pulse has to pass through the sample, for the present work an cm long gas cell. It is a standard KF vacuum cross with two thin windows on two opposing sides and the pressure gauge (including leak valve) and the vacuum pump on the two remaining ports. The gas cell can be filled with different noble gases or ambient air at pressures ranging from . The CEPMs then measure the CE phases of the two laser pulse copies and their difference . It should be noted that even for a CE phase fluctuating randomly shot by shot, the difference of the phases measured in both arms remains constant for a given sample, i.e. for constant gas pressure in the present case. Therefore, the precision of the measurement can be very significantly improved by averaging the CE phase differences of multiple laser shots.


In order to obtain the first order dispersion coefficient, we rewrite equation (1) in terms of the refractive index:

We also consider a (linear) dependence of the refractive index n on the pressure p in accordance with the Lorentz-Lorenz law for a dilute gas at low pressure. Note that knowledge of the central frequency (wavelength) () of the few-cycle pulse used is required. This can either be determined by a full temporal characterization of the laser pulse (using standard techniques such as FROG, SPIDER etc) or by calibrating the setup against a well-known reference material. We chose the latter method, because the former requires knowledge of the pulse properties within the CEPMs, where access is difficult due to spatial constraints. A simple determination of the spectral center of mass is not sufficient, as it contains no information on the spectral phase. Only for pulses very close to the bandwidth limit one could obtain correct results when using the spectrum only.


3. Calibration and results
To evaluate the overall precision of the setup, we first determined the single-shot precision of our setup under ambient lab conditions with the gas cell valve opened for 20 min, recording million laser shots. Shown in figure 2(a) is the distribution of the measured CEP difference between the CEPMs. The single-shot precision is found to be 223 mrad, twice the value for a single CEPM [17]. Calibration was done by altering the amount of glass within the beam path in the sample arm. A collinear reference helium-neon laser is used for an interferometric measurement of the corresponding glass thickness change. The resulting phase difference was recorded and from the well-known dispersion relation of the glass (fused silica HOMOSIL 101) [18], the central wavelength of the pulse was found to be nm (see figure 2(b)). In order to measure the dispersion of different gases, we started with an evacuated cell and then opened the valve slightly such that the noble gas pressure inside the cell increases very slowly. After reaching the maximum value (2 bars for less dispersive, 1 bar for more dispersive gases), the valve is closed again and the cell is evacuated very slowly, thus yielding two measurements for a single gas. While the pressure is changing, both the CEP difference and the gas pressure are continuously recorded.


Figure 2. (a) Distribution of measured CEP differences between the two CEPMs without user interference. The single shot precision of the setup is 223 mrad. (b) Calibration with fused silica (HOMOSIL 101) wedges. The measured slope of −0.15096 rad μm–1 corresponds to a central wavelength nm of the few-cycle laser pulse.

Download figure:
Standard image High-resolution imageFor transparent media at low pressures, the refractive index is directly proportional to the gas pressure and all dispersive properties are proportional to p according to the Lorentz-Lorenz law. Figure 3 shows the resulting CEP shift versus the gas pressure for all measured noble gases and ambient air. A numerical linear fit to these curves then yields the slope, from which the first-order dispersion can be calculated via equation (2). For comparison with existing data, we calculate the corresponding value using the Sellmeier equations in [19, 20] with and T = 293 K. The comparison is shown in table 1. As seen, we find significant deviations between this work and earlier works but also between published data. Some of the deviation may be due to extrapolations as discussed in the caption of table 1. The value for air was only taken as a reference, since the exact dispersion of air also depends on e.g. CO2 and water vapor content, which were not determined in our measurement. For helium an unidentified systematic effect resulted in slightly different values for different runs. Therefore, the deviations due to the systematic effect is used as uncertainty.


Figure 3. Dispersion of different gases. Carrier-envelope phase shift induced by the noble gases and air at different pressures. The slopes of the linear fit to each measurement are used to calculate the first derivative of the refractive index at the central wavelength of the few-cycle laser pulse in use. The markers in the diagram only represent a small fraction of the measured values.
Download figure:
Standard image High-resolution imageTable 1. Comparison of measured values with data from literature at . The uncertainty of arises from the calibration of the center wavelength. Other influences (like pressure uncertainty etc) are insignificant in comparison. Literature values marked with an asterisk are extrapolations. In the Kr and Xe case, the model functions for as provided in [20] are supported by experimental data only up to 623 nm, for Ne only up to 546 nm.


| Slope (rad bar–1) | ||||
|---|---|---|---|---|
| Material | (This work) | (This work) | [19] | [20] |
| Air | −11.771 | −9.800 ± 0.004 | −9.35 ± 0.04 | −9.711 |
| Helium | −0.52 | −0.44 ± 0.02 | −0.419 ± 0.002 | −0.478 |
| Neon | −1.034 | −0.8606 ± 0.0009 | −0.862 ± 0.004 | (−1.221)* |
| Argon | −10.437 | −8.689 ± 0.003 | −8.50 ± 0.04 | −8.674 |
| Krypton | −21.380 | −17.799 ± 0.004 | −17.38 ± 0.07 | −18.982* |
| Xenon | −50.29 | −41.87 ± 0.02 | −41.2 ± 0.2 | −44.54* |


Regarding the calibration procedure, an exactly known (ideally analytically calculable) reference material would be most desirable in order to improve the determination of the carrier wavelength and thus the accuracy of the dispersion measurement. Helium could be a good choice in this respect. The challenge is its low dispersion which would require a long propagation path and/or high pressure in the gas cell. In addition, the gas purity in the cell must be very high. For minimization of statistical uncertainties, a more compact, integrated and environmentally shielded setup is expected to be less prone to fluctuations like vibrations, air density fluctuations and local temperature gradients. This would render possible better single-shot accuracy and therefore shorter measurement times.
A requirement for the successful application of this method are rather small CEP difference changes during the measurement. The accumulation of large CEP differences would imply the accumulation of a significant imbalance of the dispersion in both arms of the setup. Equation (1) is valid in a strict sense only for pure first-order dispersion, meaning that the pulse envelope retains an unaltered profile. Higher-order dispersion would change this. For a reliable measurement either the leading non-constant term in the power series expansion must be much larger than the rest or the phase shifts must remain small enough so that the pulse envelope is still unaltered. Our measurement fulfills both conditions since weakly dispersive gases were used at moderate pressures/densities. On the other hand, the limitation can easily be overcome by compensating the change in dispersion due to the insertion of the sample. This can be done by moving the glass wedge pair in the sample arm (WP2 in figure 1) such that the pulse profile remains constant. In fact, one could move the glass wedge such that even the CEP remains constant as the sample is varied. This means that the dispersion of the sample is directly referenced to the dispersion of the glass wedge pair. Of course, the dispersion properties of the glass wedge pair have to be calibrated for this. Unlike other interferometric-type measurements, our method is entirely insensitive to the absolute value of the refractive index (the constant term in the power series expansion). Therefore our setup, although operated with ultrashort laser pulses, does not need balancing of the interferometer arms.
In conclusion, we have demonstrated a novel method of directly measuring the first-order refractive index dispersion of transparent materials using few-cycle laser pulses. The method inherently allows for very high precision measurements due to directly measuring and due to the high precision of the CEPM. Provided that the calibration is done with a suitable (meaning: exactly known) reference material and that the experimental conditions can be kept constant throughout the measurement time, high accuracy is also possible. In a proof-of-principle experiment we have measured the pressure-dependent dispersion of several noble gases with a precision of a few 10−4. Some typical constraints of interferometers, such as necessity of arm balancing or dependence on the actual value of the refractive index, are also removed with our setup. The scheme demonstrated can be generalized for temporally resolved experiments. In particular, it could serve for measuring the time-dependence of electronic processes in solid-state material, by 'pumping' the sample with ultra-short pulses. This would allow investigating the nonlinear response of dielectric matter, a subject that has attracted considerable attention recently [21, 22].

Acknowledgments
We acknowledge funding by the DFG within the framework of project PA 730/7-1 (priority program 1840), LaserLab Europe and NSF (Bulgaria) within the framework of project DFNI T-02/10-2014.