


Abstract
We study the general phenomenon of random organization using a vortex system. When a periodic shear with a small shear amplitude dinp is applied to many-particle (vortex) assemblies with a random distribution, the particles (vortices) gradually self-organize to avoid future collisions and transform into an organized configuration. This is detected from the time-evolution of the voltage  (average velocity) that increases towards a steady-state value. From the subsequent readout measurements of
  using various shear amplitudes, we find that the information of the input shear amplitude dinp is memorized in the configuration of the vortex distributions in the transient as well as the steady state, and that it is readable. We also find that the transient vortex configuration formed during random organization is not microscopically homogeneous but consists of disordered and organized regions.
Export citation and abstract BibTeX RIS

Original content from this work may be used under the terms of the Creative Commons Attribution 3.0 licence. Any further distribution of this work must maintain attribution to the author(s) and the title of the work, journal citation and DOI.
1. Introduction
When a periodic shearing force is applied to many-particle systems with a random distribution and the number (n) of shear cycles is increased, the particles gradually self-organize to avoid future collisions and transform into an organized configuration. Associated with this non-equilibrium phenomenon, so-called random organization, a novel non-equilibrium transition from reversible to irreversible flow was revealed in periodically sheared colloidal suspensions with an increase in shear amplitude [1–3]. After being subjected to long-time periodic shear with small shear amplitudes, the colloidal suspensions in viscous media, which are contained in the gap between two concentric cylinders, settle into a reversible state, but they reach an irreversible state for large shear amplitudes. Below a threshold amplitude, the colloidal particles organize such that all the particles return to their initial position after each shear cycle. However, above the threshold amplitude, some particles always collide and reversibility is lost. In either case, the collision-induced random-organization process was described by a simple model in which the particles that touch each other during a shear cycle are given a small random displacement [3]. Moreover, the relaxation times τ for the system to reach the steady state diverge on both sides of the transition with critical exponents slightly larger than unity. Such a critical behavior was actually observed in the colloidal experiment as well as in numerical simulations [3], and thereby the existence of the reversible to irreversible flow transition (RIT) has been demonstrated. It has also been suggested that this non-equilibrium RIT may fall into the universality class of plastic depinning and absorbing phase transitions, which include directed or conserved directed percolation [4–12].
We have shown that RIT found in the colloidal system also occurs in a periodically sheared vortex system, as predicted numerically [5], despite the fact that there is a difference in the length scales of the inter-particle interaction and the 'particle' size between the two systems [13]. We have used amorphous (a-)MoxGe1−x films with weak random pinning. In the vortex system the length scales characterizing the inter-vortex interaction and vortex-core (particle) size are the magnetic penetration length ( nm) and coherence length (
 1 × 10 nm), respectively, and hence the interaction length relative to the vortex-core size is well above 1. This is in contrast to the case of the colloidal system where direct collisions between the particles dominate the dynamics. We first studied a Corbino disk (CD) [14–18] where, by applying a radial ac current, the vortices are rotated back and forth around the center of the sample by exerting a frustrated Lorentz force inversely proportional to the radius of rotation [13, 19]. The average vortex velocity passing between the voltage contacts placed radially is detected from voltage V. Under an increase in the displacement amplitude d of vortices per cycle [13], we have found the threshold displacement dc for RIT as the onset of flow noise SV in the steady state. We have also measured the time (t)-dependent voltage
  just after the ac square current Iac was applied, and found an increase in the amplitude of the voltage,
  , toward the
  steady-state voltage
  , reflecting random organization. The relaxation times τ on both sides of RIT show a power-law divergence at dc [5] with critical exponents
  , consistent with the results obtained in the colloidal system [3]. These results indicate that RIT is a universal phenomenon in periodically driven interacting particle systems [5, 20, 21]. The reorganization of a vortex system in response to an ac drive was reported earlier by transport measurements for NbSe2 crystals [22].
It has been predicted theoretically that for the periodically sheared vortex system, even though one uses the strip-shaped samples where the global shear is absent, in contrast to the case of CD, RIT should be observed as long as the samples contain moderately strong pinning that generates local shear [5]. This prediction has been proved experimentally in our strip-shaped film of a-MoxGe1−x with stronger pinning than in CD [23], although the reversible phase is much suppressed, which is attributed to the stronger pinning effects in the particular sample used in the study. Here, we note the fact that in our strip-shaped a-MoxGe1−x films, edge effects [15, 17, 18] are not important on static or dynamic vortex properties [24].
While RIT turns out to be a universal phenomenon in periodically driven many-particle systems, the nature of random organization remains unclear, which is a general problem in physics. In particular, it is of great interest how random organization evolves with the increase in the cycle number n of the ac shear. Related to this problem, theoretical [25] and experimental [26] studies on the colloidal system have found that the information of the input shear amplitude is memorized in the configuration of the particle distributions, and it is readable by a subsequent readout experiment with various shear amplitudes.
In this paper, we first examine whether an assembly of vortices also remembers the information on the ac drive with which the present configuration was formed, and whether it is readable. Then, we explore whether we can experimentally obtain the information as to how the random organization evolves with an increase in the cycle numbers n of ac shear. For this purpose, we have conducted two-step measurements [25, 26] for a strip-shaped a-MoxGe1−x film [5, 23] where the reordering of the vortex distributions is exclusively determined by the local shear due to the random pinning potential and ac drive. In the first input (or training) experiment, we initially prepared the most disordered vortex distribution [27], which was subsequently subjected to an ac drive with a moderately small displacement amplitude dinp slightly larger than dc. After being subjected to the periodic shear of n cycles with dinp, the vortex configuration was frozen by abruptly switching off the driving current [22]. Note that for  (typically,
  ), the system relaxes to the irreversible state close to the reversible state, and hence the frozen configuration corresponds to the relatively organized state.
In the second readout experiment, the thus-prepared vortex configuration was again subjected to periodic shear with various amplitudes d and the transient voltage  was measured. As a result, we have clearly found a memory formation. That is, the information of the input training amplitude dinp is stored within the input vortex configuration in the transient state (
 ) as well as the final steady state (
 ), and it is readable. The striking finding is that in the readout experiment for the input vortex configuration in the transient state (0
  ), the readout voltage
  generated in response to the ac drive with given d is well reproduced by the weighted average of
  for the input configuration of n = 0 and
  for the input configuration of
  with an appropriate weight parameter α. Combined with the result that α is nearly d-independent and changes monotonically from 0–1 with n, we propose a simple model whereby the transient vortex configuration formed during random organization is not microscopically homogeneous but rather consists of two regions: a disordered region (DR) prepared initially (
 ) and an organized region (OR) characterized by
  cycles with dinp.
2. Experimental
The a-MoxGe1−x film with a thickness of 350 nm was prepared by rf sputtering on a silicon substrate mounted on a water cooled rotating copper stage [13, 19, 23, 24, 27, 28]. The superconducting transition temperature in zero field (B = 0) at which the resistivity vanishes is 6.3 K. The width of the sample is 0.3 mm and the vortices are driven in the direction of the sample width. The voltage contacts spaced at  were used to measure the voltage V generated by vortex motion. The linear resistivity was measured using a standard four-terminal method. We also measured the time evolution of the voltage
  just after the ac current Iac of the square waveform was applied to the vortex system. The
  enhanced with a preamplifier was taken and analyzed using a fast-Fourier transform (FFT) spectrum analyzer with a time-resolution of up to 40 kHz [13, 19, 23, 24, 28]. The amplitude of Iac was adjusted to yield an ac voltage with a desired amplitude
  . In measuring the noise spectra SV over a broad frequency range (1 Hz–40 kHz), the voltage enhanced with a preamplifier was analyzed with the FFT spectrum analyzer. We obtained excess noise spectra by subtracting the background contribution, which was measured with zero current [13, 19, 23, 24, 28]. The sample was directly immersed into the liquid 4He. The magnetic field B was applied perpendicular to the plane of the film.
3. Results and discussion
All the data were taken at 4.1 K in 3.5 T corresponding to the peak-effect regime at equilibrium [29–37] where pinning is effective [13, 24]. The average inter-vortex distance is a few tens nm. The vortices were periodically driven by the square ac current Iac whose amplitude was set to yield an ac voltage with constant amplitude  μV in the steady state (
 ). We know from the dc current–voltage (I−V) characteristics that dc vortex flow at 100 μV corresponds to pinning dominated plastic flow [24]. The frequency f of Iac was varied from 600–20000 Hz to change the displacement amplitude d of the vortices in the range 0.6–20 μm. Here, d is determined from the relation
  , where l is the distance between the voltage contacts [13].
The voltage noise spectra SV generated by the vortex motion in the steady state was measured as a function of d. It was found that the spectral shape of SV is of Lorenzian type on which narrowband noise originating from the fundamental and higher order frequencies of Iac is superimposed, such as that shown in figure 1 of [13]. For small d, some data points are missing from the spectra, indicating that SV is below or close to the background level, while for larger d, substantial broad-band noise exceeding the background level appears. In figure 1, we plot the d dependence of SV at a low frequency (100 Hz). For d smaller than about 1 μm, SV (100 Hz) shown with open circles is below the background level, as indicated with a dashed line. However, as d exceeds 1 μm, SV (100 Hz) shown with solid circles starts to rise and increases almost linearly with d. Similar behavior was observed previously both in the CD [13] and strip samples [23]. From the linear extrapolation of the solid circles to the abscissa (SV = 0), the threshold value of d where SV disappears is determined to be dc = 0.4 μm. This value is interpreted as a threshold displacement of RIT [13, 23].

Figure 1. SV at 100 Hz plotted against d. Open circles represent SV (100 Hz) below the background level, which is indicated with a horizontal dashed line. A full line is a linear fit of the data (solid circles) above the background level. An arrow marks the location of dc.
Download figure:
Standard image High-resolution imageFor  , which corresponds to the reversible state, all the vortices that are periodically sheared eventually find a position such that they no longer collide with each other and therefore no noise is detectable in this state [5]. On the other hand, for
  corresponding to the irreversible state, the system reaches the steady state where a nonzero fraction of vortices always collides with another vortex [5]. With an increase in d, the fraction of the colliding vortices increases and the system becomes more fluctuating, which results in an increase in noise SV, as observed here.
In the following, we focus on the transient behavior of vortices associated with random organization due to periodic shear. To realize random organization, initially a highly disordered vortex configuration was prepared for each measurement. This has been accomplished by driving the vortices with a small dc current yielding 100 μV, which corresponds to plastic flow, for a sufficiently long time to reach the steady state, and then the vortex configuration was frozen by abruptly switching off the dc current [27, 38]. The thus-prepared highly disordered initial vortex assembly was periodically driven by square ac currents giving rise to displacement amplitudes in the range d = 0.6–20 μm (i.e. f = 600–20000 Hz), while the amplitude of the ac voltage in the steady state,  , was fixed to be
  μV. For
  μm, we were not able to obtain reliable data because of the limitation of the resolution for the fast
  measurements. Figures 2(a)–(c) show the representative voltage response
  of the system to the ac drive with d = 6, 3 and 1 μm, respectively, where
  is normalized by
  . In all cases, the amplitude of the first voltage pulse, V0, is smaller than
  (i.e.
(i.e.  1) and
  shows a monotonic increase with t (or the number n of cycles), relaxing towards a steady-state value of 1.

Figure 2.
 for the highly disordered vortex configuration in response to the ac drive with the displacement amplitudes (a) d = 6, (b) 3, and (c) 1 μm. The dotted lines are the fit of
  to equation (1), from which the relaxation time τ to the steady state is extracted, and the horizontal dashed lines mark the steady-state value of
  = 1. An arrow in (b) indicates the region (
 cycles) over which the relaxation curve overlaps that of
  in figure 5(b). The left and right diagrams of (a)–(c) schematically illustrate the initial (t = 0) and final (
 ) vortex configurations, respectively, where a lighter blue color indicates a more organized vortex configuration.
Download figure:
Standard image High-resolution imageSince the voltage is proportional to the average vortex velocity, the small V0 implies that the initial vortex state is a pinning-dominated disordered state and the vortices are unable to move easily. However, when the vortices are periodically driven over the random pinning potential, they collide with each other and come to experience a random force. This facilitates a rearrangement in the vortex configuration to avoid future collisions, and thus random organization proceeds. In the final steady state, the system reaches a less disordered configuration where the vortices are more mobile than in the initial state [13]. These behaviors are similar to what has been observed in the colloidal system [3]. The change in the vortex configuration is schematically illustrated in the left and right diagrams of figures 2(a)–(c), where a lighter blue color indicates a more organized vortex configuration.
The main panels of figures 2(a)–(c) clearly show that the relaxation is longer for smaller d. To extract the relaxation time τ for the system to reach the steady state, the amplitude of the ac voltage,  , is fitted by a simple relaxation function proposed in [3, 4]:

Here, we fix a to be zero, because the theory predicts that the value of a is relevant only very close to the transition ( ), while in our experiment
  is relatively small. The dotted lines in figures 2(a)–(c) indicate the fits of
  to equation (1) and the horizontal dashed lines mark the steady-state value of
  = 1.
= 1.
In figure 3, the values of τ thus obtained are plotted against d with red solid circles. They show a power-law divergence at 0.4 μm (see below), which is the same as dc determined from SV (100 Hz) in figure 1. The inset displays the plots of all data on a log–log scale,  versus
  . The red full lines in the main panel and inset represent the power-law fit by
  with ν = 1.35 ± 0.15. The obtained exponent ν = 1.35 ± 0.15 is close to 1.1 ± 0.3, 1.33 ± 0.02, and 1.3 ± 0.3 reported in colloidal experiments, simulations [3], and vortex experiments in CD [13], respectively, supporting the occurrence of RIT at dc = 0.4 μm in the present vortex system.

Figure 3. d dependence of τ (red solid circles) obtained from ![$| V(t)| /{V}^{\infty }[\equiv | {V}_{n=0}(t)| /{V}^{\infty }]$](https://content.cld.iop.org/journals/1367-2630/19/5/053023/revision2/njpaa6ad8ieqn55.gif) , such as shown in figures 2(a)–(c), for the highly disordered vortex configuration in response to the ac drive with different
, such as shown in figures 2(a)–(c), for the highly disordered vortex configuration in response to the ac drive with different  μm).
μm).  exhibits a divergence at
  μm, whose location is indicated by a vertical dashed line. The inset shows the
  versus
  plot for all data. The red full lines in the main panel and inset represent the power-law fit by
  with ν = 1.35 ± 0.15. The blue, green, and red open circles in the main panel indicate τ's obtained from
  , such as those shown in figures 4(a)–(c), taken with
  μm(= dinp),
  μm, and
  μm, respectively. For
  μm, a trend for
  to diverge at
  μm is also seen. The black line is a guide for the eye.
Download figure:
Standard image High-resolution imageHereafter, we examine whether the vortex configuration remembers the information about the ac drive with which the present configuration was formed, and whether it is readable. For this purpose, we have carried out two-step measurements. First, in what we call an input (or training [25]) experiment, the vortex distribution with a highly disordered configuration was prepared by a dc current [27], and then the vortices were periodically driven by an ac current Iac. The displacement amplitude  of the ac drive was fixed to be
  μm, which is slightly larger than
  μm, by adjusting the frequency f of Iac. After many cycles (typically more than
  cycles), we obtained the steady-state vortex configuration, which corresponds to the irreversible state close to the reversible state, hence the relatively organized configuration. This vortex configuration, which we name an input configuration, was frozen by switching off the ac current.
Next, the readout experiment was conducted for this input configuration. Here, the ac currents Iac yielding various d (i.e. various f) in the range 0.6–10 μm were applied. Figures 4(a)–(c) show the typical data of the time evolution of the voltage  in response to the ac drive with d = 6, 3, and 1 μm, respectively. The horizontal dashed lines mark the steady-state value of
  = 1. When d(=1 μm) is smaller than dinp = 3 μm, as shown in figure 4(c), the amplitude of the voltage,
  , shows a monotonic increase towards the steady-state value of 1, which is similar to that observed in the disordered initial configuration shown in figures 2(a)–(c). However, when d is equal to dinp = 3 μm, no relaxation is observed, as seen in figure 4(b). Once d(=6 μm) exceeds dinp = 3 μm,
  shows a monotonic decrease and relaxes toward unity, as shown in figure 4(a).
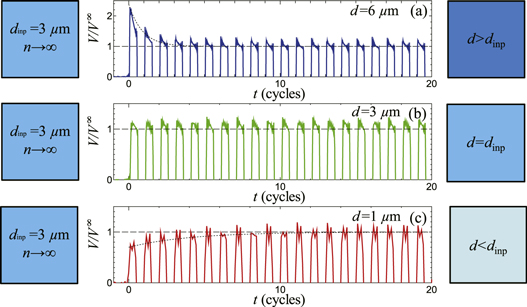
Figure 4. The readout voltage  for the input vortex configuration formed by
  cycles with dinp = 3 μm in response to the ac drive with (a) d = 6, (b) 3, and (c) 1 μm. The dotted lines in (a) and (c) represent the fits of
  to equation (1) and the horizontal dashed lines denote the location of the steady-state value
  = 1. The left and right diagrams of (a)–(c) schematically illustrate the initial (t = 0) and final (
 ) vortex configurations, respectively, where the lighter blue represents the more organized vortex configuration.
Download figure:
Standard image High-resolution imageThese striking features are explained as follows: the input configuration for  is relatively organized and the whole area of the sample is occupied by the steady-state vortex configuration created by dinp = 3 μm (for
  ), which is schematically illustrated in light blue in the left diagrams of figures 4(a)–(c). In the readout experiment which follows, it is reasonable to expect that the vortex configuration remains unchanged, as long as the same ac drive (d = 3 μm) as the input drive (dinp = 3 μm) is applied. This is displayed in the left and right diagrams of figure 4(b) by the same color.
However, when d(=1 μm) of the readout ac drive is smaller than dinp = 3 μm of the input ac drive, the increase in  with t is observed as a result of random organization [13], as shown in figure 4(c). This is because the final vortex configuration created by d smaller than dinp is more organized than the initial configuration. This is schematically illustrated by the lighter blue of the right diagram in figure 4(c) than the left one. Here, we use the fact that within the irreversible state (
 ), the smaller d of the ac drive gives rise to a more organized final vortex configuration containing a lower number of irreversible flow channels [5, 13]. This is also supported by our experimental result that, by decreasing d, broad-band noise SV at a low frequency, which reflects the strength of the inter-vortex collision in the final steady state, decreases, and the relaxation time τ for the disordered initial vortex system to reach the organized steady state increases, as shown in figures 1 and 3, respectively. The readout process in figure 4(c) is essentially the same as the ones shown in figures 2(a)–(c), where the 'input' vortex configuration prepared by the dc drive is the most disordered, as illustrated in the darkest blue in the left diagrams of figures 2(a)–(c).
When d(= 6 μm) of the readout ac drive is larger than dinp = 3 μm, the decrease in  with t is visible, associated with the dynamic disordering process [13, 39]. The final vortex configuration created after many shear cycles of d = 6 μm is less organized than the initial (input) configuration prepared by dinp = 3 μm. Therefore, during the readout process, the vortex configuration becomes gradually disordered; the vortices are subjected to more collisions and become less mobile, resulting in a decrease in
  towards 1. The disordering of the vortex configuration after the readout experiment is schematically illustrated as a change in color from light blue (left) to blue (right) in figure 4(a).
The clear difference among the relaxation curves found in figures 4(a)–(c) makes it possible to obtain the information of the input amplitude dinp = 3 μm from the readout experiment. Note again that this experiment is always conducted for the input vortex configuration corresponding to the irreversible state near RIT ( ). In the colloidal system, by contrast, the input configuration corresponding to the reversible state (
 ) was used [25, 26]. Accordingly, when the readout experiment was carried out using d smaller than dinp, one would never observe collisions between the particles, and transient phenomena never appear. This is in contrast to the present case (
 ), where transient behavior is always observed in the readout experiment, even when we use d smaller than dinp.
The amplitude of the time evolution of the voltage  in figures 4(a)–(c) can be fitted using equation (1), as shown with the dotted lines. The relaxation times τ's obtained from the fits are plotted with open circles against d in figure 3, where red, green, and blue correspond to τ's taken with
  μm(=dinp),
  μm, and
  μm, respectively. The diverging behavior of
  , reflecting RIT, is again visible on approaching
  . However, we cannot discuss the values of the critical exponent ν, because the critical region of RIT is much narrower, which is at most in the range
  (=3 μm), than that in the highly disordered 'input' vortex configuration prepared by the dc drive (
 ) mentioned above. In addition, the values of τ are relatively small due to the proximity of dinp to dc.
It has been shown numerically and experimentally in the colloidal system that the information of the training (input) shear amplitude dinp( ) is stored in the configuration of the particles, and this memory is readable not only from the configuration in the reversible state but also from that in the transient state before the system reaches the final reversible state [25, 26]. Using the vortex system, we also examine the memory effect of the training amplitude dinp, which may be stored in the input configuration of the transient state as well as the steady state. In preparing the input vortex configuration, we again applied the ac square current
  yielding dinp = 3 μm(
 ) for n cycles to the highly disordered vortex distribution prepared by the dc drive, and froze the configuration at t = nth cycle by switching off the applied Iac. Then, the readout experiment was conducted using the ac drive with various d both above and below dinp. The difference from our above-mentioned experiment is that, to guarantee the transient state of the input vortex configuration, n was kept finite,
  cycles, corresponding to less than ∼10τ.
First, we show the results of the input configuration for  cycles and the dependence on n will be discussed later. Figures 5(a)–(c) depict the time evolution of the readout voltage
  in response to the ac drive with d = 6, 3, and 1 μm, respectively. For d = 3 μm, which is the same as dinp, the amplitude of the voltage
  follows a simple relaxation function with a single value of the relaxation time τ, as shown with a dotted curve in figure 5(b). This curve overlaps the relaxation curve after the 20th cycle in figure 2(b), as marked with an arrow. This is not surprising, considering that, in the present input experiment, the vortex configuration was frozen at
  20th cycle and each vortex remained in the same position until we started the readout experiment. The dotted line in figure 5(b) indicates the fit of
  to equation (1) with the same relaxation time τ as obtained in figure 2(b).

Figure 5. The readout voltage  for the input vortex configuration prepared by dinp = 3 μm after
  cycles in response to the ac drive with (a) d = 6, (b) 3, and (c) 1 μm. A dotted line in (b) indicates the fit of
  to
to  in equation (2) and those in (a) and (c) represent
  ,
,  , and
, and  from top to bottom, respectively. The horizontal dashed lines denote the location of the steady-state value. The left and right diagrams of (a)–(c) schematically illustrate the initial and final vortex configurations, respectively, where the lighter blue represents the more organized vortex configuration. The dark and light blue areas in the left diagrams correspond to DR and OR, respectively.
Download figure:
Standard image High-resolution imageThe most remarkable finding in this work is shown in figures 5(a) and (c). It is evident from figure 5(a) that  generated in response to the ac drive with
  μm cannot be reproduced by a single relaxation curve but is characterized by a fast decrease at
  cycles followed by a slow increase and relaxation towards
  = 1. Qualitatively similar results are obtained for all d(
 ) in the range 6–10 μm studied. We will show below that
  is reproduced by a superposition of two relaxation curves with relaxation times obtained in figures 4(a) and 2(a).
Figure 6 shows the time-evolution of the readout voltage  for three different input vortex configurations in response to the ac drive with
  μm. The red line represents
  for the input configuration prepared by the input ac drive for n = 0 cycles, thus corresponding to the most disordered initial configuration. This data of
  is identical to that of
  at
at  cycles in figure 2(a), indicative of the dynamic ordering process. The blue line represents
  for the input configuration prepared by the input ac drive with
  μm for many (
 ) cycles, thus corresponding to the most organized input configuration. This data is the same as the data of
  at
at  cycles in figure 4(a). The green line corresponds to the data of
  at
at  cycles in figure 5(a). It is found that
  is well reproduced by the weighted average of
  and
and  with an appropriate weight parameter α, which is expressed as:

The best fit to the data is obtained using α = 0.47, as indicated with the purple line in figure 6. The dotted lines in figure 5(a) represent  ,
,  , and
, and  from top to bottom, respectively.

Figure 6. The readout voltages,  (red line),
  (blue line), and
  (green line), for the input vortex configurations prepared by the ac drive with
  μm after n = 0, many (n > 4000), and
  cycles, respectively, in response to the ac drive with
  μm. The purple line indicates the fit of the data of
  to equation (2) with α = 0.47. The horizontal dashed line marks the location of the steady-state value.
Download figure:
Standard image High-resolution imageFigure 5(c) shows the readout  generated in response to the ac drive with
  μm, which is smaller than dinp = 3 μm. In contrast to the case of
  μm (
μm ( ),
),  shows a monotonic increase with t and saturation towards unity, suggesting that only the dynamic ordering process takes place. Again,
  is unable to be expressed by a single relaxation function, but is characterized by a fast increase at
  cycles, followed by a slow increase and relaxation toward
  = 1. Essentially the same behavior is observed for all d(
 ) in the range 1–2 μm studied. We have performed the same analysis using equation (2) for the data in figure 5(c) and found that
  is well reproduced by
  , i.e. the weighted average of
  in figure 2(c) and
  in figure 4(c) with α = 0.50 ± 0.05. The dotted lines in figure 5(c) represent
  ,
,  , and
, and  , respectively, from top to bottom. One can see a good agreement between
  obtained from the fit and the experimental data. Note that α = 0.5 determined here for the readout
  μm(
μm( ) is very close to α = 0.47 obtained above for the readout
  μm(
μm( ). Furthermore, it is found that α extracted from the fitting for different d studied in the range 1–10 μm stays in a limited range α = 0.43–0.50.
In figure 7, the values of α obtained from the readout ac drive with various d, which are indicated with different symbols, are plotted against the number n of the input drive cycles. For all n studied (n = 5–200 cycles), α measured with various d ranging from 1–10 μm stays in a narrow range around the n-dependent average α(n). It should be mentioned that for  cycles, the quality of the fit is not good for the ac drive with d = 1–2 μm, whose origin is attributed to the proximity of d to
  μm and a small contribution of
  , i.e. a small contribution of the organized configuration characterized by dinp = 3 μm. With an increase in n,
  rises steeply from zero for
  cycles, increases monotonically, and saturates asymptotically to 1 for
  cycles.
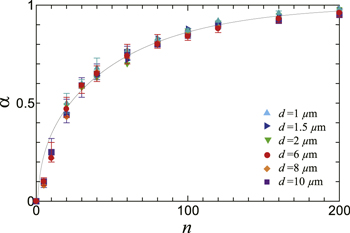
Figure 7. The weight parameter α in equation (2) plotted against the number n of the cycles of input drive with  μm. The different symbols correspond to the different displacement amplitudes d of the readout ac drive, which are listed in the figure. The black line is a guide for the eye.
Download figure:
Standard image High-resolution imageWe have shown that: (i) in the readout experiment for the input vortex configuration prepared by the ac drive with dinp = 3 μm for n = 20 cycles, the readout  generated in response to the ac drive with a given d is well reproduced by the weighted average of
  and
and  with an appropriate weight parameter α, and that (ii) α is nearly independent of d, irrespective of whether d is above or below dinp. These results strongly suggest that α reflects an intrinsic property, probably related to the input vortex configuration, in this case created by the ac drive with dinp = 3 μm for
  cycles. Combined with the result that (iii) α changes from 0 to
  with n, as shown in figure 7, we propose a simple model to illustrate that the transient vortex configuration formed during the training input process is not microscopically homogeneous, but consists of two regions: one is a highly DR that was initially randomized by a dc drive and was not subjected to a subsequent ac drive (i.e. n = 0); the other is a relatively OR that was formed by applying the input ac drive with dinp = 3 μm to DR for more than
  cycles. The present vortex configuration created by dinp = 3 μm for
  cycles is schematically illustrated in the left diagrams of figures 5(a)–(c), where the dark and light blue areas correspond to DR and OR, respectively. Note that from the present experiment, we cannot make a specific statement about the characteristic 'domain' size or shape of OR emerged in DR. However, judging from the fact that the critical behavior of RIT is observed in the random organization process, we can expect that the domain size is not macroscopic. The striking finding here is that we are able to estimate from the α – n relation obtained in figure 7 how the ratio of OR to the total area evolves with increasing n. Further experiments to directly visualize the vortex configuration, such as scanning tunneling microscopy, may provide useful information about OR, which is helpful to crosscheck the validity of the interpretation of α, and support our model.
The RIT may also be interpreted as a kind of a plastic depinning transition where irreversible vortex motion occurs in correspondence with the flow of topological defects in the lattice [40, 41]. Concerning dynamic ordering under ac and dc driving forces, Valenzuela reported a numerical study that simultaneously addresses the order and mobility of the vortex lattice [42]. It was shown that a lower density of defects in the vortex lattice is concomitant with a higher mobility, and that the vortex system driven by a dc force slightly above the depinning threshold (i.e. plastic flow with low mean velocities) is highly disordered with many defects in the vortex lattice. However, when an ac driving force with the same amplitude is applied, the defects heal and the vortex lattice reorders, resulting in an increase in the mobility. This seems qualitatively consistent with what has been observed in our input experiment. The numerical study also showed that with an increase in the number of cycles for the ac drive, the mobility of the lattice increases and the density of the defects decreases. Identifying the voltage (average velocity) and DR in our experiment with the mobility and the defect density, respectively, our experimental results would be qualitatively in agreement with the simulation.
Let us finally summarize the flow of the experimental procedure employed in this work and how we can deduce the evolution of the vortex configuration associated with random organization. Figure 8(a) outlines the input experiment of random organization, in which initially ( ) we apply the dc current giving rise to plastic flow, and freeze its vortex distribution by switching off the current, thus creating the highly disordered vortex configuration where many vortices are pinned to random pinning centers. This is schematically illustrated in the dark blue color in the diagram of figure 8(b). Then, in the readout experiment which follows, the ac drive with, e.g.
  μm, is applied to this highly disordered configuration; the amplitude of the readout voltage
  generated by vortex motion exhibits a simple relaxation behavior, as shown in figure 8(f). This data, which is also shown in figure 2(a), is indicative of dynamic ordering from the highly disordered vortex configuration to the relatively organized configuration characterized by
  μm for
  . Figures 8(g) and (h) show the readout voltage
  in response to the same d = 6 μm, but starting from the input configurations formed after
  and 40 cycles with
  μm, respectively, as indicated with left and right arrows in figure 8(a). While the saturation of
  towards the steady state
  is again visible,
  is not expressed by a simple relaxation function, but instead is well reproduced by
  of equation (2) using appropriate values of
  , similar to that seen in figure 5(a). From the obtained
  shown in figure 7, it is found that the ratio of OR to the total area increases monotonically with an increase in n. The input vortex configurations formed after n = 10 and 40 cycles with
  μm are schematically illustrated in the diagrams of figures 8(c) and (d), respectively, where OR is indicated with light blue. After the many (
 4000) input cycles, the readout voltage
  in response to d = 6 μm recovers to a single relaxation curve, as shown in figure 8(i). This implies that the input vortex system reaches a homogeneous steady state occupied only by OR, as schematically illustrated in the diagram of figure 8(e).

Figure 8. (a) The outline of the input experiment for random organization:  in response to the dc current (at
  0) and ac current Iac yielding
  μm (at
  ). (b)–(e) Schematic diagrams of the input vortex configurations: (b) the initially prepared highly disordered configuration, (c) those formed after
  10, (d) 40, and (e) many (>4000) cycles with
  μm. The dark and light blue areas represent DR and OR, respectively. With an increase in n, the ratio of OR to the total area increases monotonically towards 1. (f)–(i) The outline of the readout experiment:
  in response to the ac drive with fixed
  = 6 μm) for different input configurations formed after (f)
  , (g) 10, (h) 40, and (i) many (
 ) cycles with
  μm.
μm.
Download figure:
Standard image High-resolution image
Dynamic ordering phenomena, analogous to random organization due to the ac drive studied here, also occur in a disordered vortex system driven by a dc force [43]. On the other hand, it has been suggested that information on dynamic disordering [44] and on the depinning transition [19] may be involved in individual voltage pulses in response to the ac drive with a rectangular pulse shape, as observed here, as well as in  for the ordered vortex configuration in response to the dc drive. In our previous work using the same a-MoxGe1−x film system, we have found the dynamic ordering phenomena of the highly disordered pinned vortex assemblies, as well as the dynamic disordering phenomena of the ordered vortex ones, by a suddenly applied dc drive [39], consistent with the prediction of numerical simulations and other more indirect experiments [44]. The transient dynamics was well described by a critical phenomenon of the plastic depinning transition [4, 13, 39, 45], which is similar to that seen on the irreversible side of RIT. For the dc-driven vortex system, OR originating from ac shear dinp found in this work would be of course absent. Hence, it is interesting to investigate how the vortex configuration evolves associated with the dynamic ordering in the dc driven case. Moreover, random organization, as well as the transient memory formation and non-equilibrium transition associated with random organization, is one of the most fundamental phenomena widely observed in nature in driven interacting many-particle systems. The colloidal systems [1–3, 25, 26] are in the dilute limit while the vortex systems are in a much more strongly interacting limit. Therefore, this work has implications for more strongly interacting systems which exhibit random organization or memory effects [46–50]. It will be of great interest to perform the same experiment and analysis in other systems to explore the evolution of the particle configuration [1–3, 12, 25, 26, 32, 46–62]. Such a study using, for example, the colloidal particle or dense, jammed systems, would clarify the role of the inter-particle interaction in the formation of OR observed here.
4. Conclusions
We study the general problem of random organization using a vortex system of an a-MoxGe1−x film with random pinning, focusing on the memory formation and the evolution of the vortex configuration associated with random organization. Random organization was achieved in the input experiment where vortex assemblies with a highly disordered initial configuration were periodically sheared with a fixed small amplitude dinp for n cycles, and the transient voltage  that increases toward a steady-state value was measured. From subsequent readout measurements of
  in response to the ac drive with various shear amplitudes d, we find that the information of input dinp is memorized within the vortex configuration in the transient (
 ) as well as in the steady state (
 ), and that it is readable. This is consistent with the result of the colloidal system [25, 26]. We also find that the transient vortex configuration formed during random organization is not microscopically homogeneous but rather consists of two regions: the highly DR prepared initially and the OR characterized by dinp after many cycles. The ratio of OR to the total sample area,
  , increases monotonically from 0 to 1 with an increase in n and is nearly independent of readout d. These facts support the view that
  reflects an intrinsic property related to the vortex configuration associated with random organization. To provide more evidence for the conclusion, direct visualization experiments for the vortex configuration, such as scanning tunneling microscopy, may be useful.
Acknowledgments
This work was supported by a Grant-in-Aid for Scientific Research from the Ministry of Education, Culture, Sports, Science, and Technology of Japan. YK acknowledges the financial support from the Global Center of Excellence Program by MEXT, Japan through the 'Nanoscience and Quantum Physics' Project of the Tokyo Institute of Technology.