


Abstract
The dependence of hydrogen coverage on the bulk doping concentration is investigated for the polar O-terminated (000 ) ZnO surface. We use hybrid density-functional theory in combination with ab initio thermodynamics to determine a doping-dependent phase diagram of this surface. For hydrogen coverages lower than 50% dangling oxygen bonds remain at the surface, where they subsequently become charged by bulk electrons. For such charged surfaces, a computational first-principles approach is presented, with which long-range band bending can now be included in first-principles supercell calculations. In this work, we use a modified and extended version of the recently introduced charge-reservoir electrostatic sheet technique (Sinai et al 2015 Phys. Rev. B 91 075311) to incorporate band bending effects directly into our first-principles calculations. This allows us to investigate the effect of space charge layers and the resulting band bending on the hydrogen coverage of the ZnO (000) surface. After introducing a new implementation of CREST, we show that the structure and stability of polar ZnO surfaces are indeed sensitive to the amount of free charge carriers in the bulk. At low doping concentrations our results corroborate the previously reported (2 × 1) hydrogen phase, at higher doping concentrations the hydrogen coverage diminishes notably.
Export citation and abstract BibTeX RIS

Original content from this work may be used under the terms of the Creative Commons Attribution 3.0 licence. Any further distribution of this work must maintain attribution to the author(s) and the title of the work, journal citation and DOI.
1. Introduction
Due to its high optical transmissivity and tunable electronic properties, zinc oxide (ZnO) is a promising material for future technological applications, e.g. as a charge-injection material in hybrid light-emitting diodes [1–3], as an acceptor material in hybrid photovoltaics [4, 5], or as a charge-transport layer and transparent electrode in organic photovoltaic devices [6–8]. In these applications, device functionality and performance critically depend on the level alignment between the ZnO and a second material, often organic molecules. The alignment is influenced by the interface dipole, which in turn critically depends on the atomistic details of the ZnO surface [9]. However, discussions on the surface structure are still controversial, in particular for the polar oxygen-terminated (000) ZnO surface. A commonly investigated stability mechanism is the adsorption of atomic hydrogen on the pristine (000) surface. A coverage of half a monolayer satisfies the electron counting rule, leading to the very stable and well-known  hydrogen overlayer depicted in figure 1. Theoretical investigations, however, have proposed several other energetically very similar surface structures and predict a rich surface phase diagram [10–16], indicating that the surface is highly sensitive to the environmental conditions. Also, experimentally, a wide variety of structures has been observed for similar growth conditions [17–22]. Although a lot of effort has been made, and the previously conducted studies contributed significantly to a better understanding of ZnO surfaces, the origin of its structural diversity is not satisfactorily understood, and there are still variables whose impact on the surface phase stability have not been considered so far.

Figure 1. Illustration of the  -H oxygen-terminated polar ZnO surface, half covered by adsorbed hydrogen atoms. The blue, red and white balls denote zinc, oxygen and hydrogen atoms, respectively.
Download figure:
Standard image High-resolution imageOne of these variables, and a possible origin for the experimental diversity of the surface structures, is their dependence on the bulk doping concentration of ZnO. Even when grown as purely as possible, ZnO crystals always exhibit intrinsic n-type conductivity, whose origin has been the subject of an intensive debate [23–26]. Intrinsic carrier concentrations are typically of the order of  cm−3 [27]. Conversely, intentionally heavily doped substrates for plasmonic applications can reach carrier concentrations of up to
  cm−3 [28–30]. Although the doping concentration between different studies may differ by five orders of magnitude, in practice, the exact doping concentration is difficult to control and to measure [31], and is therefore not often reported in experimental studies.
Several recent computational studies indicate that free charge carriers play an essential role in the stability of different surface structures: Richter et al suggest that the oxygen vacancy concentration on metal oxide surfaces is determined by the doping concentration of the substrate [32]. Li et al investigated various surface models of zinc-terminated ZnO and concluded that n-type doping can stabilize the electron-acceptor states originating from the surface defects. Moreover, Moll et al found that for oxygen-terminated ZnO, the charge transfer from the bulk to the surface states can stabilize otherwise thermodynamically unfavorable structures, resulting in surface hydrogen atoms desorbing from the otherwise stable (2 × 1)-H reconstructed surface [33]. In all of these cases, charge carriers from the bulk are transferred to the surface to form electrically charged defects, which—depending on the position of the Fermi-level—are substantially more stable than their neutral counterparts.
However, so far a quantitative prediction of hydrogen desorption from the (2 × 1)-H surface has not been achieved, because long-range band bending, which affects the stability of surface structures as a function of the bulk doping concentration, cannot be included in first-principles calculations. In fact, to our knowledge the bulk doping concentration has not been consistently considered as a variable in the surface phase diagrams of semiconductors so far. With the recently introduced charge-reservoir electrostatic sheet technique (CREST) [34], the dependence on the bulk doping concentration can now be modeled. This approach has been previously successfully applied and tested for the well-known example of the Si(111)-surface [34]. CREST uses a two-dimensional charge sheet on the back side of a semiconducting surface slab, which mimics the effect of band bending associated with a charged surface. This makes it possible to explicitly include band bending in a slab calculation for any given bulk doping concentration.
Other approaches treat the charged surface defects by introducing an additional dopant charge into the calculation and by applying a posteriori correction schemes to subtract the contributions of the compensating homogeneous background in the supercell. These approaches, however, neglect the effect of the electric field in the space charge region [35, 36]. Kempisty and Krukowski presented a method to account for the electric field of the space charge region by manipulating the location and charge of passivating atoms on the back side of the slab [37–40], but did not translate the added charge into the bulk doping concentration.
In this work, we adopt the general idea of the CREST approach and present a modification that allows us to calculate the total energies as a function of the bulk doping concentration. With this modified CREST approach we can then calculate the doping-dependent surface phase diagram of the O-terminated ZnO (000) surface. With our calculations, we explore the correlation between the surface structure, the doping concentration and the resulting band bending. Our phase diagrams clearly demonstrate the connection between these three aspects. They show that at low doping concentrations, the energy cost associated with band bending prevents any hydrogen desorption and stabilizes the perfect  hydrogen reconstruction. In contrast, at high doping concentrations the H-coverage diminishes considerably.
The outline of this paper is as follows. The first part of section 2 briefly introduces the thermodynamic formalism we used to calculate the phase diagrams from ab inito density functional theory (DFT) calculations. In the second part (section 2.2), we recap the basic ideas of the CREST approach and then describe our implementation of the technique as well as its extension to the total energies. Section 3 describes the numerical details of the DFT calculations employed in this work. In section 4, we apply our revised CREST approach to obtain the phase diagram of the O-terminated (000) ZnO surface with the bulk doping concentration of ZnO as an extrinsic variable. Our conclusions are summarized in section 5.
2. Methodology
2.1. Phase diagram from ab initio thermodynamics
In this section, we briefly summarize how we apply ab initio thermodynamics to determine the stability of the various surface structures when in contact with an atomic reservoir, i.e. a surrounding gas. For the sake of brevity, we refer to the supplementary material, which is available online at stacks.iop.org/NJP/19/083012/mmedia, or [41] for further details.
When a surface is in thermodynamic equilibrium with an external reservoir at temperature T and pressure p, the most stable structure and composition of the surface is the one that minimizes the Gibbs free surface energy  . As we are interested in the relative surface stability, the thermodynamic quantity of interest is the change in surface free energy
  with respect to a given reference structure. We assume that Zn is always in thermal equilibrium with the surface, and restrict the problem to the two independent gas phase reservoirs H2 and O2. The corresponding chemical potentials of the reservoir gases
  and
and  are referenced to the total energies of the isolated H2 (
 ) and O2 (
 ) molecules:

More than two external reservoirs, i.e. gas components, can be considered in principle (see e.g. [42]). We refrain from this here so as not to unnecessarily complicate the discussion of the main focus of our manuscript—the dependence on the bulk doping concentration.
The change of surface free energy per unit area for a certain surface structure with respect to the chemical potentials of the reservoir gases  and
and  is then given as

where  is the total energy of the surface slab with
  removed hydrogens and
  oxygen vacancies present at the surface;
  is the energy of the reference surface. Taking into account all the considered surface structures, the most stable one for a specific set of chemical potentials
  is the one with the lowest
  . With this knowledge, we can build two-dimensional phase diagrams with the axes being the two chemical potentials. Since the energy differences between the surfaces can be small, it is crucial to correctly calculate the total energies of the investigated surface structures. Therefore, it is essential to account for the energy contributions associated with the charge transfer or band bending, which we can now do with the CREST approach.
2.2. The extended CREST approach
The CREST approach was introduced by Sinai et al in [34]. In this section, we review the main idea and explain our extensions, which allow us to use a smaller slab to facilitate the calculation of the total energies. For ease of understanding, we explain the application of CREST with the example of the ZnO (000) surface. At this surface, the oxygen atoms are only coordinated three-fold, rather than four-fold as in the bulk. Hence, they provide an extra half an electron each, or one extra electron for every two surface O atoms. Under typical ultra-high vacuum (UHV) conditions, the surface reacts with hydrogen, which adsorbs on every other surface O atom to form the  -H surface structure shown in figure 1. This structure satisfies the electron counting rule and exhibits flat band conditions, as shown in figure 2(a). When individual hydrogen atoms are removed, they expose a dangling bond with an associated surface state in the ZnO band gap. Due to the intrinsic n-type doping of ZnO, the Fermi level is close to the conduction band minimum. Electrons from the bulk can therefore lower their energy by filling this surface state. The migration of electrons to the surface results in a net surface charge and leaves behind a depletion of charge carriers in the region adjacent to it. The depletion region is also referred to as a space charge region, and depending on the doping concentration, can reach macroscopically far into the crystal. Electrostatically, this leads to the formation of band bending, which shifts the energy levels near the surface relative to their bulk positions until they are in resonance with the bulk Fermi level, as shown in figure 2(b).

Figure 2. A schematic explanation of surface band bending due to the creation of surface states caused by dangling bonds at the ZnO (000) surface. (a) A representation of our system of interest before the charge is transferred to the surface. In the case of n-type conductivity, the Fermi energy  is close to the conduction band minimum (CBM) of the system. The work function
  will be used as a convergence criterion in our CREST procedure. (b) The system of interest after equilibration, where charge carriers from the doped bulk now partially fill the surface state. This causes an offset of the valence band maximum (VBM) and the conduction band minimum (CBM) relative to the Fermi energy near the surface.
Download figure:
Standard image High-resolution imageWith the CREST approach, band bending can be included in the first-principles calculations without having to treat the entire space charge region with first principles [34]. The concept of CREST is to only treat the near-surface region explicitly (e.g. by means of DFT), and use a classical electrostatic approach for the rest of the system. This is conceptually shown by the shaded region in figure 3(a). In the slab representing the surface, the free charge carriers are modeled using the virtual crystal approximation (VCA) [43] (see section 3 for details on how the VCA is employed in this work). The potential drop in the classical, electrostatic region that arises from ionized dopants can be adequately captured by homogeneously distributed point charges. However, for technical and numerical reasons, the homogeneously distributed charge is collapsed and is implemented as a two-dimensional charge sheet on the back side of the semiconducting slab, as shown in figure 3(b). Thus, the parabolic potential originating from the remaining ions in the space charge region is replaced by a linear drop of the potential between the bottom side of the slab and the charge sheet. Compensating charge-carriers are introduced in the DFT calculations of the surface slab, rendering the whole system effectively charge neutral.

Figure 3. (a) Band bending as a purely electrostatic effect can be modeled semi-classically by assuming a homogeneous space charge density caused by the ionized impurities. (b) The auxiliary system contains a thin slab that is treated explicitly by a quantum-mechanical calculation (QM-region). The remaining effect of the space charge region is modeled by the insertion of a charge sheet.
Download figure:
Standard image High-resolution imageSinai et al determined the position and charge of the charge sheet by fitting the plane-averaged electrostatic potential within the slab and extrapolating into the vacuum region below. However, when the slab thickness is reduced (e.g. to facilitate the use of computationally expensive hybrid functionals) such a fit might become unreliable. We therefore present an alternative, simplified approach to define the properties of the charge sheet, which is crucial for correctly accounting for band bending effects. Although we will explain our version of CREST using the example of n-type doped ZnO, we emphasize that our approach is completely general.
The major parameter of our CREST method is the work function of the 'bottom' side of the slab. In the slab approach, one of the essential convergence parameters is the slab thickness. Adsorption or desorption on one side of the slab should not affect the properties on the other side of the same slab. It is thus sensible to define the vacuum level on the 'bottom' side of the slab as our energy zero. Furthermore, it is clear that the 'bottom work function'  (i.e. the difference between the Fermi energy and the vacuum level) must not be affected by any change to the upper side of the slab. This fact can be exploited to determine the electrostatic potential drop over the space charge region and calculate the charge and position of the charge sheet. We can therefore define a target bottom work function
  for an ideal system that does not exhibit band bending (as shown in figure 2(a)). This target will guide us in the modified CREST scheme.
In an ideal system (e.g. the ZnO  -H surface before hydrogen desorption), where doping is modeled using the VCA, the Fermi-level is well above the mid-gap and no band bending occurs. When a hydrogen atom is now desorbed, a new acceptor-like state forms in the band gap. This state may be capable of holding one full electron. Since the state is below the Fermi energy, all free charge carriers will flow into this state. However, unless the slab is very thick, it will typically contain less than one full electron. As a result, the state becomes fractionally occupied, while the conduction band in the finite slab is completely depleted of electrons. Furthermore, the Fermi energy of the entire system (which is calculated from the electron distribution) is now in resonance with the gap state, which results in a change in the work function of the lower side of the slab
  . This change indicates a deviation from the target value
  and requires action.
The difference between  and
and  is equal to the electrostatic potential drop associated with band bending outside the quantum-mechanical region, i.e. outside the slab (see figure 3(a)). We refer to this part of the band bending as the tail
  ,
,

 will later be used to determine the position and total charge of the charge sheet that mimics band bending effects. This is where our extended CREST deviates from the procedure of Sinai et al [34]. Instead of fitting the electrostatic potential at the boundary of the slab we use the fact that we know the amount of band bending outside the slab and apply a self-consistent scheme to adjust the properties of the charge sheet to reproduce this amount. A flow chart covering all steps within our modified CREST approach is shown in figure 4. In the next paragraphs, we will derive the mathematical relations to define the correct properties of the charge sheet and explain the self-consistent scheme in more detail. However, for the sake of understanding, we first explain what effect the inclusion of the charge sheet has on the bottom side work function of the slab.
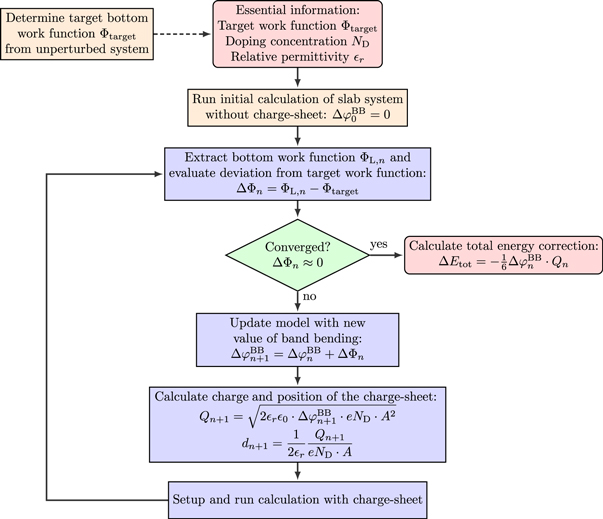
Figure 4. Flow chart of the self-consistent CREST scheme.
Download figure:
Standard image High-resolution imageBy including a charge sheet in the DFT calculation, we will change the bottom side work function  , because the electric field between the charge sheet and the bottom side of the slab results in a potential drop, which affects the bottom side work function. Our objective in CREST is now to adjust the properties of the charge sheet iteratively (the subscript n denotes the iteration) such that
  . If this is the case, the potential drop due to band bending would be correctly reproduced. We can interpret this procedure as finding the right amount of charge that has to be transferred to the surface, such that the distance of the conduction band to the globally defined Fermi level is correctly described. The slab states are now offset with respect to the lower vacuum level by the correct band bending, and the right amount of mobile electrons is included in the calculation.
To explain the mathematical details of our modified CREST method determining the charge and position of the charge sheet, it is useful to briefly recap the classical electrostatic equations associated with band bending in extended space charge layers. Let us consider an infinite surface parallel to the x-y plane with the semiconductor extending in the z direction. zd denotes the extent of the space charge region in the bulk starting from the surface at z = 0. In the depletion approximation, we assume all donors to be ionized in the space charge region, which gives a space charge density of  , with ND being the doping concentration. The resulting electrostatic potential associated with the electric field in the space charge region is determined by the one-dimensional Poisson equation,

where  is the electrostatic potential in the direction of the surface normal. The vacuum permittivity is given by
  , and
, and  is the relative permittivity of the material. With the boundary condition that the electric field vanishes at the edges of the space charge region, i.e. at z = 0 and at zd, the solution of the Poisson equation for the electrostatic potential yields

The bands bend parabolically, with a total potential drop over the space charge region of

here we replaced the charge density  by the total amount of charge of the ionized donors
  divided by the volume of the space charge region
  , where A is the base area of the slab. These equations describe the situation for homogeneously distributed dopants. In the next paragraph, we derive the equations for a system with a charge sheet as used in the CREST method.
For technical reasons, in the CREST method it is beneficial to collapse the homogeneous doping region into a single charge sheet, positioned within the space charge region. This charge sheet, combined with the quantum mechanical region, can be viewed as an auxiliary system. The properties of this auxiliary system will be defined in such a way that the original situation of the homogeneous doping region is described as accurately as possible. One difference between the original and the auxiliary system is the difference in relative permittivities. We position the charge sheet in the vacuum region on the back side of the slab calculation, and not in a medium with permittivity  . The slope of the potential therefore changes abruptly at the interface between the back side of the slab and the vacuum region due to the change in the relative permittivity from dielectric to vacuum. Within the slab, the relative permittivity of the material
  is given by DFT. It would also be desirable to set
  in the vacuum region between the lower slab surface and the charge sheet, which, however, has not been possible within most common DFT codes so far. Therefore, we correct for the influence of the relative permittivity in our equations, which determine the charge and distance of the sheet by considering the
  of the material in the equations of the homogeneous charge density, and setting it to the vacuum value in the following equations of the auxiliary system. With this, we introduce
  as an input parameter for our CREST (see figure 4 for reference) and ensure that the potential drop and the transferred charge is correctly reproduced.
Mathematically, the electrostatic environment of the auxiliary system can by described again by the solution of the Poisson equation. The constant charge density is now replaced by a delta function at the position d of the charge sheet

The two parameters that determine our auxiliary system are the surface charge density of our charge sheet  and the distance of the sheet from the back side of the slab d. The solution of the Poisson equation returns a linear drop in the potential between the back side of the slab at z = 0 and the position of the charge sheet at z = d

To ensure that our auxiliary system describes the intended system correctly, it has to fulfill two requirements to fix the two adjustable parameters of the charge sheet: first, the potential difference due to band bending  in the true system is reproduced by the auxiliary system

Second, the electric field acting on the slab is correctly described. The second criterion is fulfilled, if the charge sheet contains the same amount of charge  as the total charge of the volume of the space charge region
  . Equation (9) for condition one then determines the second free parameter, which is the distance d of the charge sheet. Inserting the potential drop for the homogeneous charge distribution (6), and for the auxiliary CREST system (8) into equation (9) yields
  . This ensures that the potential difference associated with the band bending is correctly reproduced.
Finally, to obtain the correct total energy in CREST we need to correct for the incorrect potential shape that was introduced by collapsing the space charge region into a charge sheet. We subtract the energy of the effective plate capacitor  introduced by the charge sheet and add the contribution for the parabolic shape
  of the desired homogeneous doping distribution. This gives a total energy correction of

This correction only depends on the potential drop due to band bending  and the charge within the space charge region, which is equal to the charge of the introduced sheet QC. The total energy of the slab system, which enters equation (2) for the phase diagram calculations, can now be written as
  . Additional information about the implementation of our modified CREST approach for FHI-aims can be found in the supplementary material.
3. Computational details
The structural parameters of bulk ZnO were obtained by optimizing the geometry of a primitive wurtzite bulk cell. The different surface geometries were modeled using a 4 × 4 slab supercell comprised of four ZnO double layers, for which the bottom two layers were fixed to their bulk positions. The top two layers were allowed to relax during the geometry optimization until the residual forces were smaller than  eV Å−1. The surface geometries were fully optimized for the undoped case, and kept fixed for all further calculations. The bottom side of the slab was passivated with pseudo-hydrogen atoms of nuclear and electronic charge
  , as is commonly done in the literature [44]. This ensures that the surface bands on the bottom side of the slab are fully occupied and charge neutralization for this side of the slab is enforced. A dipole correction was employed inside the
  Å vacuum region between the periodic images [45].
All calculations in this work were performed with the all-electron numerical atomic orbital Fritz Haber Institute ab initio molecular simulation code (FHI-aims) [46–48]. We used the Heyd–Scuseria–Erzenhof (HSE*) [50, 49] functional with the optimized mixing parameter  and the scaling parameter
  Å−1. These parameters are equivalent to the values of Oba et al [51], yielding a band gap of
  eV in the bulk calculations, which is in very good agreement with the experimental value of
  eV [52, 53]. Van der Waals forces were included using the vdW–TS scheme [54], employing the optimized parameters from [55]. We used tight defaults for the grids and basis sets for Zn and H atoms. For the O atoms, we removed the f and g functions from the tight tier-2 defaults to reduce the computational cost. For the same reason, we increased the Hartree–Fock screening threshold to
  . A
. A  k-grid was used for the bulk calculations and scaled accordingly for larger supercells. All settings were carefully tested to converge within a total energy accuracy of
  eV per primitive unit cell.
Doping in the ZnO slab was introduced by means of the virtual crystal approximation (VCA) [43, 56]. In the VCA, the O atoms are replaced by pseudo-atoms with a fractional atomic number  . For n-type doping, the corresponding change
  in the electron number per atom gives rise to excess electrons, which fill the bottom of the conduction band in our calculations. This results in mobile electrons, while the counter charge remains spatially fixed at the ionic cores. The build-up of a space charge layer and the associated band bending is then included with the CREST approach.
The relative permittivity  of ZnO required by the CREST approach was also calculated using the HSE* functional. To do so, we applied a small external field along the surface normal to the crystal and measured the resulting potential drop associated with the resulting polarization within the slab. We again kept the atomic positions fixed and thus calculated only the electronic and not the ionic contribution of the permittivity. We obtained
  , which is close to the experimental value of
  [57].
[57].
4. Results
4.1. Application of CREST: doping-dependent phase diagram for O-terminated ZnO
The CREST method explained in the previous section allows us to study the influence of the doping concentration on the stability of semiconductor surfaces. As a first step, we explore the defect-free O-terminated (000) ZnO surface and the influence of the doping concentration on the hydrogen termination. The  -H surface with a half-monolayer of adsorbed hydrogen, shown in figure 1, completely compensates the charge from the dangling bonds on the surface and therefore has a very stable surface structure. This means the partially occupied surface bands are filled by the adsorption of hydrogen on every second oxygen atom. Alternatively, free charge carriers introduced by dopants fill and thus passivate the surface gap states. This alternative passivation introduces an energy penalty, which results from the associated build-up of band bending. The question is whether the bare, bulk- truncated O-terminated (000) ZnO surface could ever be stabilized by such free charge carriers. To investigate this question we gradually remove hydrogen from the
  -H surface for different doping concentrations. We performed our calculations for a 4 × 4 supercell, which implies that the hydrogen coverage is reduced by
  % for every hydrogen atom that is removed.
Naively, one may expect the hydrogen coverage to reduce significantly for high doping concentrations, in accordance with the results reported by Moll et al [33] (who did not include band bending). However, figure 5, in which the coverage of the lowest energy structure is plotted as a function of the hydrogen chemical potential and doping concentration, shows that this is not necessarily the case. Converting the hydrogen chemical potential into the temperature and partial pressure of the hydrogen gas phase shows that for natively doped ZnO (i.e. approximately  cm–3), the unperturbed
  -H surface structure is still thermodynamically preferred for most realistic experimental conditions. Only at much higher doping concentrations or at very high temperatures do we find a deviation from the ideal structure. For UHV conditions and at 600 K, which is the temperature typically used for sample annealing, reduction to a surface coverage of 44% occurs for a doping concentration of
  . At lower temperatures, the transition would require an even higher number of free charge carriers. The stability of the
  -H surface against hydrogen removal can be explained by the cost of band bending. To compensate for the desorption of hydrogen from the surface requires a certain amount of charge to be transferred from the bulk to the surface state that is generated in the desorption process. However, charge transfer from the bulk to the surface states is limited by the electrostatic field originating from band bending. This energy cost stabilizes surface structures close to 50% coverage under realistic conditions and illustrates the importance of including band bending in the surface calculations. At these conditions a hydrogen reduction of
  is expected at a doping concentration of approximately
  cm−3. For this case, the generated surface state becomes filled by about 0.7 electrons. For lower doping concentrations, this critical value cannot be reached because band bending limits the charge transfer. However, one needs to consider that because of the limited size of the unit cell, we can only model hydrogen reductions in increments of 6%. With this in mind, we can argue that diminishing H-coverage of
  % is to be expected already at lower doping concentrations. So far our findings cannot be compared to experimental results, because to our knowledge there is no experimental study that systematically investigates ZnO surfaces depending on the doping concentration.
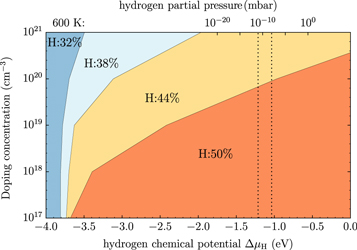
Figure 5. Defect-free (000) ZnO-O surface: the doping dependence of the hydrogen coverage as a function of the hydrogen chemical potential  . Colored regions represent the different surface structures with the corresponding coverage expressed as a percentage. In the top x-axis, the chemical potential has been converted into a partial hydrogen pressure at a temperature of 600 K. Vertical dashed lines mark a pressure region of
  mbar , which corresponds approximately to ultra-high vacuum (UHV) conditions.
Download figure:
Standard image High-resolution image4.2. Surface oxygen vacancies on the O-terminated ZnO surface
Oxygen vacancies at or near the O-terminated ZnO (000) surface have been discussed in the literature [12, 51], but from ab inito thermodynamics they are not considered to be stable in thermal equilibrium under realistic conditions. Still, they have been observed in experiments and might form in reality as a result of physical treatment during surface preparation procedures, which include sputtering and annealing steps. Therefore, we take a closer look at the stability of the ZnO surface including oxygen vacancies with the CREST approach. Introducing one oxygen vacancy in our 4 × 4 unit cell corresponds to an oxygen vacancy concentration of  %. Figure 6 shows the doping dependency of the hydrogen coverage in this case.
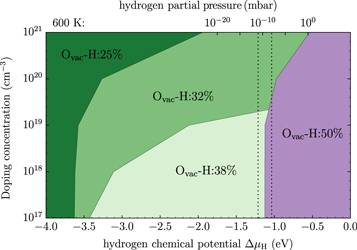
Figure 6. The oxygen vacancy concentration of 1/16 at the O-terminated (000) ZnO surface: the doping dependence of the hydrogen coverage as a function of the hydrogen chemical potential  . Colors represent the different surface structures with the corresponding coverage expressed as a percentage. For the top x-axis, the chemical potential has been converted into a hydrogen partial pressure at a temperature of 600 K. Vertical dashed lines mark a pressure region of
  mbar, which corresponds approximately to ultra-high vacuum (UHV) conditions.
Download figure:
Standard image High-resolution imageOne can see that there are now two competing surface structures in UHV conditions. For conditions that are richer in hydrogen, the (2 × 1)-H structure is still the most favorable. However, at smaller chemical potentials the most stable surface structure for low doping concentrations is now the one with two fewer hydrogens in the unit cell. This can easily be understood, since a structure with an oxygen vacancy and two hydrogens missing again fulfills the electron counting rule by completely filling the surface band. Thus no charge transfer from the bulk is required to saturate a dangling bond at the surface. Again, an increase in the doping concentration leads to a decrease in the hydrogen coverage. However, the desorption of hydrogen sets in at lower doping concentrations than for the defect free surface. While for the defect-free surface, hydrogen desorption is only observed for doping concentrations above  cm−3, oxygen vacancies provide additional charge carriers and lower this critical value to approximately
  cm−3. This is because the oxygen vacancy pins the Fermi level at a higher energy level, a concept we recently explored for self-assembled organic monolayers at ZnO surfaces [58], resulting in less band bending and a spatially smaller space charge region. The schematic band diagram explaining the position of the generated surface states and Fermi level pinning can be found in figure 7. Still, as in the defect-free case, band bending limits the charge transfer to the surface and so hinders a further decrease of its H concentration.
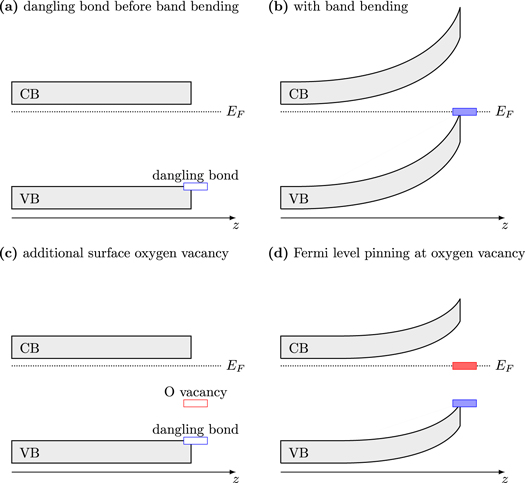
Figure 7. A schematic explanation of band bending and Fermi level pinning due to surface oxygen vacancies. (a) The situation at the defect-free surface before band bending. (b) A dangling bond leads to band bending that is approximately the size of the band gap. (c) The surface oxygen vacancy generates a gap state. (d) The Fermi level gets pinned at the O vacancy, significantly reducing the amount of band bending.
Download figure:
Standard image High-resolution image4.3. Complete phase diagram for various doping concentrations
Looking at the two phase diagrams with and without an oxygen vacancy, the question arises as to when the surface with an oxygen vacancy concentration of 1/16 becomes stable? To answer this question, we combine the results of the previous two sections and assume that the surface is simultaneously in equilibrium with two independent H2 and O2 gas reservoirs. The change in surface free energy now depends on the two chemical potentials of the surrounding gases and the doping concentration adds a third dimension. Such a three-dimensional plot would be hard to follow and therefore we representatively plot the phase diagrams for the two doping concentrations  cm−3 and
  cm−3 as a function of the chemical potentials
  and
and  . Additionally, we added the corresponding partial pressures at a temperature of 600 K to the opposing axes of the hydrogen and oxygen chemical potentials, respectively.
Figure 8 shows that for natively doped ZnO, the  -H surface structure is still the thermodynamically preferred surface structure under UHV conditions at 600 K. This means that we expect surfaces with oxygen vacancies and reduced hydrogen coverage to only become stable in extremely oxygen poor conditions or at very high temperatures. The doping concentration does have an influence on the hydrogen coverage once an oxygen vacancy is present, but does not distinctively influence the stability of the vacancy itself. So, how can we justify the fact that it is still relevant to consider surface oxygen vacancies? First, an oxygen vacancy with a fifty percent coverage of hydrogen results in an empty gap state at the surface, and therefore might be the cause of Fermi level pinning, which is seen experimentally; and second, vacuum chambers are not a thermodynamic equilibrium. In the majority of surface preparation techniques, the ZnO polar surface is sputtered at least once with Ar
 , for example. This sputtering could create oxygen vacancies that remain as metastable structures, even though they are, in principle, thermodynamically unstable.

Figure 8. Phase diagrams of the O-terminated (000) ZnO surface at doping concentrations (a)  cm−3 and (b)
  cm−3. The hydrogen coverage of a specific phase is expressed as a percentage. Phases based on a surface including an oxygen vacancy are marked with an asterisk. Physically sensible regions of oxygen and hydrogen pressures at 600 K are indicated by vertical and horizontal dotted lines, respectively.
Download figure:
Standard image High-resolution image
5. Conclusion
We show for the case of ZnO that the bulk doping concentration is a parameter that needs to be included in the theoretical modeling of phase diagrams to be able to interpret the experimental results. Using a modified formalism of the recently developed CREST approach [34], we now take the bulk doping and therefore the full effects of macroscopic band bending into account in our calculations for semiconductor surfaces. By combining the modified CREST approach with a thermodynamic formalism, we have determined a doping-dependent surface phase diagram of the O-terminated (000) ZnO surface. Our work thus demonstrates the capability of the CREST approach to produce doping-dependent phase diagrams.
In this work we have focused on the O-terminated (000) ZnO surface, with and without surface oxygen vacancies, for various hydrogen terminations over a range of doping concentrations. The resulting phase diagrams show that doping can lead to a variety of the surface structures seen in experiments. However, band bending opposes the charge transfer from the bulk to the surface and thereby counteracts the hydrogen deficiency. Thus for low doping concentrations we expect almost no deviation from the most stable  -H surface structure. For higher doping concentrations, the hydrogen coverage subsequently reduces, but a completely hydrogen-free surface limit appears unattainable. Deep donor states, such as oxygen vacancies, which can pin band bending at lower values, can serve as an additional source of charge carrier, leading to lower then 50% hydrogen coverage even at small doping concentrations.
Acknowledgments
This work was support by the Austrian Science Fund (FWF) under project number P27868-N36. We thank Egbert Zojer for fruitful discussions. PR acknowledges support by the Academy of Finland through its Centres of Excellence Programme under project numbers 251748 and 284621. The computations reported here were performed mainly at the Vienna Scientific Cluster (VSC).