


Abstract
Revealing the universal behaviors of iron-based superconductors (FBS) is important to elucidate the microscopic theory of superconductivity. In this work, we investigate the effect of in-plane strain on the slope of the upper critical field Hc2 at the superconducting transition temperature Tc (i.e. −dHc2/dT) for FeSe0.7Te0.3 thin films. The in-plane strain tunes Tc in a broad range, while the composition and disorder are almost unchanged. We show that −dHc2/dT scales linearly with Tc, indicating that FeSe0.7Te0.3 follows the same universal behavior as observed for pnictide FBS. The observed behavior is consistent with a multiband superconductivity paired by interband interaction such as sign change s± superconductivity.
Export citation and abstract BibTeX RIS

Original content from this work may be used under the terms of the Creative Commons Attribution 3.0 licence. Any further distribution of this work must maintain attribution to the author(s) and the title of the work, journal citation and DOI.
1. Introduction
The discovery of superconductivity in the iron oxypnictide LaFeAs(O,F) has triggered a surge of research on Fe-based superconductors (FBS) [1–4]. Systematic studies revealed several universal scaling behaviors for FBS as for example: (1) the Bud'ko–Ni–Canfield (BNC) scaling of the specific heat jump ΔC at the superconducting transition temperature Tc with ΔC ∝ Tc3 for the majority of FBS [5–11], (2) the linear dependence of the slope of the upper critical field −dHc2/dT at Tc versus Tc [12, 13], and (3) the relations between Tc and the structural parameters such as the As–Fe–As bond angle and the anion height [14, 15]. So far, there is no general agreement on the interpretation of these scaling behaviors. Kogan et al proposed that the BNC scaling ΔC ∝ Tc3 and −dHc2/dT ∝ Tc is related to an intrinsic pair-breaking in superconductors with strongly anisotropic order parameters, such as FBS [12, 16]. Alternatively, Zaanen et al discussed the idea that BNC scaling is expected for a quantum critical metal undergoing a pairing instability [17, 18]. Moreover, Bang et al pointed out that the observed scaling behaviors can be a generic property of the multiband superconducting state paired by a dominant interband interaction [19, 20].
In the case of FeSe1−xTex, the universal scaling behavior was found for the anion height position [14] and for ΔC [11]. However, it has not been reported for Hc2 so far. Recently, we demonstrated that biaxial in-plane strain allows to change Tc of the FeSe1−xTex thin films with x ≈ 0.3 in a broad temperature range avoiding phase separation [21]. This allows to study the behavior of Hc2 at well-defined conditions. In this work by measuring the electrical resistance in magnetic field we show that also FeSe0.7Te0.3 thin films follow the universal scaling behavior of −dHc2/dT ∝ Tc in a broad range of Tc, as observed in LnOFeAs (Ln: lanthanoid elements) and AEFe2As2 (AE: alkaline earth elements) compounds [12, 13].
2. Experiment
The thin films were prepared starting from a stoichiometric FeSe0.5Te0.5 target on various substrates, namely (La0.18Sr0.82)(Al0.59Ta0.41)O3 (LSAT), CaF2-buffered LSAT, and bare CaF2 (001)-oriented single crystalline substrates using pulsed laser deposition with a KrF excimer laser (wavelength: 248 nm, repetition rate: 7 Hz) under ultrahigh vacuum conditions with a background pressure of 10−9 mbar [21, 22].
The lattice parameter a was derived from reciprocal space maps measured in a PANalytical X'pert Pro system. Transmission electron microscopy (TEM) investigations of the films were performed in a FEI Tecnai-T20 TEM operated at 200 kV acceleration voltage. TEM lamellae were prepared by a focused ion beam technique (FIB) in a FEI Helios 600i using an acceleration voltage of 3 kV in the last FIB step. The composition of the samples was determined by energy-dispersive x-ray spectroscopy (EDX) with an Edax EDAMIII spectrometer in TEM. EDX line scans across the cross-section of the films confirmed the stoichiometry to be homogeneous over the film thickness, as shown in figure A1 in the appendix. It was found that the composition of the films is FeSe0.7Te0.3 within the error-bars of the analysis (few percent) for all studied substrates due to the preference of Fe to bond with Se because of the low formation energy [23]. Electrical transport properties were measured in a Physical Property Measurement System [(PPMS) Quantum Design] by a standard four-probe method, for which 4 pins are collinearly aligned along the edge of the film. More details on these structural properties are found in a recent publication of our group [21].
3. Results and discussion
3.1. Effect of strain on Tc
The temperature dependence of the resistance is shown in figure 1 for FeSe0.7Te0.3 films grown on different substrates (i.e. bare LSAT, CaF2-buffered LSAT and bare CaF2) measured in magnetic fields up to 9 T for H ∣∣ c. The dashed lines indicate the fit of the normal state just above the superconducting transition temperature Tc by R(T) = R0 + AT, where R0 is the resistance extrapolated to T = 0 K (i.e. residual resistance) and A is a constant. Tc is defined as 90% of the resistance in the normal state. As shown in figure 1(a), the lowest Tc of 6.2 K without magnetic field is measured for the films on bare LSAT substrate. Tc is nearly double by employing a 25 nm CaF2 buffer layer (figure 1(b)). Furthermore, the FeSe0.7Te0.3 thin films on bare CaF2 substrate have the highest Tc ∼ 18.1 K, shown in figure 1(c) (the data for additional films can be found in figure A3 in the appendix). The applied magnetic field suppresses Tc resulting in a monotonous broadening of the transition attributed to different temperature dependencies of Hc2 and irreversibility fields (Hirr). The temperature dependence of the normalized resistance for different films is shown in figure A2. The value of the residual resistivity ratio defined by R(300 K)/R(20 K) is consistent with the results reported by other groups [24, 25], and is nearly substrate independent.

Figure 1. Temperature dependence of the resistance measured in different magnetic fields close to the superconducting transition temperature of the FeSe0.7Te0.3 films on (a) bare LSAT, (b) CaF2-buffered LSAT and (c) bare CaF2 substrates in magnetic fields up to 9 T for H ∣∣ c. The dashed line indicates the extrapolation of the normal state resistance.
Download figure:
Standard image High-resolution imageTable 1. Structural and superconducting properties of the films on different substrates presented in this paper.
| 90% | 50% | ||||||
|---|---|---|---|---|---|---|---|
| Substrate | a (Å) | Tc (K) | Hc2 (0) (T) | −dHc2/dT (T K–1) | Tc (K) | Hc2(0) (T) | −dHc2/dT (T K–1) |
| LSAT | 3.787 | 6.35 | 17.11 | 2.69 | 5.27 | 11.99 | 2.27 |
| 3.788 | 7.39 | 24.83 | 3.36 | 5.74 | 14.66 | 2.55 | |
| 3.777 | 12.23 | 76.79 | 6.28 | 10.96 | 43.47 | 3.96 | |
| CaF2-buffer | 3.776 | 11.93 | 59.37 | 4.98 | 10.53 | 34.38 | 3.27 |
| 3.775 | 13.28 | 88.74 | 6.68 | 11.94 | 49.52 | 4.15 | |
| CaF2 | 3.748 | 19.11 | 158.29 | 8.29 | 18.62 | 98.99 | 5.32 |
| 3.753 | 19.31 | 139.54 | 7.23 | 18.42 | 81.47 | 4.42 | |
| 3.761 | 18.09 | 144.58 | 7.99 | 17.22 | 81.71 | 4.74 | |
As mentioned above, the particularities of the crystal structure have a strong effect on Tc in FBS [26, 27]. Recently we found that Tc of the FeSe0.7Te0.3 films is very sensitive to in-plane lattice parameter a [21]. Tc as a function of the a-axis is shown in figure 2 for a number of FeSe0.7Te0.3 films grown on the mentioned substrates. For comparison, values of optimally doped Ba(Fe0.92Co0.08)2As2 thin films on different substrates are also plotted [28]. The films have different a-axis lengths due to different in-plane compressive strain resulting mainly from the large thermal misfit between the substrates and the FeSe1−xTex layer [21, 22, 28–32]. It is apparent that the superconducting transition temperature Tc decreases linearly with increasing a-axis lattice parameter for the FeSe0.7Te0.3 films, which is consistent with reports of other groups [33–35]. A linear dependence of Tc on the crystallographic a-axis was also found for Ba(Fe,Co)2As2 thin films [28]. However, FeSe0.7Te0.3 has a much steeper slope. The high sensitivity to strain in the FeSe system can be attributed to the presence of shallow Fermi pockets (with small Fermi energy εF) [34]. The strain shifts slightly the position of the bands with respect to the chemical potential resulting in a considerable change of the small εF value or even the appearance of a Lifshitz transition [34]. These changes of the electronic structure can affect Tc as was demonstrated before for the 122 system [30]. This allows us to vary Tc of the FeSe0.7Te0.3 films significantly solely by in-plane strain.

Figure 2. Relation between Tc and the a-axis lattice parameter for a series of the FeSe0.7Te0.3 films on different substrates. Some of the data are taken from [21]. The line is a guide for the eye. The data of Ba(Fe,Co)2As2 thin films from [28] are also plotted. Reprinted from [21], with the permission of AIP Publishing. © Author(s) 2017. CC-BY 4.0 https://creativecommons.org/licenses/by/4.0/.
Download figure:
Standard image High-resolution image3.2. Upper critical fields near Tc
Figure 3 shows Hc2 for the films on different substrates as a function of Tc for fields parallel to the c axis (the data for additional films can be found in figure A3(e) in the appendix) with 90% criteria for Tc. To describe the Hc2 curves for the FeSe0.7Te0.3 compound, the spin paramagnetic and the orbital pair-breaking effects should be taken into account [36–38]. A commonly used approach is the WHH theory generalized for multiband superconductors [39]. However, for the reliable determination of the paramagnetic and multiband effects, this analysis requires Hc2 values in a broad temperature range. Due to very high Hc2 values of this compound, only the data near Tc are accessible in our experiments. Therefore, we used alternatively an analysis based on the Ginzburg–Landau theory, which provides a simple analytical expression for the temperature dependence of Hc2(T) near Tc [40–42]. Hc2 and its slope near Tc can be estimated by the following equation:

where t = T/Tc is the reduced temperature and Hc2(0) is the upper critical field values extrapolated to T = 0. We fitted our Hc2 data using equation (1), as shown by the dashed line in figure 3. The slope −dHc2/dT at Tc is defined using equation (1) at t = 1 (figure 4). The analysis including paramagnetic effects results in quantitative changes of the slope (see figure A4 in the appendix) [43]. However, the functional dependence of the slope on Tc is qualitatively unchanged (figure 4 below and figure A4) in spite of relatively strong paramagnetic effects with the Maki parameter αM =  given in inset of figure A4 in the appendix, where
  is the orbital limited upper critical field and Hp is the paramagnetic critical field. We found also that αM ∝ Tc in accord with the scaling behavior of Hc2 discussed in the next section. The large values of the αM are consistent with previous studies of the FeSe1−xTex system [44].

Figure 3. Temperature dependence of the upper critical field Hc2 with the field applied parallel to the c axis for FeSe0.7Te0.3 films with various Tc. The dashed lines show the fits based on equation (1).
Download figure:
Standard image High-resolution image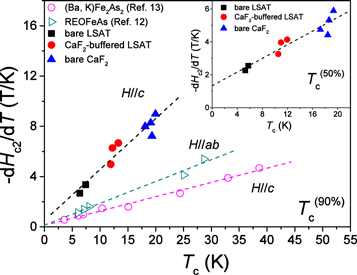
Figure 4. Dependence of the slope −dHc2/dT on Tc for the FeSe0.7Te0.3 films using 90% criteria for Tc. The data obtained using the same criteria for Tc of (Ba,K)Fe2As2 single crystals and REOFeAs are also plotted [12, 13]. The dashed lines are a guide for the eye. Inset: dependence of the slope −dHc2/dT on Tc for the FeSe0.7Te0.3 films using 50% criteria for Tc.
Download figure:
Standard image High-resolution image3.3. The slope of Hc2 at Tc interpreted by a single-band model
The derivative of the upper critical field with temperature −dHc2/dT versus Tc is shown in figure 4. As can be seen, the slope −dHc2/dT of FeSe0.7Te0.3 thin films depends almost linearly on Tc in accordance with the behavior −dHc2/dT ∝ Tc found in some other pnictides [12, 13]. We note that the choice of criteria does not change the observed linear dependence qualitatively. The −dHc2/dT data using 50% of the resistance in the normal state as the criterion of Tc is shown in the inset of figure 4. In contrast to the 90% criterion, the slope does not reach zero by an extrapolation to Tc = 0, which indicates that −dHc2/dT is affected by additional Tc independent contributions (such as sample inhomogeneity) not related to Hc2. Therefore, for further analysis we focused on the data obtained with the 90% criterion.
A linear behavior of −dHc2/dT ∝ Tc/νF2 is expected for a single-band superconductor in the clean limit, if the Fermi velocity (νF) is the same for different samples [39]. For our samples, the linear relation between Tc and lattice parameters (figure 2) indicates that the mechanism for a Tc suppression is related to the modification of the electronic properties, which should result in a variation of νF with strain. Therefore, for a clean limit we expect a deviation from the linear behavior −dHc2/dT ∝ Tc. In a dirty limit, the slope −dHc2/dT ∝ 1/D of an s-wave superconductor is independent on Tc, where D is an effective diffusivity constant [45]. It is known that Tc of a single-band s-wave superconductor can be suppressed by magnetic impurities. However, smaller D values (stronger impurity scattering) result in a lower Tc and higher −dHc2/dT in contrast to the experimental observations. Therefore, for our films effectively a single-band s-wave superconductivity cannot reconcile the whole set of the experimental data.
3.4. The slope of Hc2 at Tc interpreted by a two-band model
In the case of superconductivity driven by a single leading interband interaction such as s±, the minimal model that describes the system close to Tc is a two-band model [46]. The most of available experimental data are consistent with this picture. So far we have found that only hole overdoped Ba1−xKxFe2As2 system that breaks time reversal symmetry in the superconducting state cannot be described by a two-band model [47]. In this case, a three-band model is needed to describe the superconducting properties [48]. However, general scaling behaviors do not hold in this case (see introduction in [47]). Therefore, the observed university in scaling behavior of Hc2 relates our FeSe0.7Te0.3 films to the majority FBS with superconductivity driven by a single leading interband interaction.
It was shown that the pair-breaking parameters do not alter the slope for dirty superconductors with a sign changed order parameter such as s± superconductors and for two symmetrical bands the slope is −dHc2/dT ∝ Tc/ where Ω is the variation of the gap along the Fermi surface [12, 16]. The symmetrical case can be excluded due to the expected variation of the Fermi velocity with strain, which results in a deviation from the linear behavior. The symmetrical case is also inconsistent with the available angle-resolved photoemission spectroscopy (ARPES) data [49]. The effect of impurities on a realistic s± superconductor (non-symmetrical bands and non-zero intraband coupling) is rather complex and results for strong enough impurities in a transition to the s++ superconducting state [50]. Therefore, an interpretation of the observed linear behavior based on a strong pair breaking effect is also doubtful for the 11 system.
In a clean two-band s-wave superconductor, the slope of Hc2 is defined by a combination of the Fermi velocities and coupling constants for different bands:

where  and
and  are constants, which depend on the intraband λ11, λ22 and interband λ12, λ21 coupling constants [39]. a1 ∼ a2 holds in the case of an extreme s± superconductivity with the dominant interband coupling, which presumably is the case for FeSe1−xTex [51, 52], and
  for an extreme s++ case with the dominant intraband coupling. The latter can be excluded based on the arguments for a single-band case since the leading band dominates the superconducting properties close to Tc. In the case of strong interband coupling, the universal behavior −dHc2/dT ∝ Tc would indicate that the combination
  is nearly strain independent. It is known that the value of the Fermi velocities considerably varies between different bands in the 11 system [49]. Therefore, according to equation (2), −dHc2/dT is dominated by the fastest Fermi velocity assuming sizeable interband coupling, which is expected in the case of the strongly anisotropic sign change superconducting gap [50, 51] or special s++ case [53]. The linear scaling indicates that the fastest Fermi velocity is weakly sensitive to strain assuming a weak variation of the coupling constants with strain. In this case, Tc is mainly defined by the band/bands with low Fermi velocities forming small Fermi surface pockets. This is consistent with empirical conclusions based on the ARPES measurements of various pnictides [54]. The universality of the observed scaling −dHc2/dT ∝ Tc for different FBS imposes constrain on the possible pairing mechanism and indicates a key role of the interband interactions.
4. Summary
The superconducting transition temperature of FeSe0.7Te0.3 films can be significantly modified solely by in-plane biaxial strain. We observed that the slope of the upper critical field of the strained films is proportional to Tc as found for other classes of FBS materials. The behavior observed indicates a striking similarity in the nature of superconducting state between the FeSe1−xTex system and iron pnictides. This also suggests that the behavior −dHc2/dT ∝ Tc may be a generic property of multiband superconductors paired by a dominant interband pairing potential.
Acknowledgments
The authors thank S-L Drechsler, D Efremov and A Maeda for fruitful discussions and M Kühnel, U Besold for technical support. The research leading to these results has received funding from the National Science Foundation of China (Grant No. NSFC-U1432135, 11674054 and 11611140101) and Open Partnership Joint Projects of JSPS Bilateral Joint Research Projects (Grant No. 2716G8251b), the JSPS Grant-in-Aid for Scientific Research (B) Grant Number 16H04646 and the DFG funded GRK1621. VG is grateful to the DFG (GR 4667) for financial support. The publication of this article was funded by the Open Access Fund of the Leibniz Association.
Appendix
Appendix. A.1. Structural properties
The structural properties and composition of the films were analyzed using TEM. The data for the two representative films are shown in figure A1 indicating a homogeneous stoichiometry over the film thickness.
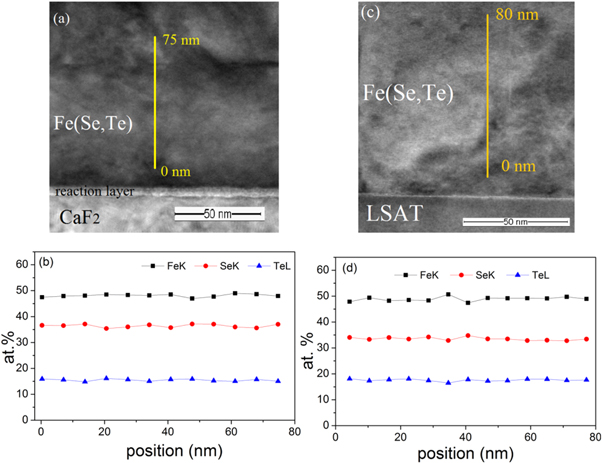
Figure A1. (a) Cross-section of the film on bare CaF2. The results for an EDX line scan along the yellow line are shown in (b). The stoichiometry is homogeneous over the film thickness. (c) Cross-section of the film on bare LSAT. The results for an EDX line scan along the yellow line are shown in (d). The composition of the films is FeSe0.7Te0.3 within the error-bars of the analysis for all studied substrates.
Download figure:
Standard image High-resolution imageAppendix. A.2. Electrical resistance
In this section, we provide additional electrical resistivity data (not shown in the main text) measured in zero and applied magnetic field.

Figure A2. The normalized temperature dependence of the resistance in zero magnetic field for the samples shown in figure 1 over a large temperature range. The value of the residual resistivity ratio is nearly substrate independent.
Download figure:
Standard image High-resolution imageAppendix. A.3. Hc2 analysis
To take into account paramagnetic pair-breaking effects we used an analysis based on the Ginzburg–Landau theory, which provides a simple analytical expression for the temperature dependence of Hc2(T) near Tc including paramagnetic effects [43]. As shown by Mineev et al Hc2 can be calculated for clean single-band superconductors using the following equation:

where Tc is the critical temperature at zero field and 

 Here,
Here,  is the density of states at the Fermi level, vF is the Fermi velocity and μ is the magnetic moment.

Figure A3. The resistive transition of additional FeSe0.7Te0.3 films on (a) bare LSAT, (b) and (c) CaF2-buffered LSAT and (d) bare CaF2 in magnetic fields up to 9 T for H ∣∣ c. The dashed line indicates the extrapolation of the normal state resistance. The lowest Tc is measured for the films on bare LSAT substrate. (e) The temperature dependence of the upper critical fields Hc2 for field parallel to the c axis for FeSe0.7Te0.3 films with various Tc. The dashed line shows the fits based on equation (1) in the main text.
Download figure:
Standard image High-resolution imageThe slope −dHc2/dT at Tc is given by:

with the Maki parameter defined as:

Substituting equations (A.2) and (A.3) to equation (A.1) we obtain

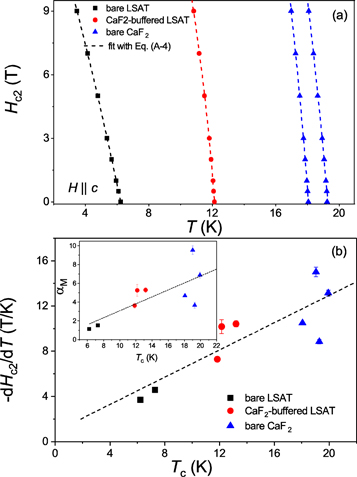
We fitted our upper critical field data using equation (A.4), as shown by the dash line in figure A4. The obtained slope of the upper critical field −dHc2/dT is shown in figure A4 and the Maki parameter in the inset. Both quantities are proportional to Tc as expected (see also main text) [39].
Figure A4. (a) The temperature dependence of the upper critical fields Hc2 for fields parallel to the c axis for FeSe0.7Te0.3 films with various Tc. The dashed line shows the fits based on equation (A.4). (b) Dependence of the slope −dHc2/dT on Tc for the FeSe0.7Te0.3 films obtained by equation (A.4). The dashed lines are a guide for the eyes. Inset: dependence of the Maki parameter αM on Tc. The analysis including paramagnetic effects results in quantitative changes of the slope. However, the functional dependence of the slope on Tc is qualitatively unchanged.
Download figure:
Standard image High-resolution image