


Abstract
Strongly interacting finite ensembles of dipolar bosons in commensurately filled one-dimensional optical lattices exhibit diverse quantum phases that are rich in physics. As the strength of the long-range boson–boson interaction increases, the system transitions across different phases: from a superfluid, through a Mott-insulator and a Tonks–Girardeau gas to a crystal state. The signature of these phases and their transitions can be unequivocally identified by an experimentally detectable order parameter, recently described in Phys. Rev. A 98 235301 (2018 [33]). Herein, we calculate the momentum distributions and the normalized Glauber correlation functions of dipolar bosons in a one-dimensional optical lattice in order to characterize all their phases. To understand the behavior of the correlations across the phase transitions, we first investigate the eigenfunctions and eigenvalues of the one-body reduced density matrix as a function of the dipolar interaction strength. We then analyze the real- and momentum-space Glauber correlation functions, thereby gaining a spatially and momentum-resolved insight into the coherence properties of these quantum phases. We find an intriguing structure of non-local correlations that, independently of other observables, reveal the phase transitions of the system. In particular, spatial localization and momentum delocalization accompany the formation of correlated islands in the density as interactions become stronger. Our study showcases that precise control of intersite correlations is possible through the manipulation of the depth of the lattice, while intrasite correlations can be influenced by changing the dipolar interaction strength.

Original content from this work may be used under the terms of the Creative Commons Attribution 3.0 licence. Any further distribution of this work must maintain attribution to the author(s) and the title of the work, journal citation and DOI.
1. Introduction
Ultracold atoms with dipole–dipole interactions have become a popular tool to simulate and understand the physics of long-range interacting systems [1, 2]. The experimental realization of quantum gases having a dipole–dipole interaction has been achieved with atoms having permanent magnetic dipole moments, such as chromium [3, 4], dysprosium [5] and erbium [6] as well as with polar molecules, for instance, potassium-rubidium [7] and cesium-rubidium [8]. Owing to the long-range and anisotropic nature of dipole–dipole interactions, novel quantum effects not present in atoms with contact interactions emerge. Prominent examples include the elongation of the condensate along the orientation of the dipole moments [9–11] and the exciting phenomenon of geometrical stabilization [2] of a dipolar Bose–Einstein condensate in traps of certain shapes, like extremely oblate ones [9, 10, 12–14]. More recently, the fascinating formation of quantum droplets in dipolar condensates has been observed and then theoretically studied [15–18].
In ultracold systems, the dimensionality is an experimental control-parameter and crucially important: lower-dimensional systems often produce a variety of effects not seen in three spatial dimensions. The occurrence of p-wave superfluidity in two-dimensional Fermi gases [19, 20] provides such an example. Dipolar atoms in quasi-one-dimensional traps are more amenable experimentally since the collisional instabilities arising from the head-to-tail alignment in two and three spatial dimensions are prevented [14, 21]. Unidimensional dipolar atoms have been predicted to exhibit Luttinger liquid-like behavior [22–25] as well as anisotropic effects in curved and ring geometries [26–28]. Moreover, for very strong dipolar interactions a remarkable crystallization effect takes place where the dipolar atoms themselves form a crystal lattice structure irrespective of the geometry of their external confinements [22, 26, 29–33].
Optical lattices often serve as a controllable toolbox to understand and simulate a large variety of condensed matter systems. For dipolar atoms, the additional existence of the long-range anisotropic interactions leads to a plethora of interesting quantum phases arising from the interplay of the kinetic energy, the short and long-range interactions, each dominating different energy scales [2]. Density waves [34, 35], Haldane insulators [35, 36], checkerboard patterns [34, 37] and Mott solids [38] are some prominent examples of these phases.
In our study, we consider a system where four different phases are amalgamated: superfluid (SF), Mott insulator [39], fermionized Tonks–Girardeau gas [40–43] and a crystal-like state [26, 31, 43] can each emerge in a finely tuned system of few dipolar bosons in a multi-well trap. Superfluidity appears due to the bosonic nature of the particles combined with their weak interactions. A finite well depth together with somewhat stronger interactions breaks superfluidity and leads the system to behave as a so-called Mott-insulator (MI) [44, 45]. For moderately strong interactions, the system mimics the boson-to-fermion mapping, that is known to apply exactly at the infinite-strength limit of contact interactions as well as finite-size hard-rod interactions [46]. In this Tonks–Girardeau limit, the particles isolate themselves from their neighbors in order to avoid infinities in the interaction energy. Thus the bosonic density approaches that of its non-interacting fermionic counterpart. Nevertheless, the momentum density of the bosonic system is still distinct [46]. We remark here that an exact Bose–Fermi map for long-range dipolar interaction also exists, exploiting the divergence of the dipolar interaction at zero separation [30, 31]. This dipolar Bose-Fermi map implies that bosons with strong dipolar interactions and fermions with strong dipolar interactions have identical one-body densities and identical one-body momentum densities. Last, for even higher interaction strengths, the long-range tail of the interaction dominates and leads to the formation of the so-called crystal phase [22, 26, 29–33].
Herein we follow the same strategy as [47–49] and theoretically investigate, the physics of a larger many-body system by studying in detail its few-body building blocks. Although few-body systems with dipole–dipole interactions have not been studied experimentally as of yet, the experimental realization of tunable few-fermion systems [47–49] motivates our theoretical study of a small ensemble of dipolar bosons. Moreover, our results for the few-atom system can be generalized to larger systems (see appendix A). We investigate a system of dipolar bosons in an optical lattice by studying the triple-well potential. Theoretically, dipolar atoms in triple-well traps have been explored using mean-field methods [50], the extended-Bose–Hubbard model (BHM) [51–56] and also the multi-configurational time-dependent Hartree (MCTDH) method [32]. Notably, the mean-field methods and BHM are unable to address very strong dipolar interactions. It is thus necessary to employ a general many-body approach for the cases where the strong dipolar interactions dictate the physics of the system.
The MCTDH for bosons (MCTDHB) [57, 105] is such a general many-body method capable of addressing strong interaction regimes [58–62] and its implementation in the MCTDH-X software [63–65] has been employed in [33] to establish an order parameter and an experimental method to classify and detect all the quantum phases of dipolar atoms in optical lattices via single-shot images.
In this paper, we explore the transitions across the above-mentioned four phases by varying the interaction strength and then analyze the normalized Glauber correlation functions to unveil the coherence properties of each phase. We show how the system can be brought to any desired phase and how the transitions are reflected in the correlation landscape in coordinate and momentum space. We observe distinct structural changes in the correlations that accompany the phase transitions and clearly characterize the phases and their transitions. We stress here that the focus of this work is different from that of [33]. While in [33], an order parameter and its experimental detection via single-shot images was the prime motivation, here we take the emergence of these phases as the starting point and focus on their correlation and coherence properties in coordinate and momentum space.
We remark that the few-body finite-size system studied here cannot exhibit true phase transitions in the macroscopic sense. What we obtain are ground states that are the finite-size precursors to the macroscopic thermodynamic phases [66]. For the sake of simplicity and as an analogy to the thermodynamic systems, we still use the term 'phase' to refer to them.
This paper is structured as follows: section 2 introduces the Hamiltonian and quantities of our interest. Section 3 discusses the eigenfunctions and eigenvalues of the reduced one-body density matrix for the emergent phases. Section 4 presents an analysis of the normalized Glauber correlation functions. Section 5 discusses the effect of lattice depth and section 6 provides an outlook concluding our work.
2. Model
Our system consists of N polarized, dipolar bosons of mass M in a one-dimensional optical lattice and is governed by the Hamiltonian

The one-body potential Vol represents a quasi-one-dimensional optical lattice potential, modeled as . Here, V is the depth of the lattice and κ its wave number. In order to confine the bosons to a desired number of sites, we impose a hard wall boundary condition at x = ± Sπ/2κ where S is the number of lattice sites (for odd S). A strong transverse confinement of characteristic length a⊥ ensures that the system is quasi-one-dimensional by preventing excitations in the transverse direction.

We consider a pure dipole–dipole interaction where the interaction potential can be written as . For large separations , the interaction potential varies as . For small separations , the transverse confinement induces a short-scale interaction cutoff , thus regularizing the divergence at xi = xj [31, 67, 68]. Here gd is the dipolar interaction strength, given as for electric dipoles and as for magnetic dipoles, dm being the dipole moment,  0 the vacuum permittivity and the vacuum permeability. In order to obtain universal dimensionless quantities we rescale equation (1) in terms of the recoil energy effectively setting ℏ = M = κ = 1. All quantities become dimensionless with the length given in units of κ−1.


We remark that, generally, the dipole–dipole interaction potential in 1D also includes a contact (Dirac delta) term owing to the transverse confinement [31, 67, 68]. However, in order to examine the effect of the finite-range interaction alone, we set the contact interaction term equal to zero. In an experiment, this could be achieved via management of Feshbach resonances.
We obtain the ground states of the dimensionless Hamiltonian using the imaginary time-propagation of the MCTDHB equations of motion [57]. For the system studied, seven orbitals are sufficient to obtain converged solutions for the superfluid, Mott-insulating, and crystal phases. Our motivation is to understand the many-body physics from finite size few-body elemental building blocks and so it is necessary to consider a minimal system that displays all the fundamental physics. We thus consider a triple well setup (S = 3) with N = 6 since it represents the minimal setup to understand all the relevant physics for the dipolar boson in an optical lattice. Similarly, we choose the barrier height V = 8 and short-range cutoff α = 0.05 such that the emergent physics are exhibited distinctly. A setup with these values is within experimental feasibility. Our results are fundamental, and they can be readily generalized for larger systems, as we demonstrate in appendices A, B, and C.
3. Natural orbitals, natural occupations and quantum phases
While, in principle, the wavefunction contains all information about a quantum system, the aspects of correlations are better assessed through the reduced density matrix (RDM). Considering an N-particle state , the pth order RDM is obtained by tracing N − p degrees of freedom [69, 70] as:


For , we obtain the 1st order or one-body RDM


where Ψ ≡ Ψ(x1, ..., xN) is the many-body wavefunction and the field annihilations (creation) operator in 1D position space.

In the following, we analyze the one-body RDM expanded in its eigenfunctions as:


The eigenfunctions φi are called natural orbitals and the corresponding eigenvalues λi are called natural occupations. Each λi represents the population of the ith orbital. The spectral decomposition of the one-body RDM is particularly useful since it serves to define Bose–Einstein condensation (BEC) in an interacting many-body system: if the largest natural occupation is of the order of the number of particles N, the system is said to be condensed [71]. If there are more than one natural orbitals with populations of order N then the system is said to be fragmented [72–74, 106–111].
The natural orbitals and their populations are very important in characterizing the phases occurring for dipolar bosons in an optical lattice. The natural occupations directly relate to the emerging phases of strongly interacting dipolar bosons [33, 61, 75]. Figure 1 displays the evolution of the natural occupation as a function of interaction strength gd.

Figure 1. Eigenfunctions and eigenvalues of the reduced one-body density matrix as functions of the dipole–dipole interaction strength. (a) Normalized natural occupations λl/N (plotted cumulatively) as functions of the interaction strength gd. The region is in linear scale. The region is plotted in logarithmic scale. For weak interaction only one orbital is populated and the system is condensed and superfluid (SF). For moderately strong interactions, the first three orbitals are occupied, reaching equal population λl/N ≈ 1/3 and the system is in the Mott-insulating phase (MI). For strong interactions, 6 orbitals become equally populated, i.e. λl/N ≈ 1/6 and the system is in the crystal phase (CS). (b) Natural orbitals scaled by natural occupations, , as a function of gd on log-scale. φ1 shows the mean-field condensate contribution and has a higher concentration in the central well at small . The combination of orbitals φ1,2,3 is necessary to show the SF-MI transition. The orbitals φ4,5,6 are occupied only for strong dipolar interactions and primarily contribute to the splitting in each well; this intrawell splitting is a hallmark of the breakdown of the Hubbard model and the emergence of the crystal state.


Download figure:
Standard image High-resolution imageIn a conventional BEC with contact interactions, the interplay between contact interactions, potential and kinetic energy determines the quantum properties [44, 45]. For dipolar bosons, the additional long-range interactions make it a four-way competition between the kinetic and potential energy, the short-range and the long-range interactions that lead to the existence of various phases at different energy scales [33, 76]. When the interaction is very small () the kinetic energy dominates, thus leading to a SF phase. Here, the system forms a BEC since only the first natural orbital is macroscopically populated. Hence, in this region λ1 ≈ N. As gd increases the interaction energy starts to dominate over the kinetic energy and the system arrives at the MI phase [39, 45, 61, 77–79]. In the MI phase, the bosons are localized inside each well and occupy S (i.e. a number equal to the number of sites) orbitals equally, hence λi = N/S. At the same time tunneling between the lattice sites is strongly reduced [33]. As gd increases further, the long-range effect of the interaction now affects the many-body state and the crystal phase is reached [26, 31, 43]. The already localized bosons in each well maximize their spatial separation due to the strong repulsion. The one-body RDM shows maximal fragmentation with N orbitals equally populated, i.e. λi = 1, i = 1, ..., N. The formation of the crystal phase is driven only by the long-range interaction potential and is independent of the lattice potential Vol.

Note that the TG gas acts as an intermediate step in the MI CS transition. Unlike the SF, MI and CS states, a universal behavior of the natural occupation does not exist for the TG gas. Here, the highest natural occupation λ1 scales as N−1/2 (N being the particle number) [81]. Thus, the formation of the TG gas cannot be determined by the natural occupations alone. Nevertheless, the TG gas can be distinguished by its density and correlation signatures. Interestingly, for a vanishing cutoff , one cannot obtain an interacting SF state or an MI state. When , the interaction diverges at xi = xj, thus any non-zero gd will result in the system being either a TG gas or a super-Tonks Gas depending on the interaction sign and density [30, 31, 82]. Since we have a non-zero cutoff α, the divergence at xi = xj is avoided and we can get both SF and MI phases by suitably changing gd. We remark here that Bloch oscillations in the absence of a lattice have recently been observed in a Tonks gas [80].


We remark that the BHM cannot describe the crystal phase. The BHM employs a tight-binding approximation to construct a site-localized Wannier basis. The BHM cannot describe structures smaller than the lattice spacing since the localized on-site Wannier basis are single-particle functions that do not show the nodal structures that result from strong dipolar interactions. The single-band BHM cannot describe the physics when the energy becomes comparable to the higher bands [83]. The crystal phase occurs for very strong dipolar interactions where the contribution of the higher bands cannot be neglected and the many-body wavefunctions possess structures smaller than the lattice spacing. Thus the single-band BHM cannot describe the crystal phase and its transition.
Moreover, for strong dipolar interactions, the interaction energy dominates the potential energy; the crystal formed by the bosons can therefore have a 'lattice constant' that depends on the interaction strength. The physics of such a crystal cannot be cast into a model where the basis is localized in space and the corresponding lattice constant is fixed irrespective of the interaction strength, as done in the single-band and multi-band BHM. To represent the many-body state using a multi-band BHM for a system where the lattice sites are not aligned with the actual positions of the particles, a very large number of bands becomes necessary quickly. Thus, even the multi-band BHM—albeit a formally exact description when an infinite number of bands is allowed—is not the method of choice for the crystal state at large dipole–dipole interaction strengths.
The following schematic picture qualitatively illustrates the basic mechanism of fragmentation and fermionization for six particles in a triple well. At the non-interacting limit, the ground state is in a single superposition ϕGP of the three modes (ϕl, ϕc, ϕr) that are localized in the left, center and right wells, respectively. The existence of hard walls at the border of our potential breaks the translational invariance of the Hamiltonian and so the central well is slightly denser compared to the other two. Neglecting this asymmetry, the particle configurations (i.e. distributions of bosons across the wells) are degenerate energetically. The bosonic superposition ϕGP is coherent and the ground state is condensed and SF. In other words, a single orbital is enough to describe the ground state of the many-body system, as the product state . Now consider a small but finite interaction parameter gd. If the lattice sites are firmly separated from each other via sufficiently high barriers then the orbitals ϕl , ϕc , ϕr are not overlapping. In that case, the threefold fragmented state is energetically favorable for any finite interaction strength against since the fragmented configuration minimizes the interaction energy (see also [84]). Hence, for large barrier heights V, a tiny interaction among the particles disrupts condensation in favor of fragmentation. The threefold shape of the trap determines that the number of significantly occupied orbitals is three. For a total number of N = 6 particles, two particles occupy each lattice site of the trap. For a further growth of the interaction, each of the two particles in the same site starts to repel its neighbor considerably; the orbitals now tend to avoid overlap in order to minimize the (otherwise increasing) interaction energy. This is the onset of fermionization, i.e. a density profile where bosons mimick a non-interacting fermionic density. For higher gd, where the long-range tail of the interaction potential begins to dominate, we enter the crystal phase where the orbitals completely dissociate and each boson occupies a separate orbital, giving rise to a six-fold fragmented state. Here, the particle distribution and orbital shape are determined by the long-range interaction solely and not the lattice potential.


The above picture with single-configurational states is certainly oversimplified since the interactions change the shape of the natural orbitals along with their occupations (figure 1(b)). For finite interactions, there is a substantial intermixing of the non-interacting orbitals, which is parity preserving and thus a numerically exact solution must be sought. However, the above line of thought illustrates the idea of the emergence of the different phases and their relation to fragmentation.
In figure 1(b) we plot the evolution of the natural orbitals φi(x) scaled by the natural occupations λi with the interaction strength gd. The orbital φ1 exhibits the mean-field condensate physics at small interaction strengths. For weak interactions, it shows the larger center-well population expected in the SF phase. However, it is unable to predict the equalizing of populations across the three wells in the MI and crystal phases. While φ1 alone captures the mean-field perspective, all three lowest orbitals φ1,2,3 are necessary to account for the SF-MI transition and, thus, to understand the single-band Bose–Hubbard picture. In other words, the system fragments with equal natural occupations λ1, λ2, λ3 across the three natural orbitals whose density maxima are located at the minima of each well. For strong gd, φ2 and φ3 show a splitting of the outer maxima. The higher orbitals φ4,5,6 contribute significantly only at the strongly interacting crystal regime. The primary feature of the latter is the enhancement of the intrawell (i.e. referring to the same well) splitting at strong interactions. Most importantly, the crystal phase is realized by the equal contribution of N natural orbitals [33].
4. Correlation functions and quantum phases
We now discuss the many-body coherence and correlation properties of the system in its distinct phases. To this end, we assess the coordinate and momentum space correlations in the state , by studying the 1st and 2nd order Glauber correlation functions [70].

4.1. Spatial 1st order correlations
The 1st order Glauber correlation function

is constructed by normalizing the one-body RDM (equation (3)) to a product of the respective one-body densities. It measures the proximity of the many-body state to a mean-field state in which (i.e. uniform anti-diagonals) [61, 64, 65, 69, 85–87]. g(1) is generally a complex quantity (for ground states it is typically real) and is associated with phase coherence, which can be accessed through interference experiments [88–91]. g(1) is bounded within [0, 1], with implying perfect coherence and the complete absence of it. By construction, the diagonal of is always equal to unity, so the coherence investigation needs to be done on the off-diagonal: 1st order coherence between any two points denotes off-diagonal long-range order (ODLRO) [104].


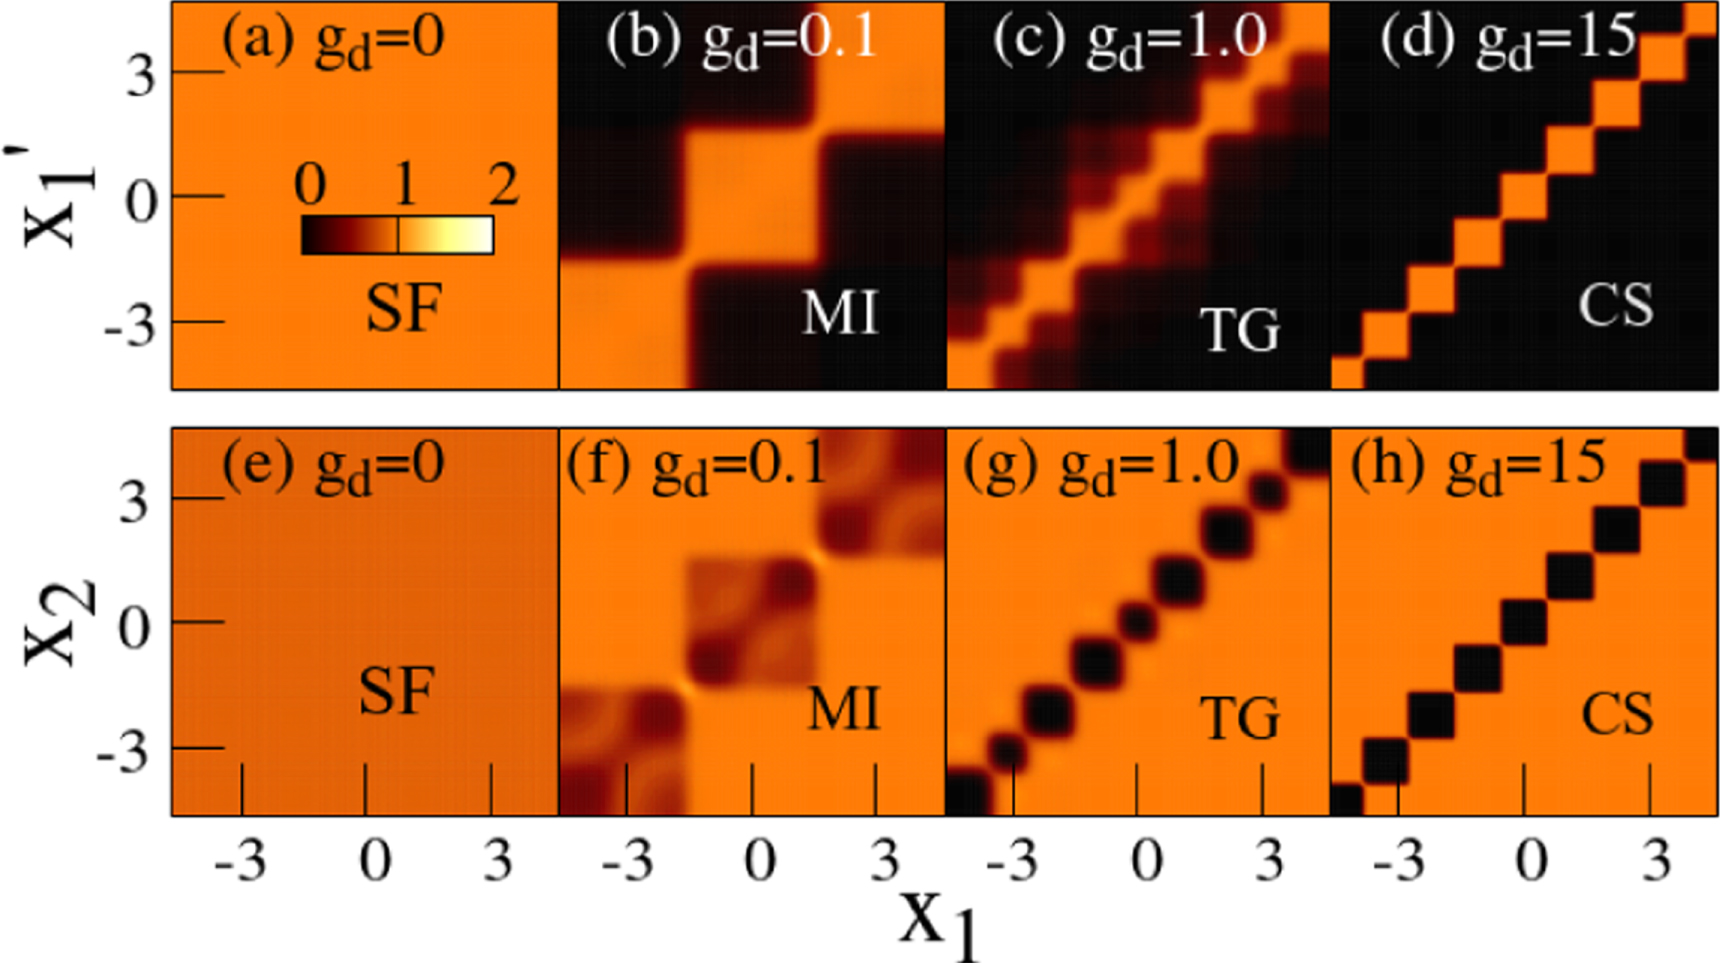
Figure 2 displays for various interaction strengths that correspond to the emerging distinct phases. For gd = 0 the bosons are delocalized over the whole lattice and are fully coherent. The many-body state is exactly described by a mean-field product of a single orbital ϕGP (see also discussion in section 3). The complete coherence is reflected in the uniform distribution of throughout the lattice. As the interaction is switched on, the ODLRO is disrupted, thus reflecting the particle localization at each well. In an MI state at gd ≈ 0.1, the bosons are completely localized and, as a consequence, coherence is strongly reduced; now shows a strong off-diagonal reduction. However, the localization is still partial, since inside each well, the two residing atoms are delocalized and exhibit relative coherence. This intrasite delocalization and coherence is seen in the block-diagonal form of in figure 2(b). Here, each coherent block, occupying a space of roughly square units, pertains to each lattice site.


Figure 2. (a)–(d): The 1st order spatial correlation function and (e)–(h): the 2nd order correlation function , shown for all emergent phases. At gd = 0, the bosons are coherent, a fact reflected in the uniform distributions: and everywhere. For the Mott insulator (gd = 0.1), the bosons are completely localized in each well and thus the long-range off-diagonal coherence is destroyed: first-order coherence is restricted to individual lattice sites while second-order coherence is characterized by particle bunching on the off-diagonal, i.e. where x1 and x2 are positions in different sites and anti-bunching within individual lattice sites, i.e. for x1 ∼ x2. For larger values of gd the intrawell first-order coherence decreases further. Also, the anti-bunching within sites is augmented ( for x1 ∼ x2) while the bunching between distinct sites disappears as the interaction strength increases ( for positions x1 and x2 in distinct sites). All units shown are dimensionless.


Download figure:
Standard image High-resolution imageAs the interaction strength gd increases, its short-range portion dominates6 , leading to a fermionization-like behavior of the bosons [40–43] and a reduction of the intrawell coherence. At gd = 1.0, which falls in this Tonks–Girardeau-gas-alike regime, one can already see the off-diagonal contribution vanishing (figure 2(c)).
For a further rise of the interaction strength gd, the long-range tail of the interaction begins to dictate the physics. The influence of the strong long-range tail of the interaction potential forces the localized bosons maximally apart, thus avoiding each other. As a consequence, the coherence decreases even further.
Last, the system enters the crystal phase at gd = 15, where complete fragmentation characterizes the state. The bosons are entirely localized even within wells, and the intrawell coherence is zero. The coherence blocks of are now centered at each boson location (figure 2(d)). At the crystal phase, the bosons maximize their interparticle distance and do no longer necessarily obey the external lattice spacing. This independence of the lattice spacing is seen, for instance, in the reduced size of the outermost blocks on the diagonal of g(1) () where g(1) ≈ 1 in figure 2(d) as compared to figure 2(c). The absence of off-diagonal coherence reflects the complete coordinate-space localization. Exceptionally, coherence marginally remains at a small region around the diagonal.


4.2. Spatial 2nd order correlations
The second-order RDM quantifies the correlations between two particles, with its diagonal kernel representing the probability of the simultaneous detection of a particle at x1 and another particle at x2.


By normalizing in terms of products of the respective one-body densities, we obtain the 2nd order Glauber correlation function


which quantifies the 2nd order coherence in the system. Hereafter, we use the diagonal .

We would like to stress the fact that ρ(2)(x1, x2) and g(2)(x1, x2) provide distinct information about the physics of the state. ρ(2)(x1, x2) gives the spatial two-body probability distribution, but provides no information about the coherence. In contrast, g(2)(x1, x2), the second-order normalized Glauber correlation function, contains essential information about the coherence properties of the system that cannot be observed solely from ρ(2)(x1, x2); second-order coherence [g(2)(x1, x2) = 1] implies that the two-body density is just a product of one-body densities, i.e. ρ(2)(x1, x2) = ρ(1)(x1, x1) ρ(1)(x2, x2), while second-order incoherence implies that ρ(2)(x1, x2) contains information that cannot be extracted from ρ(1) alone. The discussion of the two quantities, ρ(2)(x1, x2) and g(2)(x1, x2), is thus independent. An analogous argument holds for the momentum space representation of the normalized Glauber correlation functions that we discuss in the following section.
![$[{g}^{(2)}({x}_{1},{x}_{2})\ne 1]$](https://content.cld.iop.org/journals/1367-2630/21/3/033030/revision2/njpaafa93ieqn55.gif)
For weak interactions (gd ≈ 0) the state is at the SF phase yielding , a fact that demonstrates 2nd order coherence and the absence of any correlation in the measurement of the positions of any pair of bosons, figure 2(e). In general, a SF phase shows Nth order coherence [69] and any p-particle detection probabilities are not correlated. As the interaction increases, the diagonal of displays regions with anticorrelations (figure 2(f)) thus demonstrating loss of second-order coherence and localization, or else anti-bunching. In analogy to photon count statistics (see [93] and references therein), we use here the term (anti-)bunching to denote (decreased) increased value of g(2)(x1, x2), as compared to unity. In the context of quantum optics, (anti)correlated emission events determine the detection probabilities and their distributions. Similarly, two bosons will bunch together and, hence, localize if . At the MI state, an anti-bunching block covers each lattice site, marking lack of second-order coherence between the localized bosons in each site. For stronger interactions, the localized bosons within a site form intrawell correlation holes (see figure 2(g)). These intrawell structures are the key signature of higher-band effects that manifest both in the intermediate fermionization effect at gd = 1 (figure 2(g)) and the emergence of the crystal phase at gd = 15 (figure 2(h)). While the diagonal pattern of shows no significant differences between the gd = 1.0 and the gd = 15 cases, the off-diagonal shows a significant reduction at gd = 15. Furthermore, the outermost antibunching blocks on the diagonal of g(2) are reduced in size and all blocks no longer aligned with the minima of the external lattice potential. Thus, the second-order correlations in figures 2(g), (h) display the emergence of extreme localization and dominating long-ranged interactions characteristic for the crystal phase.


4.3. Momentum correlations
We complement our investigations of the spatial correlations by analyzing the correlations of the state Ψ in momentum space. is found from the reduced densities of the Fourier transformed many-body state . We remark that the diagonals of the momentum correlations () depend on the off-diagonals of the respective coordinate-space correlations () and therefore yield additional information about the structure of the state that is not seen in the diagonals [69]. In the following, we will drop the tilde for simplicity.


4.3.1. 1st order momentum correlations
We normalize the 1st order RDM in momentum space with the local momentum densities and obtain the 1st order Glauber momentum correlation function

Figure 3(a)–(d) shows for the various emerging phases. At gd = 0, the system is fully coherent and g(1) has a constant value throughout k-space. This corroborates our observations of the coordinate-space correlations in figures 2(a), (e). As the interaction increases, shows an intricate diagonal pattern of alternating weak () and strong () correlations (figure 3(b)). With stronger interaction (gd = 1), larger non-coherent regions form black stripes in figure 3(c). As the crystal phase is approached at gd = 15, the diagonal non-coherent regions broaden, forming an alternating high-low pattern (figure 3(d)) but with a larger spacing than figure 3(b). The stripe pattern formation is the result of the interaction between the BEC fragments. The spacing between the stripes relates inversely to the spatial distance between the individual fragments. In the MI state, the fragments are localized at each lattice site and their spatial distance matches the lattice constant. As the interaction increases, the bosons fragment further and they are no longer necessarily aligned to the lattice sites. In the CS, the effective lattice constant with respect to the fragments/bosons is roughly halved resulting in roughly doubled spacing between the stripes.


Figure 3. (a)–(d): 1st order momentum correlations and (e)–(h): 2nd order momentum correlations for the distinct emergent phases of dipolar bosons in lattices. In the Mott-insulating state shows a clean diagonal pattern of stripes with alternating weak and strong correlations. As the interaction strength is increased to gd = 1.0, the diagonal correlation hole (black regions with ) spreads. A striped pattern similar to the Mott-insulating phase, but with a different spacing is seen in the crystal phase at gd = 15. The 2nd order momentum correlations g(2)(k1, k2) show similar patterns, but with their value lying in the interval [0, 2] thus signifying (anti-)correlation, i.e. (anti-)bunching for g(2) > 1 (g(2) < 1).


Download figure:
Standard image High-resolution image4.3.2. 2nd order momentum correlations
In figure 3(e)–(h) we show the 2nd order momentum correlation that offers insight into the 2nd order coherence of the state at distinct phases. The SF regime gd = 0 (figure 3(e)) shows 2nd order coherence everywhere in k-space. At interaction strength gd = 0.1 in the MI regime, a periodic bunching-anti-bunching pattern emerges (figure 3(f)). For stronger interactions the stripes in g(2)(k1, k2) become wider and lose contrast (figures 3(g)–(h)).
The form of the k-space correlations admits a simple interpretation. For weak interactions the gas is SF and this necessitates delocalization of the particles with complete Nth-order coherence. This is reflected in the constant value of that does not correlate or anti-correlate any pair-measurement of momenta . At the MI state, finding one particle with momentum k1 indicates the (almost) certainty to find particle 2 with , n integer. Well after the emergence of the TG-gas-alike state at gd ≈ 1, the stripe-like pattern re-emerges (see figure 3(h)), which can be interpreted as a fermionic diffraction pattern. Indeed, the existence of periodic patterns in g(2)(k1, k2) has been attributed to a phenomenon similar to Friedel oscillations in metals [27] where the (effective) fermion pair wavefunctions interfere. An examination of the structure of g(2)(k1, k2) reveals that the spacing of the stripes is corresponding to a distance of in real space, which is similar to the extension of each fermionized wavefunction, i.e. half a lattice-site width. This periodic pattern is more clearly reflected in the correlations at very large gd (figure 3(h)) in the crystal phase: there, the momentum distributions are expected—at least for the case of a harmonic confinement—to match the ones of interacting fermions [31]. When one particle is found at momentum k1, the second one has a momentum of , with m integer. For our setup we find . We stress that is a function of the interparticle interaction strength gd and does—unlike —not relate to the underlying lattice spacing. In our setup, we find , because of the hard-wall boundary conditions that we consider. Interestingly, the stripe-like periodic structure of g(1) and g(2) seen in the strongly interacting—fermionized—limit has been found for interacting fermions as well [94].


5. Effect of the lattice's depth
The two distinct phase transitions studied above show a very different dependence on the lattice depth V. The SF MI transition shows a very strong dependence in V while the MI CS one is practically independent of V. In this section, we explore the dependence of the many-body correlations as well as the natural occupations on the lattice depth V and assess how it relates fundamentally to the control of correlations in the system.


Figure 4(a) shows the first-order Glauber correlation function for different lattice depths V. At gd = 0.02 which is at the SF phase near the SF MI transition, we see a stark dependence on V. For a small depth V = 2, the system is plainly SF and coherent. As the barrier is raised the ODLRO strongly reduces as can be seen from the decrease of the off-diagonal values of at V = 6. At V = 10 off-diagonal coherence is completely absent and a purely diagonal block structure emerges, indicating an MI phase. The MI phase persists with increasing V; a transition from MI to the CS is not seen (cf. plot for V = 30). Thus, keeping gd fixed to a small value at the SF phase, one can induce the transition from the coherent SF phase to a non-coherent MI phase solely by changing the lattice depth V.


Figure 4. The effect of the lattice depth on the phase transitions. (a) for different lattice depths. Top panel: for weak interactions (gd = 0.02), large V values cause the loss of inter-site coherence ( on the off-diagonal ). Thus, by increasing V one can induce the transition from the SF to the MI state. Bottom panel: for strong interactions (gd = 15.0), shows negligible change with increasing V. The MI to CS transition or vice-versa cannot be stimulated via V. (b) Natural occupation λi as a function of interaction strength for different barrier height. For small interactions, gd ⪅ 1, the natural occupations show a strong dependence on V. Larger V induces a significantly faster transition to the MI state (). For stronger interaction gd ⪆ 1 the effect of the lattice depth is minimal. For the transition to the crystal state, the effect of the barrier height is negligible.


Download figure:
Standard image High-resolution imageIn contrast, a transition from the MI to the CS or vice-versa cannot be induced by changing V; the MI CS transition shows only a minimal V-dependence that can be seen in the lower panel of figure 4(a) that shows as a function of V for gd = 15.0. Here the system is in the crystal state and shows negligible change as V is changed. The inter-site and intra-site correlations are thus minimally affected by the lattice depth as the system reaches the crystal phase.


This conclusion is supported by analyzing the effect of the lattice depth on the natural occupations. Figure 4(b) shows the natural occupation λi as a function of interaction strength gd for different lattice depths V. For small interactions, there is a strong dependence on V. The larger the V, the smaller the critical gd at which the transition occurs, which is revealed by the equal population of three natural orbitals (). The CS formation, indicated by an equal population of six orbitals, shows a minimal dependence on V.


These observations demonstrate the fundamental difference between the two distinct phase transitions as previously discussed. The SF MI is an 'extrinsic' transition since it can be manipulated using the external (one-body) potential. The MI CS one is, on the other hand, a purely 'intrinsic' transition, since it can be induced solely by the two-body dipolar interactions and cannot be triggered via the one-body potential. As a consequence, control of intersite correlations can be achieved through the manipulation of the external potential while the intrasite correlations can be controlled primarily through the dipole–dipole interaction strength.


6. Conclusions
In this work, we have explored the many-body correlations of interacting ultracold dipolar bosons in optical lattices. As the dipolar interaction strength increases, the bosons transition from a superfluid to a Mott-insulating and, eventually, for stronger dipolar interactions, to a crystal phase. The phases are characterized by the natural orbitals and their populations. In the superfluid state, only one orbital is populated. In the Mott-insulating state, the orbitals that are equally populated are as many as the sites in the lattice. Finally, for even stronger dipolar interactions, the crystal phase emerges and the equally populated orbitals are as many as there are particles in the system. We thus verify a fundamental connection between the natural occupations and the strength of the dipole–dipole interaction [33]. Moreover, we examined the dependence of the natural orbitals on the interaction strength and showed how the densities in distinct quantum phases are built from them. Note that up to the value gd ≈ 0.1, all occupied natural orbitals topologically resemble the ones of the non-interacting system. Past gd ≈ 0.1, the natural orbitals become topologically distinct: they are torn or glued and not continuously deformed, i.e., the number of nodes in them changes as the interaction strength is increased.
As the interactions increase, dipolar bosons in optical lattices cover the full range of correlation properties: while the weakly interacting SF is entirely uncorrelated and the MI correlations are structured via the external lattice potential, the long-range interaction-dominated crystal phase represents a strongly correlated state of a many-body system structured by the interparticle interactions and not the lattice potential. We show how the normalized Glauber correlation functions of the ground state undergo characteristic changes as the interaction strength grows and the system transitions across different phases.
We comment on a fundamental difference between the SF MI and the MI CS transitions, which can be exploited for a control and management of the system's correlations. The former transition is extrinsic, implying that it can be induced via the one-body potential. The latter is intrinsic, i.e. it is only accessed via the two-body interaction potential. Hence, precise control of the intersite (i.e. across different sites) correlations is possible through the manipulation of the depth of the lattice potential while the intrasite correlations can be controlled primarily by the dipolar interaction strength.


Recent experimental progress has propelled the development of a variety of methods for the measurement of spatial and momentum correlation functions thereby providing a detailed probe into the many-body properties of cold atom systems. In particular, time-of-flight measurements yield substantial information on correlation functions up to various orders [95–100] complemented by additional techniques such as noise pattern analysis [99], momentum microscopy [100], fluorescence imaging [96]etc.
Our current investigation of systems with dipole–dipole interactions provides a launchpad for further studies into the fundamental aspects of many-body correlations. A straightforward extension would be the calculation of higher-order correlation functions and also the investigation of lattices with incommensurate filling. Incommensurate systems are indeed drastically different from their commensurate counterparts [101, 102] and possess a stronger sensitivity to the exact particle numbers. Thus significantly different ground state properties are expected to be seen. A more general study that includes contact interactions along with dipolar ones could reveal the interplay between short- and long-range interactions with adjustable strengths and promises to show new multiscale phases [103].
Acknowledgments
BC gratefully acknowledges financial support from the Department of Science and Technology, Government of India under the DST Inspire Faculty fellowship. MCT acknowledges financial support by the São Paulo state research foundation (FAPESP) and also CePOF/USP. AUJL acknowledges financial support by the Austrian Science Foundation (FWF) under grant No. P 32033, and the Wiener Wissenschafts- und TechnologieFonds (WWTF) project No MA16-066 ('SEQUEX'). Computation time on the HPC2013 cluster of the IIT Kanpur and the Hazel Hen cluster of the HLRS in Stuttgart are gratefully acknowledged.
Appendix A.: Results for larger systems
The main text showed the results for a triple-well system S = 3 with six bosons N = 6. In this section, we show similar spatial and momentum correlation characteristics for both larger lattice size S = 5, N = 10 and larger filling factor S = 3, N = 9 demonstrating that the analysis of the main text can be generalized for larger systems.
A.1. Larger filling factors
To show the generality of our results for higher filling factors, we show the 1st and 2nd order spatial and momentum correlation functions for different emergent phases for .

Figure A1 displays the 1st order spatial correlation function and the 2nd order correlation function , for the distinct emergent phases for S = 3, N = 9.


Figure A1. (a)–(d): The 1st order spatial correlation function and (e)–(h): the 2nd order correlation function , for the distinct emergent phases for . At gd = 0, the bosons are coherent, reflected in the uniform distribution of and . For the Mott insulator (gd = 0.1), the loss of intersite coherence but presence of intrasite coherence is reflected by a strong off-diagonal reduction and coherence triple-block-diagonal structure corresponding to S = 3 sites. Larger values of gd lead to the reduction of intra-well coherence and at the crystal phase, gd = 15, coherence blocks centers at the location of each boson forming a nine-fold block structure corresponding to N = 9 bosons.


Download figure:
Standard image High-resolution imageFigure A2 displays the 1st order momentum correlations and the 2nd order momentum correlations g(2)(k1, k2) for the distinct emergent phases for S = 3, N = 9.


Figure A2. (a)–(d): 1st order momentum correlations and (e)–(h): 2nd order momentum correlations g(2)(k1, k2) for the distinct emergent phases for S = 3, N = 9. Complete momentum coherence is seen in superfluid state for gd = 0. At the Mott-insulator state(gd = 0.1), clean diagonal pattern of stripes with alternating weak and strong correlation is seen. At the crystal state, gd = 15, a similar stripe pattern but with a different spacing is seen.

Download figure:
Standard image High-resolution imageBoth the 1st and 2nd order spatial and momentum correlation function for S = 3, N = 9 show similar characteristics as discussed in the main text for S = 3, N = 6. It can thus be concluded that the analysis of the spatial and momentum correlation functions of the main text is also valid for systems with larger filling.
A.2. Larger lattice size
To demonstrate the generality of our analysis in a triple well for larger lattice size, we show the 1st and 2nd order spatial and momentum correlation functions for S = 5, N = 10.
Figure A3 displays the 1st order spatial correlation function and the 2nd order correlation function , for the distinct emergent phases for S = 5, N = 10.


Figure A3. (a)–(d): The 1st order spatial correlation function and (e)–(h): the 2nd order correlation function , for the distinct emergent phases for S = 5, N = 10. gd = 0 shows complete coherence with uniform and . At gd = 0.1 (MI), the presence of intrawell coherence and absence of interwell coherence results in a five-fold block coherence structure corresponding to S = 5 sites. At the crystal state, gd = 15, the complete localization of bosons is revealed in a ten-fold block structure as the coherence blocks centers on N = 10 bosons.


Download figure:
Standard image High-resolution imageFigure A4 displays the 1st order momentum correlations and (e)–(h): 2nd order momentum correlations g(2)(k1, k2) for the distinct emergent phases for S = 5, N = 10.


Figure A4. (a)–(d): 1st order momentum correlations and (e)–(h): 2nd order momentum correlations for the distinct emergent phases for . The momentum correlation shows a transition of complete coherence at gd = 0 to a diagonal stripe pattern at the MI phase gd = 0.1. A similar stripe pattern with different spacing is seen for crystal state at gd = 15.

Download figure:
Standard image High-resolution imageBoth the 1st and 2nd order spatial and momentum correlation function for S = 5, N = 10 show similar characteristics as discussed in the main text for S = 3, N = 6. It can thus be concluded that the analysis of the spatial and momentum correlation functions of the main text is also valid for larger lattice size.
Appendix B.: One-body RDM
The reduced density matrix is important not only for its spectral decomposition but also from the perspective of its integral kernel . The latter relates to the correlation and coherence properties of the system and is used to construct the generalized pth order correlation functions [69]


The 1st order correlations (p = 1) and hence the one-body aspects of the system are contained in the one-body RDM . Its diagonal kernel ρ(x) ≡ ρ(1)(x, x) is real-valued and gives the one-particle density or equivalently the probability of finding a particle in position x irrespective of all other N − 1 positions. In contrast, the off-diagonal part, , is in general complex and thus not directly experimentally observable. Physically, it represents the overlap of a particle state at position x and .


The off-diagonal kernel of ρ(1) relates to the coherence properties of the system. For an infinite homogeneous system, non-vanishing off-diagonals as for all pairs imply ODLRO and hence indicate coherence [104]. For a finite spatially bounded system, there is no strict ODLRO. Instead, for finite systems coherence is established when the off-diagonal of is simply non-vanishing (without further requirements).


Figure B1 shows the one-body RDM for various interaction strengths. In the limit of vanishing interaction, the bosons are condensed, and the state is SF. The comparatively high kinetic and potential energies lead to a greater population in the middle well. thus shows a checkerboard pattern with a high value corresponding to the middle well and smaller values in the outer ones. As interaction is introduced, the bosons undergo localization in each well, whose degree increases with gd and is maximum at the MI phase for gd = 0.1. This localization reflects in which shows three diagonal maxima corresponding to each well, meaning that the probability of finding a particle in x and is significant only within each of the lattice sites. As the repulsive interaction increases, the particles inside each site begin to separate and thus localize individually. At the crystal phase gd = 15, the bosons show complete intrasite localization with showing N = 6 separate diagonal maxima corresponding to each particle.


Figure B1. One-body reduced density matrix for various interaction strengths. For gd = 0, the system is in a coherent superfluid state showing a checkerboard pattern with an intensity maximum at the origin. At gd = 0.1, the system is in the MI state. The intersite coherence is reduced and reflected in the lower density values at the off-diagonals. At gd = 1, we are in the Tonks–Girardeau regime and the density maxima in each well begins to split. At gd = 15, we are deep in crystal phase and the complete splitting of the density maxima shows intrasite decoherence.

Download figure:
Standard image High-resolution imageAppendix C.: Momentum space RDM
C.1. One-particle distribution
As in the coordinate-space density, the single-particle momentum density matrix relates to the momentum coherence of the system. Physically the first order momentum density matrix represents the probability of finding a particle with momenta k and .

In the uncorrelated limit, gd = 0, the momentum distribution is concentrated around k = 0 showing a checkerboard pattern with secondary momentum coherence at the reciprocal lattice sites (figure C1). When the interaction is introduced the coherence centers stretch diagonally forming a striped diagonal pattern with the principal diagonal having a maximum value in the MI phase. This reflects the localization in real space and, hence, delocalization in momentum space.
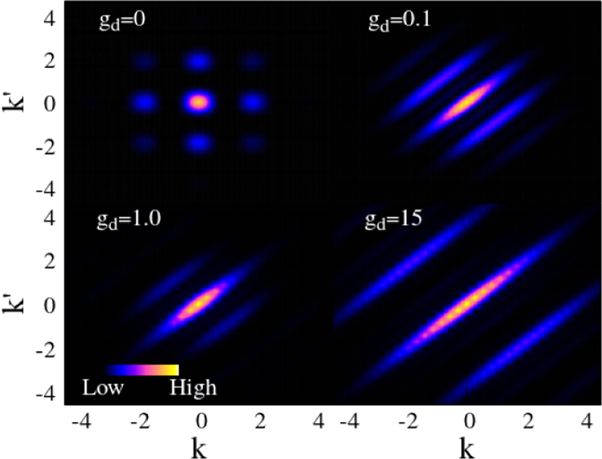
Figure C1. One-body reduced momentum density matrix for various interactions. With interactions, the density shows diagonal stripes. At the MI state, gd = 0.1, there are three primary diagonal stripes along with fainter outer ones. At the crystal phase the stripes are spread outwards signifying long-range momentum correlations.

Download figure:
Standard image High-resolution imageAt the MI phase gd = 0.1, shows three primary diagonal stripes pertaining to the three lattice sites. The side-bands form from stretching and joining the smaller coherence center at the reciprocal sites. There are also fainter bands at the edges formed from the stretching of the off-diagonal corners. Increasing interaction results initially, in a reduction of the distant stripes as can be seen at gd = 1.0. However, as the interaction is further increased, the distant bands reappear while the nearer ones diminish. One can understand this behavior from the fact that there emerge two competing tendencies. The stronger repulsive interaction favors the enhancement of momentum correlations in the vicinity of k = 0. However, as the interaction increases, the condensate localizes in real space, resulting in the spreading of the momentum correlations.

At the crystal phase, gd = 15, we get three well-separated stripes, signifying long-range momentum correlations.
C.2. Two-particle distribution
The diagonal of the two-body momentum density (or, two-particle momentum distributions) gives the probability of finding one particle with momentum k1 and another with momentum k2. For the ρ(k1, k2) is concentrated near k1 = k2 = 0 with small contributions at (0, ±π/2) (figure C2). In this regime, as discussed, only one orbital contributes and the momentum distribution essentially reflects the diffraction of this orbital on the lattice.


Figure C2. The two-particle momentum distribution for various interaction strengths. At gd = 0 we obtain a checkerboard pattern with peaked origin. In the MI state (gd = 0.1) there appear three peaks over a background cloud, which are connected to the threefold fragmented state. At the crystal state the momentum distributions of strongly interacting bosons are expected to become equal to those of interacting fermions [31].

Download figure:
Standard image High-resolution imageFor increasing interaction (gd = 0.1) the discrete pattern now changes to a smeared distribution in the MI phase (figure C2). The momentum distributions concentrate on the diagonal forming three lobes over the continuous diagonal. This is contrasted to the real-space two-body density that has a correlation hole at x1 = x2 (see figure 2 of [33]). At gd = 15, the system is at the crystal state and the six-fold fragmentation leads more structure at the diagonal, with further expansion and smearing of the off-diagonal contribution.
Footnotes
- 6
The 'short-range part of the dipolar interaction' refers to the part of the interaction potential within a single well; quantified as, . Similarly, the 'long-range part of the interaction' refers to the part of the interaction potential beyond the local well; quantified as, .

