

Abstract
Simulations of impurity trajectories in deuterium plasmas in the vicinity of the surface are performed by taking into account the magnetic sheath in conditions relevant for ITER and WEST. We show that the magnetic sheath has a strong effect on the average impact angle of impurities in divertor conditions and that it can lead to an increase of  at the gross erosion maximum for neon (Ne+4) compared to the case when only the cyclotron motion is considered. The evaluation of the net erosion has been undertaken by retaining local redeposition of tungsten (W). We investigate how it is affected by the sheath magnetic potential profile. The largest effect is however observed when an energy distribution is considered. In this case the number of particles that manage to exit the sheath is larger as it is dominated by the more energetic particles. The comparison with other work is also discussed. The application to a scenario of the WEST project is finally performed, which exhibits a moderate, however non negligible, erosion of the plasma facing components.
Export citation and abstract BibTeX RIS
1. Introduction
Erosion processes like physical sputtering will determine the lifetime of plasma-facing components in fusion reactors. They also have a direct influence on the plasma discharge performance as they are a source of impurities. The case of erosion by impurities is important as it has generally a much lower physical sputtering energy threshold than the main species and as sputtered particles are ejected with a larger energy. At the interface between the plasma and the surface a very narrow region exists and is composed of two components: the Debye sheath that maintains ambipolarity whose width is several Debye lengths and the magnetic pre-sheath that originates from the grazing angle of the magnetic field whose width is several ion Larmor radii. The magnetic sheath electric field determines the energy of the impinging ions and their impact angle on the surface and has a strong effect on physical sputtering as it depends on both of those parameters. While the increase of impact energy is evaluated in most edge fluid codes, the angular deflection is generally only approximated. It has however been implemented recently for the main species [1]. In a previous work we have shown that the deflection by the sheath is larger for impurities than for the main species in the case of the Tore Supra Toroidal Pumped Limiter [2]. Other authors have also investigated the effect of the magnetic sheath on the impurities average impact angle and its effect on the sputtering yield [3]. Their work emphasized the variation due to the mass and charge state. While the effect of the magnetic field angle with respect to the surface was studied extensively, only a very moderate influence of the electron densities has been pointed out as it was limited to two values.
In what follows we define the net erosion as the sum of the gross erosion and the local redeposition of particles that do not leave the magnetic sheath. The magnetic sheath also has an effect on the second contribution: if the ejected atom is ionized inside the magnetic sheath it needs to have sufficient energy to overcome the electric potential and reach the plasma. This effect has also been investigated previously. Chankin et al [4] have dealt with it with a method similar to that used here with two different ad hoc sheath potentials. More general simulations of the entire SOL that include a self-consistent computation of the electric field and the effect of the temperature gradients have been carried out by Tskhakaya et al and have also provided an evaluation of the redeposition [5].
The method presented in this paper takes advantage of the magnetic sheath electric field calculated self-consistently by a PIC code [6] to perform of parameter study of the gross erosion and the local redeposition in order to evaluate the net sputtering generated by a given impurity.
This paper is organized as follows. In section 2 we describe the method used for the simulations. Section 3 shows the results obtained for the average impact angle of a selected impurity. The corresponding redeposition of tungsten atoms is presented in section 4 accompanied by a comparison with ad hoc potentials used in other work. Finally an application to the WEST project [7] in Cadarache is provided in section 5.
2. Numerical method
The simulations of the magnetic sheath region are performed with a 1D PIC code [6]. The coordinates and the main geometric quantities are detailed in figure 1. The code solves the equations of motion of the species considered and Poisson's equation. In our case we consider them in a normalized form (time:  distance:
  potential:
  density:
  ):
):
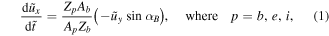
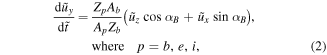
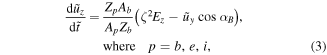

where  is the magnetic field angle with respect to the flat surface,
  the magnetization parameter that is the ratio between the Larmor radius rL and the Debye length
  Z the charge state, A the atomic number and
  the cyclotron frequency. The indices i, b, e refer to the considered impurity, the background species and the electrons, respectively. In addition to
  and ζ, two additional parameters are required for the simulations:
  the ion to electron temperature ratio that affects the injection of ions at the sheath entrance and ϕ0 the plasma potential that is a function of τ (calculated from equation (2.60) of [8]) and is required as a boundary condition for ϕ. A Maxwellian distribution function is considered at the sheath entrance in the direction perpendicular to the magnetic field. The velocity distribution in the direction parallel to the magnetic field is provided by a Vlasov code based on [9]. For the impurities we use a generalization of this method [10].

Figure 1. Schematic view of the geometry and coordinates.
Download figure:
Standard image High-resolution imageThe first step is to calculate the sheath electric field due to the electrons and the deuterium background species (i.e. in the case where  ). The magnetic sheath electric field obtained, which is is a function of
  ζ and τ, will be used throughout this paper. Here we will essentially concentrate on the case
  which is relevant of divertor conditions.
  is varied between 0.5° and 4°. Finally ζ spans the range between
  and
and  which corresponds in the case of the WEST divertor (
 ) to
) to  –
– m−3 for a deuterium plasma.
The second step is the simulation of impinging impurities. In this case, the sheath electric field calculated for a deuterium plasma is employed. The impurities are injected as test particles so that we can determine their impact angle and energy when they hit the surface that we consider here as perfectly flat. This means that we do not consider the effect of the impurities on the sheath electric field. Such an approximation is valid in the case of a low impurity concentration. It has the advantage to diminish drastically the computation time as every case would require a self-consistent simulation of the sheath for all impurities considered with their respective concentrations. The sputtering yield used here comes from [11].
Finally the local redeposition is calculated with the same magnetic sheath potentials. Atoms are injected from the wall with a cosine angular distribution ( where θ is the ejection velocity angle with respect to the surface normal) and a Thomson energy distribution with a cut-off given by [13]:
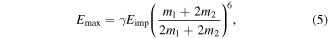
where  Eimp is the average impinging ion energy, m1 is the impinging ion mass and m2 is the sputtered atom mass. Electron-induced ionization is considered until the charge state
  with the data provided by the OPEN-ADAS database [12] and is implemented with a Monte Carlo technique. The temperature and density profiles of the electrons are given by dedicated simulations with the PIC code using the previously determined sheath potential. The parameter range used for τ, ζ and
  is the same as for the average impact angle simulations. Two additional parameters are required: the electron temperature Te and the norm of the magnetic field B (that determines the electron density at the magnetic sheath edge from ζ). The situation is finally determined by the choice of the ion species at the origin of the sputtered tungsten. Here we will consider the specific case of Ne
 This choice is justified by the possibility of using this impurity as a seed for spreading the energy that reaches the divertor. The method can be extended to calculate the net erosion for every other species with different charge states.
3. Average impact angle
The averaged distribution of impact angle of Ne4+ in a D magnetic sheath is displayed in figure 2(a). The black lines delimit the extension of the parameter range for the WEST and ITER divertors. We see that the average impact angle varies from  to
to  Contrarily to the ballistic model (figure 2(b)), where the cyclotron motion is taken into account but not the sheath electric field, a strong dependence of the impact angle on the electron density is visible. In particular a steep gradient exists between two limiting cases in the range
  and appears as the contour plot lines lie very close to each other in the vertical direction.

Figure 2. (a) Average impact angle for Ne4+ with the magnetic sheath. (b) Average impact angle for Ne4+ with the ballistic model. (c) Difference between the average impact angles for Ne4+ obtained with the magnetic sheath and with the ballistic model. The black lines surround the parameter range of the WEST and ITER divertors.
Download figure:
Standard image High-resolution imageThe difference between the average impact angle of the case with and without sheath is plotted in figure 2(c). We see that in the low density case (small ζ) corresponding to far SOL regions, the magnetic sheath has the effect to reduce the impact angle. In this situation the particles are strongly magnetized and their gyro-center well follows the magnetic field lines. The particles are mainly accelerated by the sheath in the direction parallel to the magnetic field and their impact angle is thus reduced. In the high density case (large ζ), the particles have a large excursion along the sheath electric field and are strongly accelerated towards the wall during their last Larmor gyration leading to an increase of the average impact angle that reaches  in the case of
4. Non-redeposition fraction
For those simulations, at least 105 injected and a minimum of 100 impinging particles were required in each case. To determine the effect of local redeposition we use the non-redeposition fraction that corresponds to the ratio between the number of escaping particles and the total number of rejected particles. This value is displayed in figure 3(a) in the case of W sputtered by Ne4+ for  and B = 4.2 T (electron temperature and magnetic field characteristic of WEST). In the WEST conditions it varies between
  at large density (almost no particles manage to escape close to the strike points) and 0.99 at low density (almost no redeposition farther from the strike points). This is naturally explained by the increase of the electron density and thus by the reduced ionization time in the sheath. Note also that the effect of the angle of the magnetic field with respect to the surface,
  is of minor importance. In figure 3(b), the same quantity is displayed this time for
  and B = 8 T, which are relevant parameters for ITER. Here the non-redeposition fraction is about 0.2 for
  This is very large in comparison to the
  case. The reason is that the electrons are much less energetic and efficient to ionize the sputtered atoms. Furthermore the effect of
  is this time visible as the contour lines are not totally horizontal in the upper part of figure 3(b).

Figure 3. Non-redeposition fraction at  (a) and
  (b). The black lines surround the parameter range of WEST and ITER divertors.
Download figure:
Standard image High-resolution imageComparison with previous work has also been performed. It is displayed in figure 4(a) as a function of  where
where  is the ionization time of the ejected atom and
  the gyro-frequency of the singly ionized ion. The simulations were performed for the case
  RE = 0.14 and
  where
where  is the ratio of the sputtered atom energy to the average ion thermal energy at the magnetic sheath entrance. The value of RE relates to the average ejection energy of W sputtered by Ne
 To avoid discrepancies due to other effects than the sheath potential profile, we recalculated the non-redeposition fraction with the ad hoc potentials given by Brooks [14] and Stangeby [15] used in [4].

Figure 4. (a) Non-redeposition fraction for different models in the case  and RE = 0.14. Magnetic sheath potential (b), electron density (c), location of ionization for escaping particles (d) and location of ionization for all particles (e) for the three monoenergetic cases at p = 0.29.
Download figure:
Standard image High-resolution imageThe first part of the comparison is performed with monoenergetic sputtered W as in [4]. The best agreement for non-redeposition is obtained with Stangeby's potential. The non-redeposition fraction results from the interplay between the electron density and potential that are displayed in figure 4(b) and 4(c), respectively.
First we compare the redeposition process between the potentials from [14, 15]. We see that the ionization (figure 4(e)) occurs closer to the wall for potential [14]. Figure 4(d) shows the distribution of ionization location for ions that manage to exit the sheath. Since the potential [14] is rapidly flat, ions can exit easier the magnetic sheath even if they are ionized closer to the wall than in the model [15]. This leads to more particles that manage to exit the sheath with potential [14].
If we now compare the case computed in this work (PIC) and the model [15], we see that the location from where the ions are able to exit the sheath is almost the same between both models (around  in figure 4(d)). Figure 4(e) shows that a larger number of ionizations occurs in the region
  for our model than with the potential [15] due to the larger electron density. This explains that the largest redeposition is obtained in this work.
If the computations are performed with a Thomson ejection distribution, for which the average energy of particles satisfies  a redeposition at
  smaller than that of the monoenergetic case is observed. In this situation the ejected W atoms that are the most energetic contribute strongly to the non-redeposition fraction. This value still stays above the fit obtained in [5], for which the full SOL has been considered. Both models have a smaller slope than the monoenergetic cases as they both use a Thomson energy distribution.
5. Application to WEST
Finally the full model is applied to WEST. The simulations are performed using the data ( ) provided by the SOLEDGE2D-EIRENE code [16]. The electron density and temperature profiles are shown in figure 5(a). The d = 0 cm corresponds to the position of the inner strike point. The maxima of the temperature and density are located at distinct position. Figure 5(b) gives the gross erosion obtained with the sheath model and with the ballistic model. The erosion is larger by 66% at its maximum in the case with the magnetic sheath considered. It can be explained by the impact angle that is larger with the sheath and that means a larger sputtering yield of W by Ne4+ for this range of energies. The maxima of gross erosion are obtained at the temperature maxima. No erosion occurs at the left density maximum as the energy is lower than the physical sputtering threshold at this location. We then plot the net erosion that is obtained from the gross erosion with the sheath model and the fitted non-redeposition fraction calculated in section 4. The net erosion is characterized by several peaks for each strike point. While one of them is close to the location where the gross erosion is the largest, the others on the side are due to the fast variation of the plasma parameters and to the fact that the dependence on temperature and density of the redeposition is different to that of the gross erosion. The expected net erosion reaches 0.95 nm s−1 at its maximum for a concentration of 1% of Ne
 This corresponds to ≈ 10%–20% of non-redeposition fraction in the region where the gross erosion is significant. This value that seems larger than expected can be explained by the fact that large electron temperature (large ionization cross-section) and density do not occur at the same position. Finally we investigate the validity of the model in figure 5(d). As the model is collisionless it is required to check if the collisional mean free path is longer than the mean trajectory length spent by the Ne4+ ions inside the sheath. This condition is validated in most of the simulation domain considered. Close to
  it is however not satisfied because of the large density close to this point. This is of little importance as at that location no erosion occurs.

Figure 5. Erosion in a WEST scenario: (a) electron density and temperature profiles. (b) Gross erosion obtained with and without the sheath. (c) Net erosion. (d) Collisional mean free path and average trajectory length of Ne4+ inside the sheath.
Download figure:
Standard image High-resolution image
6. Conclusion
The effect of the sheath on the gross and net erosion due to the specific case of Ne4+ has been investigated in a large range of  and
and  taking into account an energy distribution of sputtered atoms. In the case of divertor strike points it is shown that the impact angle is increased and that it leads to a modification of the physical sputtering compared to the case where only the cyclotron motion is taken into account. A redeposition model that uses the self-consistently computed potentials has been implemented and compared to the redeposition obtained with ad hoc potentials. At short ionization length (
 ) the best agreement is found with Stangeby's potential [15], with which the discrepancy however reaches 55% at p = 0.29 and even 69% at p = 0.13. When an energy distribution is employed, for which the ejected atoms average energy matches the one of the monoenergetic case, the redeposition is found to be much smaller as the fastest atoms are the main contribution to the escaping particles. The redeposition is shown to be large in the case of WEST but could be very small for ITER steady-state. This is due to the electron energy that is very low and that is in most cases insufficient to ionize sputtered W atoms before they exit the sheath. Finally an application to the WEST divertor has been carried out and a maximum net erosion estimation of 0.95 nm s−1 per 1% Ne is given.