
Abstract
The presented investigations aim to pinpoint the crossover of lead sulfide (PbS) quantum dots (QDs) with a shrinking diameter to a molecular state. We have measured the transmittance of strongly confined PbS QDs of 2.7, 3.1, 4.7 and 4.8 nm size in the temperature range of 10–300 K. Fitting these results with the classical Fan theory revealed that the average phonon energy coincides with the reduction of the QD diameters, pointing to a limitation of coherent atom movements in strongly confined matter. The phonons vanish at QDs limited to 90 atoms corresponding to a size of 1.7 nm, which we define as the critical size for the solid-to-molecule crossover. The result is confirmed by a calculation based on the uncertainty principle.
Export citation and abstract BibTeX RIS
1. Introduction
Semiconducting structures restricting the electron motion to the nanometer scale in three dimensions are defined as nanocrystallites or quantum dots (QDs). The variety of QDs includes lithographically engineered electrostatically confined systems of electrons [1–4], nano-sized crystallites in glasses [5, 6] and self-assembled colloids [7, 8]. Lead sulfide (PbS) QDs, a typical representative of the latter case, possesses an attractive direct band gap range (specifically with respect to optical fiber application) and a relatively large Bohr radius (∼ 20 nm) [9]. Consequently, due to these advantageous intrinsic properties, PbS QD colloids have been vigorously studied in order to explore their relevance to potential technological applications, such as tunable infrared electroluminescent devices [10], biological imaging [11], intense light emitters with tunable chromaticity [12] and solar cells [13], to mention a few.
Our work here focuses on absorption properties of PbS QDs in the 'small-QD' limit (also called the strong quantum confinement limit), i.e. we investigated QDs with diameters clearly below 20 nm in the range of 2.7–4.8 nm. For such small diameters, hybrid electronic properties not characteristic of either the molecular or solid-state limits are expected [7]. The number of atoms comprising QDs determines their belonging to the different phases of matter: it was pointed out that ∼104 atoms are required to form crystallites with bulk properties [8], while the critical number of atoms at which QDs collapse into the molecular state had not been sought after. The knowledge and mastery of this critical accumulation of atoms exactly at the boundary between molecular and solid-state appearances would allow the realization of extremely sensitive bistable-like devices—switching between confined and non-confined states—due to the removal or attachment of a group of atoms to the QDs in controlled one-step ways.
2. Methods and models
The pursuit of the smallest possible QD (equivalent to the smallest number of atoms forming a QD) raised first the following question: what method and parameter can be used to record evidence of the descent of a solid to its atomic components? We approached this matter by fitting the temperature dependence of the band gap energy Eg(T) for PbS QDs of decreasing diameters with Fan's formula [14–17]

describing the band gap variation via phonon–electron coupling, where Eg(0) is the band gap value toward T = 0 K, A is the Fan parameter (or self-energy), 〈Ep〉 is the average phonon energy responsible for the thermal band gap alteration and k is the Boltzmann constant. Parameter A has been analyzed with Fan's microscopic expression [18] for colloidal 2.0 nm [19] and 4.7 nm [16, 20] PbS QDs, and 5.1 nm PbS QD embedded in a glass matrix [6]. In this paper, we demonstrate that 〈Ep〉 is the decisive 'order' parameter tracking the gradual crossover of crystalline PbS QDs to the molecular phase, i.e. it is demonstrated that 〈Ep〉 depends linearly on the number of atoms forming the QDs, pointing to the 'QD collapse toward the molecule' at 90 atoms.
In order to check this profound result, we present here a second independent quantum mechanical argument based on the uncertainty principle for calculating the minimum QD size. By means of the virial theorem, we start with the general definition of the kinetic exciton energy in a Coulomb potential5 [21]
where p is the momentum, μ is the reduced effective electron hole mass, e is the elementary charge, ε is the corresponding permittivity, ax is the exciton Bohr radius, a0 is the Bohr radius of the hydrogen atom (0.0529 nm) and E1 (− 13.6 eV) is the ground state energy of the hydrogen atom. Employing the uncertainty relation, we insert Δ p = ℏ /(2Δ x) in equation (2), where the coordinate uncertainty Δx becomes the measure for the minimum QD diameter dmin and ℏ is the Planck constant over 2π, and find

where m0 is the free electron mass. By inserting all the constants, the relation
is derived. As the foregoing discussion below will illustrate, expression (4) reasonably matches the result attained with the fits using the Fan formula (1).
3. Sample preparation and measurements
Three oleic acid capped colloidal PbS QD samples with diameters of 2.7, 3.1 and 4.8 nm were investigated. The QD deposition on glass was accomplished with the supercritical fluid CO2 method described in detail in [22]. In order to visualize the QD size distribution and the homogeneity of the substrate surface coverage, scanning electron microscopy has been performed. The result for the 2.7 nm QDs is displayed in figure 1. The QD diameter fluctuations were established to be 2.7 (± 0.4), 3.1 (± 0.5) and 4.8 (± 0.6) nm.
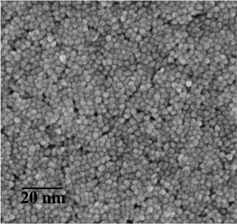
Figure 1. Scanning electron microscopy image of the 2.7 nm QDs.
Download figure:
Standard image High-resolution imageThe transmittance (TR) of the samples was measured with a Fourier transform infrared (FTIR) BOMEM spectrometer in conjunction with nitrogen-cooled InGaAs or InSb detectors. By illuminating the sample with the appropriate internal light source of the BOMEM, the thermally provoked Eg variation, which is defined by the shift of the lowest energy TR minimum [16], was measured employing a closed cycle optical cryostat.
4. Results and discussions
Transmittance spectra and their shape analysis of PbS QDs with a diameter around 3 nm and below are not found in the literature, while figures 2 and 3 show such an example at 10 and 300 K for the 2.7 and 3.1 nm QDs, respectively. The symbols indicate the measurements and the broken and solid lines represent Gaussian fits superimposed on the linear background caused by the ligands. The theoretically expected discrete narrow lines of the absorptive QD transitions [1, 23] are diluted in rather broad (∼ 100 meV) inhomogeneous distributions with a fairly temperature invariant full-width at half-maximum (FWHM) pointing to a line broadening based on size (band gap) fluctuations of the individually absorbing QDs in the illuminated ensemble. Figure 4 displays the Eg(T) trend for both samples versus temperature over the range of 10–300 K. The symbols show the experimental result for various temperatures and the lines are fits using equation (1). The same measurements and fits were performed with the 4.8 nm QDs.

Figure 2. Transmittance minima of the 2.7 nm QDs at 10 and 300 K. The symbols are the measured data and the Gaussian line fits.
Download figure:
Standard image High-resolution image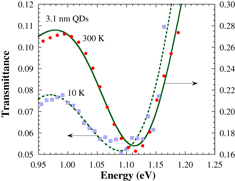
Figure 3. Transmittance minima of the 3.1 nm QDs at 10 and 300 K. The symbols are the measured data and the Gaussian line fits.
Download figure:
Standard image High-resolution image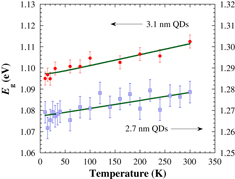
Figure 4. The trend of Eg versus temperature for the QDs with diameters of 2.7 and 3.1 nm. The symbols are the experimental data and the line fits performed with equation (1).
Download figure:
Standard image High-resolution imageThe results undoubtedly demonstrate that Eg(T) becomes more and more linear over the entire temperature range for a shrinking QD diameter. Indeed, the 2.7 nm QDs in figure 4 clearly deviate from the typical nonlinear 'Fan-like' characteristic, which is split into two regions, i.e. dEg/dT (< 50 K) < dEg/dT (> 50 K). However, figure 5 demonstrates that the fit using the Fan equation (1) prevails over the linear expression Eg(T) = Eg(0) + AkT/〈Ep〉, which determines the ratio A/〈Ep〉 rather than the parameters themselves. The slightly positively curved solid line fit achieved by equation (1) results in an improved goodness of fit (χ2 = 0.834) in comparison to the linear fit (χ2 = 0.774), by describing the subtle tendency of dEg/dT to flatten below ∼50 K. Table 1 displays the parameters used in equation (1) best fitting the Eg(T) trends for the samples investigated, to which the parameters for 4.7 nm QDs from [16] have been added. The table reveals the decrease in 〈Ep〉 for smaller QD diameters, pointing to the diminution of phonons in QDs with decreasing size. Calculating the number of atoms in QDs with [24],

where D is the QD diameter and l is the PbS lattice constant (0.5936 nm), we were able to plot 〈Ep〉 = f(N). The result is shown in figure 6, whereas the linear fit—displayed by the broken line—revealed N = 90 (corresponding to D = 1.7 nm) for 〈Ep〉 = 0 eV and the slope of d〈Ep〉/dN = 8 μeV per atom, suggesting that a range could exist and extend to a lower limit of 44 atoms (corresponding to D = 1.3 nm, i.e. the gathering of only 16 simple unit cells of the PbS structure) and upper limit of 500 atoms (corresponding to D = 2.9 nm). For comparison, with μ = 0.039m0 [16] and ax = 20 nm [9], equation (4) gives dmin = 2.6 nm being in the above determined range.

Figure 5. Detailed comparison of the linear fit (broken line) and the fit (solid line) using Fan's equation (1) for the 2.7 nm QD data in figure 4. The Fan fit clearly deviates from the linear fit for decreasing temperatures owing to the replication of the more flat Eg variations at temperatures below 50 K.
Download figure:
Standard image High-resolution imageTable 1. Parameter used in equation (1) to fit the temperature dependence of Eg for the different QD sizes. The achieved goodness of fit value (χ2) is marked as well.
| D (nm) | Eg(0) (eV) | A (meV) | 〈Ep〉 (meV) | χ2 |
|---|---|---|---|---|
| 2.7 (±0.4) | 1.2667±0.0022 | 0.9 ±0.5 | 2.0±0.9 | 0.834 |
| 3.1 (±0.5) | 1.0972±0.0016 | 3.0±1.7 | 5.0±1.7 | 0.924 |
| 4.7 (±0.5)a | 0.9223±0.0003 | 23.4±3.9 | 15.5±1.9 | 0.996 |
| 4.8 (±0.6) | 0.8938±0.0017 | 43.4±10.0 | 19.0±5.0 | 0.966 |
aResults from [16].

Figure 6. The values of 〈Ep〉 (triangle symbols) found from fits such as those in figure 4 versus the number of atoms. The linear fit (broken line) indicates that at 90 atoms the transition between the solid state and molecular state occurs.
Download figure:
Standard image High-resolution imageIt is of importance to note that the QDs formed with supercritical fluid deposition maintain the cubic rock salt (galena) structure of bulk PbS [22]6, justifying the employment of the Fan formula, the effective mass approximation in equation (4) and the use of equation (5). However, as the size of the PbS QDs gets smaller and smaller (∼ 1 nm), it is expected that a larger fraction of the atoms is located on the surface causing hybridization and the consequent formation of monomers rather than QDs with a defined lattice structure [25]. Consequently, the result in figure 6 points to the smallest possible size of cubic crystalline PbS QDs. However, besides the diameter of the QD, the stoichiometry is also highly influential. It was pointed out by Fernée et al [26] that PbS QDs with a size of 1–2 nm can be influenced by an unbalanced stoichiometry, causing variations in the optical properties. Thus, referring to these particles as PbS QDs could be misleading as well. Therefore, we carefully verified a balanced stoichiometry (Pb/S = 1) during the QD preparation7 [27].
5. Summary
We showed that the average vibronic energy as part of the classical Fan formula can be used to monitor the gradual transition from crystalline quantized matter to molecular structures without characteristic phonon energy due to the lack of coherent atomic movements. The work reveals the notable conclusion that the Fan formula, which was designed for materials with macro-dimensions, leads to results comparable with calculations based on quantum mechanics. The topic investigated here raises the question of whether it might be possible in the future to realize 'quasi-matter' at the transition threshold from QDs to molecules in order to allow device operations initiated by the repeatable and revertible flip between molecules and quantized matter due to the controlled fine tuning of atomic accumulations.
Acknowledgments
The work was partially supported by the DGAPA-UNAM PAPIIT project TB100213-RR170213, PI Bruno Ullrich. We also acknowledge R Garcia and U Amaya for technical support. BU dedicates this work to Susi for showing unwavering commitment.
Footnotes
- 5
At this point, two notes are required: (a) the virial theorem we refer to is given by
 , where is the momentum fluctuation, and therefore the left side of the equation expresses the expected kinetic energy, written as in equation (2). (b) A priori, the 'ansatz' (2) seems not to reveal the fact that the charge carriers in the PbS QDs ought to feel a finite confinement potential, as outlined in various publications [21]. We argue though that the effective mass approach reflects intrinsically confinement within a finite potential.
 - 6
The 2Θ x-ray diffraction peaks of 14.4 nm PbS QDs perfectly coincide with the galena structure standard (see [22]). Meanwhile, we confirmed that the galena structure is maintained down to QD sizes of about 2–3 nm.
- 7
Due to the purification procedure employed, the investigated PbS QDs possessed a balanced stoichiometry [27].


