
Export citation and abstract BibTeX RIS

This is an open access article distributed under the terms of the Creative Commons Attribution-NonCommercial-NoDerivs 3.0 licence. Content from this work may be used under the terms of the Creative Commons Attribution-NonCommercial-NoDerivs 3.0 licence. Any further distribution of this work must maintain attribution to the author(s) and the title of the work, journal citation and DOI.
Corrections were made to this article on 19 Nov 2018. A Vegara was add to the main author list, changes were made to the affiliations of the main author list and changes were made to the 'The ESS Design: Target' author list.
The ESS Design: Introduction
Roland Garoby
European Spallation Source, Lund, SwedenE-mail:
1. History
Neutron scattering is a well-developed and extensively used means to get access to fundamental properties of biological matter as well as of physical materials. Until the end of the twentieth century that was mainly practiced with- and limited in performance by—the continuous flux of neutrons from ageing nuclear reactors (e.g. the Institut Laue-Langevin (ILL), the flagship of neutron research in Europe and in the world) [1]). Looking forward to the following two decades, an OECD report published in 1998 diagnosed the foreseeable decrease of the number of operational facilities [2] and the need to progress in performance. Considering the high scientific interest and the increasing importance of the subject for society at large, the report concluded by strongly recommending the construction of next generation neutron sources in America, Europe and Asia. Pulsed spallation neutron sources (SNS) using a proton beam power exceeding 1 MW were specifically mentioned as the most interesting high performance facilities in the future landscape of neutron laboratories.
The USA was the first country to follow this advice by building the SNS in the Oak Ridge National Laboratory (ORNL) which started in 2006 [3, 4]. Japan followed in 2009 with the Japan Proton Accelerator Research Centre (J-PARC) in Tokai [5, 6]. In Europe, the subject was part of a concerted effort to further develop the European world-leading large-scale research infrastructures suite. In 2003, the European Strategy Forum for Research Infrastructures (ESFRI), set up by the Research Ministries of the Member States and associated countries, concluded that a 5 MW long-pulse, single target station layout with nominally 22 'public' instruments was the optimum technical reference design for an European Spallation Source (ESS) that would meet the needs of the European science community in the second quarter of the century [7].
Six years later, in 2009, it materialised in a real project with the adoption of the site of Lund (Sweden). A pre-construction phase followed until the end of 2013 during which the design was finalised [8]. Construction then started with the first neutron beams planned to be available in 2019, and the ESS facility to be operational at full performance in 2025.
2. Description
2.1. Principle and specifics
The high level parameters of ESS are shown in table 1. As at SNS and J-PARC, neutrons at ESS are produced by spallation, when the 2 GeV protons hit the metal target and destabilise atoms. The neutrons inherit the pulsed time structure of the proton beam which allows the use of the time of flight (ToF) technique to determine their energy. Beam power and energy per pulse are however significantly higher at ESS than in the other two MW-class facilities.
Table 1. ESS high level parameters.
| Parameter | Units | Value |
|---|---|---|
| Average beam power | MW | 5 |
| Proton kinetic energy | GeV | 2.0 |
| Pulse repetition rate | Hz | 14 |
| Energy per pulse | kJ | 357 |
| Average pulse current | mA | 62.5 |
| Macro-pulse length | ms | 2.86 |
| Number of target stations | 1 | |
| Number of moderators | 2 | |
| Number of instruments in construction budget | 16 (22) | |
| Number of neutron beam ports | 42 | |
| Average separation between ports | degrees | 6 |
ESS specifications have been established by two basic scientific requirements [9]: (i) to deliver a time averaged flux of neutrons, which is comparable to the most intense continuous source in existence, namely ILL and (ii) at a pulse repetition rate that is low enough to avoid loss of efficiency in the use of the high flux even for the slowest/coldest neutrons in large demand. The first requirement sets the average beam power of 5 MW. The second one results in an energy per pulse of 357 kJ, which can only be obtained at a few GeV from a linear accelerator (Linac). The proton beam pulse length is hence three orders of magnitude longer (2.86 ms to be compared to about 1 μs for SNS and J-PARC) but the cold neutron beam pulse is only an order of magnitude longer because of the time constant of the neutron moderators. For neutron users, this choice complements the possibilities of the other facilities and is prone to better optimisation of instruments for a wide range of applications. That brings also the additional benefits of minimising shock wave effects in the target and suppressing the need for an accelerator or storage ring.
Compared to the mature ILL facility in 2013, ESS neutron scattering instruments aim at up to 100 times the sensitivity for detecting low signals. Compared to SNS and J-PARC (in 2013), ESS will offer up to 30 times more beam intensities in experiments with the same resolution for thermal and cold neutrons.
2.2. Design principles
The basic building blocks of the ESS facility consist of a proton linac, a target and a set of instruments. Each of these components requires auxiliary support services like electrical power, water cooling and air conditioning, cryogenics, active cells for manipulation of activated components, sample preparation laboratories for experiments, logistics etc. In addition, offices, laboratories and workshops are necessary. The overall layout of the ESS facility is represented in figure 1. Details on buildings and infrastructure are given in section 5.

Figure 1. Layout of the ESS facility.
Download figure:
Standard image High-resolution imageSustainability is a key objective of the whole ESS facility: the minimisation of electrical consumption and the optimisation of heat recovery were essential considerations which guided a number of design decisions.
The proton linac is designed for high power and high reliability and uses mainly superconducting cavities, as shown in figure 2. A normal conducting radio frequency quadrupole (RFQ) followed by a DTL section accelerate the ions supplied by the electron cyclotron source up to a kinetic energy of 90 MeV. The rest of the acceleration is achieved with superconducting accelerating structures of three different types. 'Spoke' cavities are used up to 200 MeV, followed by medium-β 6-cell elliptical cavities up to 570 MeV and finally high-β 5-cell cavities up to 2 GeV. A peak RF power of 150 MW is necessary to get the nominal accelerating gradient in the linac accelerating structures. A cryogenic installation provides the cooling power required to keep the superconducting cavities at a temperature of 2 K. Water cooling is used for the normal conducting structures and all high power equipment (klystrons, RF loads, modulators etc). The accelerator is the subject of section 2.

Figure 2. ESS linac layout. Spokes, medium-β and high-β sections are superconducting.
Download figure:
Standard image High-resolution imageThe target station converts the proton beam from the accelerator, through the spallation process into a number of intense beams of slow neutrons delivered to the instruments. The quasi-totality of the 5 MW beam power is dissipated in heat in the target located inside a 6000 tons shielding monolith. Tungsten blades mounted on a wheel rotating at 23.3 revolutions per minute are successively intercepting the proton beam. Pressurised helium gas is used as cooling fluid, reducing the blade temperature by 150° between two shots. Moderator-reflector assemblies surrounding the target transform the fast neutrons produced in the spallation process into slow neutrons. These slow neutrons are guided to the instruments. Multiple services supporting the operation of the target are located in the 130 m × 20 m target station building, as illustrated in figure 3. That includes fluid cooling systems, moderator cryoplant, active cell as well lifting equipment capable to install and remove target and moderators in the monolith. The target station is described in detail in section 3.

Figure 3. Target station building.
Download figure:
Standard image High-resolution imageThe software environment of the control system is based on EPICS [10]. It covers the whole facility including the slow controls for instruments and conventional facilities (CF). The machine protection system (MPS) takes care of avoiding damage to the equipment. The personnel safety system (PSS) handles the monitoring and access equipment required to ensure safety on site. These systems are described in section 4.
2.3. Location
ESS is built on a 74.2 hectare site situated northeast of the town of Lund in the region of Skane in southern Sweden, in the vicinity of Lund University and several major research centres. ESS's immediate neighbours include the 4th generation light source MAX-IV [11] and Science Village Scandinavia. Close from Malmo and Copenhagen (Denmark) and conveniently connected to the rest of the world by the Copenhagen international airport, as shown in figure 4, this set-up will be the core of a world-class science and high technology pole in Northern Europe.

Figure 4. ESS location Map data ©2017 Google.
Download figure:
Standard image High-resolution image3. Timeline
The goal of ESS is to deliver flagship capability to neutron users, ideally complementing a suite of neutron facilities throughout Europe. As of today (2016), ESS is in construction and an important first milestone will be the generation of the first neutrons by the target, in 2019. The accelerator will only be partly built at that time, and beam energy will be 570 MeV. Beam commissioning will continue in parallel with the installation of the early instruments and of the high energy part of the linac Proton energy will reach the nominal value of 2 GeV in 2022. In 2025 the nominal beam power of 5 MW will be available, and commissioning of the initial set of instruments will be completed, as shown in table 2 making ESS fully operational.
Table 2. ESS timeline.
| Milestone | Date |
|---|---|
| Publish technical design report, start of construction | January 2013 |
| Start of civil engineering/conventional facility | June 2014 |
| First installation on-site | September 2016 |
| First beam on target at 570 MeV | December 2019 |
| Accelerator completion (2 GeV beam available) | December 2022 |
| Initial set (16–22) of instruments operational | December 2025 |
| Operation | 40 years period ... |
| Decommissioning | About 2065 |
During its planned lifetime of 40 years, the facility is expected to progress with improvement and/or replacement of the initial instruments and addition of new ones up to a total of up to 35. In addition, the unique characteristics of the ESS facility and its upgrade potential will undoubtedly also trigger proposals for experiments in other domains of physics like, for example, the investigation of neutron–antineutron [12] as well as neutrino oscillations [13].
The ESS Design: Accelerator
H. Danared, I. Alonso, E. Bargallo, B. Cheymol, C. Darve, M. Eshraqi, H. Hassanzadegan, A. Jansson,I. Kittelmann, Y. Levinsen, M. Lindroos, C. Martins, Ø. Midttun1, R. Miyamoto, S. Molloy, D. Phan, A. Ponton, E. Sargsyan, T. Shea, A. Sunesson, L. Tchelidze, C. Thomas, M. Jensen, W. Hees, P. Arnold, M. Juni-Ferreira, F. Jensen, A. Lundmark, D. McGinnis, N. Gazis, J. Weisend II
European Spallation Source, Lund, Sweden
1University of Bergen, Norway
E-mail:
1. Overview
ESS neutrons are released from a rotating tungsten target when it is hit by 2 GeV protons provided by a superconducting linac at an unprecedented 5 MW of average beam power.
1.1. Proton linac design
The number of neutrons produced at the tungsten target is proportional to the beam current, and since the total production cross section in the range of proton energies relevant for ESS is approximately linear with energy, the total flux of neutrons from the target is nearly proportional to the beam power. With 5 MW beam power as one of the ESS top-level requirements, one can then trade beam current for beam energy in an attempt to find optimum accelerator parameters. A lower energy is more economical, since the accelerator then can be made relatively shorter. On the other hand, the current then needs to be higher, giving larger space-charge effects, potentially more beam loss, and hence increased risk. Beam loss is an important factor, since it causes radioactivation of accelerator components and thus may prevent hands-on maintenance, which again increases cost. After careful optimisation and taking user requirements on time structure into account, the main accelerator parameters are those in table 3.
Table 3. Top-level linac parameters.
| Parameter | Units | Value |
|---|---|---|
| Energy | GeV | 2.0 |
| Current | mA | 62.5 |
| Pulse length | ms | 2.86 |
| Pulse repetition frequency | Hz | 14 |
| Average power | MW | 5 |
| Power during pulse | MW | 125 |
The linac has a normal-conducting front-end followed by three families of superconducting cavities before a HEBT brings the protons to the spallation target. Since ESS is a long-pulse source, it can use protons rather than the H− ions needed for efficient injection into the accumulator ring of a short-pulse source. This allows a more robust ion source and eliminates a number of beam-loss mechanisms, notably the intra-beam stripping observed at the SNS in Oak Ridge.
Table 4. Current partners in the accelerator collaboration and their responsibilities.
| Institution | Main deliverables |
|---|---|
| Aarhus Univ (DK) | Rastering system |
| Atomki (HU) | RF local protection system |
| Bergen University (NO) | Seconded staff |
| CEA Saclay (FR) | RFQ, elliptical cavities and cryomodules, diagnostics |
| DESY (DE) | Diagnostics |
| Elettra (IT) | Spoke RF sources, magnets, power converters, |
| diagnostics | |
| ESS-Bilbao (ES) | MEBT, warm linac RF, diagnostics |
| Huddersfield Univ (UK) | RF distribution, radiation protection |
| IFJ PAN (PL) | Manpower for installation |
| INFN Catania (IT) | Ion source, LEBT |
| INFN Legnaro (IT) | Drift tube linac |
| INFN Milan (IT) | Medium-beta elliptical cavities |
| IPN Orsay (FR) | Spoke cavities, cryo distribution |
| Lodz Univ of Techn (PL) | Low-level RF |
| Lund Univ (SE) | Low-level RF |
| NCBJ (PL) | Low-level RF, gamma blockers |
| Oslo Univ (NO) | Diagnostics |
| STFC Daresbury (UK) | High-beta elliptical cavities, vacuum |
| Tallinn Univ of Techn (EE) | IOT modulator development |
| Uppsala Univ (SE) | Tests of spoke cavities and cryomodules |
| Warsaw Univ of Techn (PL) | Phase-reference line, low-level RF |
| Wroclaw Univ of Techn (PL) | Cryogenic distribution |
The different sections of the linac are illustrated in figure 5. The 62.5 mA proton beam is produced in a pulsed microwave-discharge ion source (MDIS) on a platform at 75 kV. A low-energy beam transport (LEBT), with two solenoid magnets as focusing elements brings the beam to the entrance of the radio-frequency quadrupole, RFQ. The LEBT has several types of beam diagnostics and a chopper that cuts away the beam while the proton pulses from the ion source stabilise, preventing a beam with off-nominal parameters from being accelerated in the RFQ and lost at high energy.

Figure 5. Overview of the linac layout. The coloured segments of the bar at the bottom illustrate the relative length of the different accelerator sections.
Download figure:
Standard image High-resolution imageTable 5. Normalised rms emittances along the Linac at the exit of each structure, for the 62.5 mA beam generated at the RFQ input.
| Structure |

|

|

|
|---|---|---|---|
| π mm mrad | π mm mrad | π mm mrad | |
| LEBT | 0.250 | 0.250 | N/A |
| RFQ | 0.253 | 0.252 | 0.362 |
| MEBT | 0.289 | 0.294 | 0.370 |
| DTL | 0.297 | 0.302 | 0.384 |
| Spoke | 0.332 | 0.321 | 0.402 |
| Medium-β | 0.340 | 0.336 | 0.410 |
| High-β | 0.333 | 0.344 | 0.419 |
The 4-vane RFQ bunches and accelerates the beam to 3.6 MeV with small losses and a minimal emittance growth. It is designed specifically for the ESS linac, but it is based on the RFQ of the IPHI facility at CEA. It will be powered by a 3 MW klystron at 352.21 MHz, which is the frequency of the entire warm linac and also of the spoke cavities.
After the RFQ, there is a medium-energy beam transport (MEBT), with three buncher cavities and 11 quadrupole magnets. The MEBT has several different functions: it has optics to match and steer the beam from the RFQ into the drift-tube linac (DTL), it has a comprehensive set of beam-instrumentation devices, it has a chopper that acts faster than the LEBT chopper since space-charge neutralisation is not an issue in the MEBT, and it allows collimation of the transverse particle distribution.
A DTL, with five tanks takes the beam from 3.6 to 90 MeV. It has a FODO structure with permanent-magnet quadrupoles. Every second drift tube is empty or used for steering magnets or beam-position monitors (BPMs). Each tank is powered by a 3 MW klystron, but the klystron modulators serve two tubes, such that there is one modulator for the RFQ and DTL tank 1, one for tanks 2 and 3, and one for tanks 4 and 5.
While the normal-conducting front end provides 80% of the longitudinal phase advance of the entire linac, and thus is highly demanding from a beam-physics point of view, it supplies less than 5% of the particle energy. The rest of the energy is given by three families of superconducting cavities over a length of approximately 300 m. They are all operating with superfluid helium at 2 K.
The first family of superconducting resonators is double-spoke cavities with an optimum beta value of 0.5. There are two such cavities per cryomodule in 13 cryomodules, making a total of 26 double-spoke cavities. They use classical tetrode amplifiers at 352.21 MHz, with two tubes providing 400 kW to each cavity.
Then follow two families of elliptical cavities with geometrical betas of 0.67 and 0.86, referred to as medium-beta and high-beta cavities respectively. The medium-beta cavities have six cells while the high-beta ones have five cells. Because of this, they have almost identical lengths, and the cryomodules, housing four cavities, can be of very similar design for the two types. The medium-beta section of the linac has nine cryomodules and thus 36 cavities, while the high-beta section has 84 cavities in 21 cryomodules.
The transverse focusing is provided by warm quadrupole doublets sitting in the so-called linac warm units (LWUs), between the cryomodules. The LWU also contain BPMs and steering magnets to enable an accurate alignment of the beam. Other beam-instrumentation (BI) devices are installed at selected positions.
The elliptical cavities operate at 704.42 MHz, which is twice the frequency of the preceding structures. Klystrons with a pulsed power of 1.5 MW feed the medium-beta cavities. Each cavity is powered by one klystron, while one modulator feeds four klystrons. The 660 kVA modulators use a stacked multi-layer topology, in order to maximise performance and reliability while minimising the floorspace required in the klystron gallery.
The specifications for the field gradients in the superconducting cavities are higher than at any existing accelerator operating at the same RF frequency with a peak electrical field at the cavity surface of 45 MV m−1. In order to compensate for the risk that these gradients cannot be reached, a section of the tunnel after the last cryomodule is reserved for additional cryomodules as a contingency. If this is not needed, the space can be used for an energy upgrade in order to reach higher neutron fluxes.
The accelerator is built in a tunnel, the roof of which is a few metres below surface level. It is covered by 5 m of soil for radiation protection. The spallation target and the neutron instruments, however, are at surface level, so after a trajectory of nearly 500 m in the tunnel, the beam is deflected upwards at a 4° angle. Another deflection at the surface makes the beamline horizontal again.
This high-energy beam transport (HEBT), ends in a rastering system that spreads the beam to a quasi-rectangular profile before it crosses the proton-beam window (PBW) that separates the beamline vacuum from the Helium atmosphere in the target monolith and finally strikes the rotating tungsten target at a size of 160 × 60 mm2.
A beam dump, capable of absorbing 12.5 kW of beam power, is located at tunnel level underneath the last part of the HEBT. During the accelerator start-up and beam tuning, the beam can be sent into this dump rather than being deflected up towards the surface, and thus tests with the accelerator can be performed even if the spallation target is not yet available for beam.
1.2. In-kind collaboration
The ESS started as a green field in 2009. The design and construction of the accelerator has largely benefited from state-of-the-art competences all over Europe. More than 20 partner laboratories (see table 4) in eleven European countries are contributing. Their geographical distribution is shown in figure 6.

Figure 6. Location of partners in the ESS Accelerator Collaboration.
Download figure:
Standard image High-resolution image2. Lattice design and beam physics
The lattice design of the ESS linac has gone through numerous iterations until reaching a high level of maturity [14–19]. The design must fulfil the required top-level parameters, listed in table 3 and is expected to achieve high beam quality and losses below 1 W m−1. An important goal is to maximise the acceleration efficiency and thus minimise the length and cost of the linac, while staying within the engineering limitations of the components and maintaining beam quality and reliability of the entire machine. In this way, the lattice design is a balancing act among requirements, ideals of beam physics, and engineering and financial constraints. This section presents the lattice design of each ESS linac section as well as the resultant beam physics properties throughout the linac.
2.1. Beam physics and design
The ESS linac accelerates 62.5 mA of protons up to 2 GeV in a sequence of normal conducting and superconducting accelerating structures. These two parameters are defined through technology considerations and optimisations on cost. With a proton pulse of 2.86 ms and a repetition rate of 14 Hz the linac delivers a 5 MW beam. The proton beam leaving the linac paints a rotating target where a high flux of neutrons is generated in the neutron-rich target material at the same repetition rate. Table 5 lists the normalised rms emittance values along the different sections of the linac.
The availability of the facility is one of the high level parameters. Having a high availability requires, amongst others, scheduled and non-scheduled maintenance of the accelerator. Moreover, maintenance studies have has set an upper limit of 1 W m−1 for the uncontrolled losses in the linac In the ESS case, a loss at such a level is in the order of 10−7 with respect to the total beam power, setting a tight requirement on the density of the particles in the beam halo.
2.1.1. Beam dynamics criteria
The ESS linac requires strict loss control to stay below the 1 W m−1 of loss limit [20], and this sets a strong limit on the amount of halo produced in the linac. There are already several mathematical definitions of the beam halo, e.g. [21, 22], and even more publications on the processes in which halo is generated, e.g. [23, 24]. The main sources of halo generation are mismatches, high space charge and tune depression, nonlinear fields, and small longitudinal acceptance which results in particles falling off the accelerating bucket. Such particles will either be left unaccelerated or accelerated to a different energy, in either case resulting in transverse oscillations and eventual loss.
To avoid producing particles that will populate the beam halo this well-known beam physics rules are applied to the ESS linac design:
- The transverse phase advance per period figure 7 is limited to 87° to reduce the percentage of the beam that, due to their phase, would have a phase advance exceeding 90° per period.
- The phase advance per metre (average phase advance) variation should be smooth and continuous. For the ESS design the average phase advance variation is chosen to be monotonic, figure 8.
- The tune depression,
 , must stay above 0.4 in all the planes during acceleration, see figure 9. This limits the number of mismatch resonances to only two (figure 10) from which one is always present irrespective of the tune depression. In order to avoid the second resonance the tune depression should be kept above ∼0.4, [25].


Figure 7. Phase advance per period.
Download figure:
Standard image High-resolution image
Figure 8. Phase advance per metre.
Download figure:
Standard image High-resolution image
Figure 9. Tune depression.
Download figure:
Standard image High-resolution image
Figure 10. Ranges of resonances excited by a mismatch as a function of tune depression. For a given tune depression, each pair of curves define the lower and upper limits of the resonances  which are excited by the odd (blue lines) and even (green lines) mismatch modes [25].
Download figure:
Standard image High-resolution imageOn top of these, both the transverse and longitudinal apertures should be properly chosen, a too large aperture will increase the cost and a too tight aperture will increase the risk of losses. To avoid particles escaping the accelerating bucket the synchronous phase is kept below  at all times, with bigger values at lower energies, figure 11.

Figure 11. Tune depression.
Download figure:
Standard image High-resolution imageThe superconducting section of the ESS linac is designed to have equal tune-depressions in the three planes [26]. An equipartition design would discriminate one or several planes in favour of the other ones if the emittance ratios are not equal to 1, see figure 12. As the emittance ratios at the ESS are  higher in the longitudinal plane compared to transverse, equipartitioning increases halo growth in at least one plane.

Figure 12. Zero current phase advance ratio as a function of the normalised emittance ratio to satisfy the equi-tune depression.
Download figure:
Standard image High-resolution imageThough every section of the accelerator is designed to match the average phase advance of neighbouring structures, a further phase advance smoothness matching is performed during the integration to assure a premium beam quality. As the linac is designed in a collaboration, the design of the linac has also been influenced by the focus on improving the integrity of the accelerator as a single structure and improving the real estate gradient. Matching between the structures is done by using a pair of quadrupoles, and a maximum of four cavities in each side of intersection. In order to have a current-independent linac, all matchings are done by smoothing the transverse and longitudinal phase advance, not just adjusting the Twiss parameters.
2.1.2. Frequency jump
The longitudinal aperture and acceptance are as important as in the transverse plane as any longitudinal losses result in increased longitudinal halo that will cause a loss in transverse plane somewhere downstream in the linac. The longitudinal aperture is defined by the synchronous phase,  , and the amplitude of the field in the cavity, E0 [27]. The phase acceptance is
  and energy acceptance is:

There is a frequency doubling at the transition from spoke to medium β in the ESS linac However, such a change in the frequency causes an abrupt change in the average focusing forces in the longitudinal plane at the frequency jump according to equation (2), which if not handled properly could degrade beam quality and increase losses.

There are studies [28, 29] proposing solutions to avoid these unwanted effects. One of the drawbacks of these methods is that they find solutions by only adjusting the structure which comes downstream of the frequency jump.
At the ESS linac the average phase advance in the spoke section is increased by lowering the synchronous phase gradually. This keeps the phase advance per metre equal to the phase advance per metre at the entrance of the medium-β section. Downstream of the frequency jump also the phases are bigger than what it would have been without the frequency jump, and the accelerating gradient is lowered to limit the phase advance per period to less than 90°.
2.1.3. Transport lines
This section discusses the design criteria of the transport lines in the ESS linac.
LEBT: The LEBT of the ESS linac consists of two solenoids, with a 330 mm length, 50 mm aperture radius, and ∼25 T maximum strength. Its main function is to focus the diverging beam from the ion source to the small aperture of the RFQ. It is estimated that the current out of the ion source can take up to ∼3 ms to be stabilised. Thus, including the required 2.86 ms, the length of the pulse out of the ion source can be up to ∼6 ms. Between the two solenoids, the LEBT houses an electric deflector (slow chopper), with a rise and fall time on the order of 100 ns. The slow chopper removes this initial transient part of ∼3 ms, as well as the short (on the order of 100 μs) transient part in the tail of the pulse, by deflecting this part of the pulse on the conical shape dump mounted on the entrance wall of the RFQ. The other device housed between the two solenoids is the iris with six blades. Taking into account potential losses within the LEBT and RFQ, the ion source is designed to produce a maximum proton current of ∼74 mA.
A MDIS generates a proton pulse up to 6 ms long with a maximum flattop of ∼3ms [30]. The proton intensity (H1+) exceeds 74 mA after the extraction electrodes at an energy of 75 keV.
The source is followed by the LEBT [31], which is composed of two magnetic solenoids (330 mm in length, 50 mm beam aperture radius and a maximum field of ∼0.25 T). The LEBT matches the beam to the RFQ. It incorporates a chopper system that removes low quality head and tail of the beam, a multi-blade iris to reduce the current and a suite of beam diagnostics that measure the beam properties. The gas pressure, distribution and composition in the LEBT is adjusted to compensate 95% of the space charge, this compensation is built within  when the proton beam passes through the LEBT. The ion source and LEBT is designed and built by the INFN-LNS in Catania, Italy.
MEBT: The medium energy beam transport (MEBT) system [32] measures, cleans and matches the beam out of the RFQ structure and transports it to the DTL. The MEBT is equipped with a suite of beam diagnostics to measure the current, transverse and longitudinal properties of the beam and provides means to collimate the beam in transverse using a 3 sets of adjustable collimating blades [33]. The pulse has a head with  uncompensated space charge (and therefore mismatched), a fast stripline chopper device (with a repetition rate of up to 200 kHz) cleans this head and provides short pulses needed for commissioning (in combination with the LEBT iris that creates lower current beams). The MEBT has 11 quadrupoles (80 mm magnetic length, 18.4 mm beam aperture, and ∼2.6 T maximum integrated gradient) equipped with trajectory correcting coils (Maximum integrated field 2.8 mT m) and three copper plated buncher cavities (14.5 mm beam aperture with maximum voltage of 150 kV and maximum power of 22.5 kW) resonating at the beam frequency. The MEBT is designed and built by the ESS-Bilbao, in Bilbao, Spain.
DTL: The DTL accelerates the proton beam energy to 89.6 MeV in five independently powered tanks [34, 35]. Each tank is powered by a 2.8 MW klystron, keeping 30% margin for LLRF, tuning and waveguide losses. 2.2 MW of power is used to excite the cavity and accelerate the beam. At full beam current  of this power is transferred to the beam and the rest is lost as ohmic losses. Higher energy at the DTL entrance results in longer low-energy cells with several positive consequences: longer cells can house bigger quadrupoles reducing the magnetic gradient for the same integrated gradient, longer cells and gaps reduce the magnetic field and the electric field, respectively and higher energy enhances the effective shunt impedance (ZTT). The transverse focusing is provided by Halbach permanent magnet quadrupoles (PMQs), with
  in length, beam aperture of
  (Tank1–5) and a maximum integrated gradient of ∼3.1 T. These are housed in every other drift tube. The constraints present in a DTL require an optimisation process to decide where to put the corrector dipoles and BPMs and how to minimise its quantity. The DTL is designed and built by the INFN-LNL in Legnaro, Italy.
Spoke: The rest of the acceleration in the ESS linac is provided by superconducting cavities. A low energy differential pumping section (LEDP), separates the DTL from the Spokes. Double spoke cavities [36] are used to accelerate the beam from 89.6 to 221 MeV. The choice of spoke cavities enhances the availability and reliability of the linac These cavities can be re-tuned for different beam energies. Such a flexibility permits operation of the spoke section while one or more cavities [37] are not operational. Spoke cavities have a larger transverse aperture compared to conventional normal conducting structures. The 352.21 MHz spoke cavities (maximum gradient of 9 MV m−1 and beam aperture of 28 mm) with an optimum β of 0.50 are housed in pairs in 13 cryomodules [38] and are separated by LWUs. Every LWU is composed of a pair of DC quadrupoles [39] (magnetic length 250 mm, beam aperture 30 mm, and maximum integrated gradient 1.9 T), a dual plane corrector (maximum integrated field 1.2 mT m) and a BPM plus a central slot allocated to beam diagnostics. Depending on the required diagnostics per LWU, there are different LWU across the linac [40]. The spoke cavities and cryomodules are designed and built by the IPN in Orsay, France, and all the corrector magnets and quadrupoles downstream of the DTL by Elettra in Trieste, Italy.
Ellipticals: The RF frequency doubles to 704.42 MHz at the beginning of the following structure in the linac, the medium-β elliptical cavities. There are two families of elliptical cavities [41, 42], that accelerate the beam from the spoke output energy to 571 MeV using 36 medium-β cavities (maximum gradient of 16.7 MV m−1 and beam aperture of 50 mm) and further to 2.0 GeV by 84 high-β cavities (maximum gradient 19.95 MV m−1 and beam aperture ∼68 mm). In both sections, four cavities are housed in cryomodules of identical length [43, 44]. Having different geometric β of 0.67 and 0.86 respectively, the medium-β cavities are given an extra cell (6-cell) with respect to high-β cavities (5-cell) to make the lengths of the two cavity types as close as possible. There are identical LWUs for both elliptical sections. Thus an equal period length in the medium and high-β cryomodules, making them swap-able in case the required gradient in medium-β is not achieved. The elliptical LWU have the same functionality as spoke LWU, with stronger quadrupoles (maximum integrated gradient 2.3T) bigger beam apertures (50 mm), and longer magnetic length (350 mm) plus stronger dual-plane magnetic correctors (integrated field 2.4 mT m). To have the same flexibility at the spoke to medium-β transition the period lengths in elliptical section is chosen to be exactly twice the one of the spoke section. The cryomodules are designed and built by IPN in Orsay and CEA in Saclay, France, the medium-β cavities are designed by CEA Saclay and INFN-LASA in Milan, Italy, finally, the high-β cavities are provided by CEA Saclay and Daresbury Lab in UK.
HEBT: For contingency purposes, the same periodicity, in transverse plane, is maintained for 15 periods after the high-β section in the HEBT. After this contingency area, there is one more LWU which is followed by a vertical dipole with a bending angle of 4° that also works as a switch magnet between the beam dump and the target. In the path to target, after 6 periods of longer doublet focused sections that are adjusted to create an achromat dogleg, the beam is bent to the horizontal plane using a second vertical dipole. This beam is transported to the target using a set of 6 quadrupoles and 8 raster magnets that paint the target surface in horizontal and vertical directions at different frequencies [45]. To reduce the beam centre movement on target due to energy jitter, the phase advance between the second dipole and the target surface is set to be a multiple of 180°.
Dumpline: When the beam is directed to the 12.5 kW beam dump (by switching off the first dipole) the beam is magnified on to the dump entrance face using three quadrupoles. This line is also equipped with an non-invasive profile monitor (NPM), close to the dump to assure that the beam is not focused on the dump surface.
Raster system: The beam density on the surface of the target is desired to be as uniform as possible to achieve the lowest peak density. One can either use a nonlinear magnetic system to achieve this goal, which is very distribution dependent, or paint the area with the beam using dynamic dipolar fields. The ESS HEBT uses a fast horizontal–vertical sweeping dubbed raster system [46]. The raster system is composed of four dithering dipole magnets per plane which sweeps the beam on the target surface within the 2.86 ms pulse, shaping a rectangle of 180 × 60 mm2 (H × V) with almost a uniform density within the footprint that drops to zero at the same rate as the initial beam out of the linac does [45]. These magnets are driven by two triangular waveform currents with first harmonic frequencies of up to 40 kHz and up to fifth harmonics. The raster magnets are designed and built by the Aarhus University.
2.2. Simulation conditions
The beam physics simulations presented in this section are primarily performed with the TraceWin code [47]. The code computes the multi-particle tracking with a 3D space-charge routine, referred to as PICNIC [48], as well as the so-called envelope calculation, where the centroid positions and rms sizes of the beam are propagated through the machine under the linear space-charge approximation. The envelope calculation is much faster than the tracking but less accurate; it was primarily used during the early stage of the lattice design for rough checks of the beam parameters. The tracking simulation has been necessary to check detailed properties of the beam, such as the emittance growth and beam losses, during the completion stage of the lattice design. For the 3D space-charge calculation, the meshing size chosen is  and the number of steps of the calculation is 25 for each
  , where β is the velocity (of the reference particle) with respect to the speed of light and λ is the wavelength of the bunching frequency (352.21 MHz) in vacuum. The number of macro-particles for the tracking ranges from
  to 106, depending on the studied section and type of physics. It is large enough so that the behaviour of the particles which are far from the core can also be observed.
Each beam physics simulations for the ion source, LEBT, and RFQ have a unique aspect compared to the simulations for the rest of the linac Inside the LEBT, the space-charge compensation effect due to the residual gas plays a significant role on the evolution of the beam parameters, as described in [49]. Inside the RFQ, the beam undergoes the bunching process and acquires a RF structure. Because of this, it is not trivial to conduct the beam physics simulation from the source to the end of the linac in one step using only one code. The simulations of the ion source, LEBT, and RFQ are conducted separately from the rest. When studying the global behaviour of the beam throughout the linac, the simulation starts from the entrance of the MEBT with a predefined RFQ output distribution as the initial condition. The predefined RFQ output distribution is generated by transporting a 4D Gaussian distribution, with 0.25 π mm mrad normalised rms emittances and matched Twiss parameters for both plane, from the entrance of the RFQ to its exit using the Toutatis code [50].
Having respected the beam physics design criteria, the beam emittance for the machine without any errors does not dilute over the transport and acceleration, figure 13, and the halo parameter (proportional to the kurtosis of the distribution) stays almost constant, figure 14. The 99% emittance are also monitored to assure that the outlying particles do not behave differently. In the transverse plane, the ratio of 99% to rms emittance stays at ∼12, and in the longitudinal plane it increases to ∼50 after the linac, where there is no more any external longitudinal focusing forces. The aperture to rms size ratio stays above 5 in the DTL, above 10 in spokes, and increases to beyond 20 at the beginning of high-β structure, permitting a low loss transport of beam even with the presence of errors [51].

Figure 13. Rms emittance evolution after the RFQ.
Download figure:
Standard image High-resolution image
Figure 14. Halo development and growth.
Download figure:
Standard image High-resolution imageThe rms beam size stays within 3 mm of radius, figure 15 and the outermost particles do not exceed a radius of 12 mm. The quadrupoles in the spoke and elliptical region have an aperture of 30 mm and 50 mm respectively, resulting in an aperture to rms ratio of almost 10 in the spoke region and around 17 in the elliptical region. These ratios decrease when errors are applied to the linac settings. However, an acceptance evaluation study indicates that the acceptance is one order of magnitude larger than the beam in transverse planes, and two orders of magnitude larger in the longitudinal one.

Figure 15. Rms beam sizes along the linac, from the start of MEBT (top) and rms phase spread of the beam (bottom).
Download figure:
Standard image High-resolution imageMulti-particle end-to-end beam simulations are required to find and remove bottlenecks, to pin-point the sources of halo production along the Linac and reduce their effect, and to improve the beam quality at the end of the Linac. The CEA codes, GenDtl and GenLinWin are used to optimise and generate the structures.
More than 99% of the particles entering the rfq are transmitted through and accelerated to the right energy, without any growth in the rms transverse emittance for a 70 mA beam. Even a completely matched beam rfq generates some minor halo at the beginning of acceleration.
To achieve a large longitudinal acceptance the synchronous RF phase at the entrance to the first dtl tank is set to −35°. As the bunch gets longitudinally focused the synchronous phase gradually increases to −25° in the middle of the first tank to increase the real estate gradient. The lower space charge forces at higher energies, as in the spoke resonators, allow the synchronous phase to increase from −25° to −15°.
The longitudinal acceptance of the five dtl tanks combined is more than 50 times the rms emittance at dtl injection and for the three sc structures it is more than 160 times the area of the matched beam emittance, as shown in figure 16. The large acceptance in the sc structures indicates the effectiveness of the method used during the frequency jump, on top of that one may conclude that such a structure is more tolerant to single cavity failures.

Figure 16. Top: phase-energy phase space of the beam out of MEBT superposed on the acceptance of the DTL plus Spoke. Bottom: Phase-energy phase space of the beam out of DTL superposed on the acceptance of the Spoke (light blue) and SCL (dark blue).
Download figure:
Standard image High-resolution image2.3. Error studies
The nominal design of the beam physics lattice is very demanding. On top of that, the alignment and error tolerances have to be carefully studied as well. The simulation including realistic tolerances needs to prove that the ESS is capable of delivering 5 MW of beam power on target, while keeping uncontrolled beam losses below 1 W m−1.
2.3.1. Strategy and limits
In order to define the tolerances on the active components, large statistical studies with multiple linacs are simulated, each with distributed errors on alignment and field vectors of quadrupoles and cavities. These studies are broken in two steps, initially to investigate the effect of tolerances on each variable, and secondly applying all the errors (normalised to have comparable effects) to simulate the effect. These studies are performed using  macro particles, with
  linacs, depending on the purpose of the study. On each of the produced linacs the error on the variable under study has a uniform distribution limited to maximum error × step of error. In the second set of studies dedicated to simulate the effect and the losses, all the errors are applied: alignment errors with a uniform distribution and jitters with a Gaussian distribution.
As the first step for starting the statistical error studies, it is needed to define a strategy on how to proceed and where to set the limits or, in other words, how large errors to accept. This process can be re-iterated as some of the resulted tolerances, which are not very demanding be tightened in favour of those that are more costly to achieve or maintain. For this first step, the limit on losses is set at a 99% confidence level to be within the 1 W m−1 limit. There is a limit on the emittance growth due to errors too. An emittance two times larger than the nominal case without errors is set as the limit for the final emittance in the presence of errors. As explained above, the ESS linac consists of five accelerating structures, RFQ, DTL, Spoke, medium-β, and high-β, plus two transport lines, MEBT, and HEBT. These sections have different lengths, but it takes almost the same time for the beam to travel through each section. Therefore, the additional emittance growth per section due to errors has been limited to ![$\sqrt[7]{2}-1$](https://content.cld.iop.org/journals/1402-4896/93/1/014001/revision2/psaa9bffieqn20.gif) , or 10% per section in each plane (for 99% of the cases), setting a second limit for defining tolerances.
, or 10% per section in each plane (for 99% of the cases), setting a second limit for defining tolerances.
Having set a strategy in place to define the static tolerances, it is also important to set the limit on dynamic errors and jitters. A dynamic error includes all the errors which cannot be corrected or happen in between different linac tunings. To make sure that the dynamic errors do not cause unwanted effects, the criteria to set them is to have an effect which is less than  rms spread of the beam in the plane of study. The applied errors on the quadrupoles are the alignment and gradient. The cavities have a rotational symmetry, hence alignment errors did not include the roll angle, accelerating field and synchronous phase errors.
To study the transverse errors, a functional beam trajectory correction system is put in place. This has been done by optimising the positions of the steerers and their corresponding BPMs, specially in the DTL, where the number of choices is limited [52]. The main objective in the other parts of the linacis to reduce the number of active BPM, without loosing the control over the beam trajectory. Enabling the correction system, with the right limit on the steerer strengths, the transverse tolerances can be set.
2.3.2. Errors in different sections
The errors investigated in this study belong to one of the following types: machining, welding, positioning, powering, and input beam errors. The errors are uniformly distributed around the defined tolerance.
RFQ: To set the tolerances on the beam parameters at the RFQ entrance, the effects of the position, angle, and Twiss parameters of the beam are studied. The machining errors in the RFQ include errors in the longitudinal and transverse profile of the vanes. The welding errors investigated are the vane welding errors that can be vertical and horizontal shift of the vertical vanes and the effect on the horizontal vanes. These errors can have a different value on the two ends of the vane, still within the limit, which causes a tilt. The RFQ is being built in several sections, and the alignment of these units with respect to each other (shifts and tilts) are also included. The last error that has been covered in the RFQ is the voltage jitter. Tolerances of the RFQ are listed in table 6. The parameters of the beam, their average, and extents are kept at the end of the RFQ. The result of errors on the final beam out of the RFQ is presented in table 7. Finally, the tolerances along the whole linac are presented in table 8.
Table 6. Tolerances of the ESS RFQ (max values).
| Error | Value | Unit |
|---|---|---|
| Input beam alignment position | 0.2 | mm |
| Input beam alignment angle | 2 | mrad |
| Input beam Twiss mismatch (α) | 20 | % |
| Input beam Twiss mismatch (β) | 10 | % |
| Longitudinal vane profile | 0.02 | mm |
| Transverse vane curvature | 0.02 | mm |
| Parallel and perpendicular vane shift | 0.03 | mm |
| Parallel and perpendicular vane tilt | 0.06 | mrad |
| Horizontal and vertical segment shift | 0.03 | mm |
| Segment tilt around X and Y axis | 0.06 | mrad |
| Vane voltage jitter | 0.5 | % |
Table 7. Beam error included in the error studies at the MEBT input (max values).
| dx/dy | dx/dy' | dϕ | dE | d |
Mismatch | dI | |
|---|---|---|---|---|---|---|---|
| mm | mrad | deg | keV | % | mA | ||
| Beam | 0.3 | 1 | 0 | 36.2 | 5 | 5 | 0.625 |
MEBT, SCL, and HEBT: In the MEBT, HEBT and the superconducting linac (spoke, medium-β and high-β sections), the errors applied are the following:
Table 8. Tolerances for the ESS linac (max values).

|

|

|

|

|

|
|
|---|---|---|---|---|---|---|
| mm | deg | deg | % | deg | % | |
| mebt | ||||||
| Quad | 0.2 | — | 0.06 | 0.5 | — | — |
| Cav (S*) | 0.5 | 0.115 | — | — | 1 | 1 |
| Cav (D) | — | — | — | — | 0.2 | 0.2 |
| dtl | ||||||
| Quad | 0.15 | 0.5 | 0.24 | 0.9 | — | — |
| Cell (S) | — | — | — | — | 0.5 | 1 |
| Tank (S) | — | — | — | — | 1 | 1 |
| Tank (D) | — | — | — | — | 0.1 | 0.1 |
| scl | ||||||
| Quad | 0.2 | — | 0.06 | 0.5 | — | — |
| Cav (S) | 1.5 | 0.129 | — | — | 1 | 1 |
| Cav (D) | — | — | — | — | 0.1 | 0.1 |
| hebt | ||||||
| Quad | 0.2 | — | 0.06 | 0.5 | — | — |
| Dipole | 0.2 | — | 0.06 | 0.05 | — | — |
Note. *S: Static, D: Dynamic.
Quadrupoles: alignment of the quadrupoles including their transverse position, rotations around the beam axis, and gradient errors.
Cavities: alignment of the cavities including their transverse position, rotations perpendicular to the beam axis, static and dynamic accelerating field amplitude and RF phase errors.
Dipoles: alignment of the dipoles including their transverse position, rotations perpendicular to the beam axis, and field error.
Input beam: variations of the beam parameters at the end of the RFQ, which represent the beam errors at the input of the MEBT, including the position and angle errors, emittances, mismatch in Twiss parameters, energy jitter and current variations. The nominal distribution out of the RFQ is used as input distribution.
DTL: The DTL uses PMQs for transverse focusing. Each tank is fed by one klystron and therefore all the errors caused at that level are coupled. Synchronous phase and field amplitude in each cell is determined by the shape and position of drift tubes and are mostly random. The applied errors here are:
PMQ: the same type of errors as powered quadrupoles, with different amplitudes, are applied here.
RF: uncoupled field and phase errors are applied to RF cells. These errors are due to machining or installation errors and are static in time. Coupled field and phase errors are applied to all cells of each tank. These errors are due to RF set-points and are both static and dynamic, with different amplitudes.
In the presence of these errors the beam behaves differently than with nominal conditions: mismatches in both planes due to different focal lengths of quadrupoles and cavities, beam centre jitter due to misalignments of such elements and halo growth caused both by mismatch and by longitudinal tails. The positions of the tracked particles are stored during error studies and different post processing methods are performed to get, the losses, confidence levels, or the proximity of the halo to apertures [53].
2.3.3. Loss distributions
For the ESS lattice, it is important to have an excellent knowledge of the expected loss levels in the machine. The accelerator will deliver 5 MW proton beam power, while the losses are required to stay below 1 W m−1 for the entire linac. That means that the relative amount of losses that can be accepted are on the order of 10−4–10−7 per metre, depending on the beam energy where the losses happen.
Losses are seldom distributed evenly. Certain weaknesses in the lattice might produce more losses and the misalignments are more unfavourable in certain regions. It is somewhat easier to predict loss distributions from a lattice than it is to predict their quantitative levels.
The study shown here is done for 20 000 machines with 600 000 macro-particles in each machine. For each machine the nominal tolerances for static and dynamic imperfections defined above have been applied [53, 54]. In order to provoke more losses for the beam loss and activation studies, a dedicated study is performed with doubled dynamic RF amplitude and phase jitters. In the simulation the loss levels are quoted in arbitrary units, as a normalisation would represent losses that are significantly higher than what is actually expected in the machine. The increased dynamic error used does not change the distribution of losses significantly, which makes this a useful way to increase statistics. Simulations are done from the exit of the RFQ until the beam reaches the target.
Figure 17 shows the losses along the linac, where the count is equal to the number of particles lost (i.e. no weight on the energy of the lost particles). There is a dense distribution of losses in the warm linac, a very clean spoke region and then losses from the medium-onwards. The last peak at around 480 m is the beginning of the dogleg, where the off momentum particles are over steered into beam pipe.

Figure 17. The distribution of intentionally enhanced losses along the ESS linac The loss count is proportional to the number of particles lost. The last peak is in the dogleg. Losses in the last 10 m before target is excluded from the figure.
Download figure:
Standard image High-resolution imageThere is an interesting regularity of the losses in the superconducting region which is shown better in figure 18. The figure shows the loss distributions in each period of the medium-overlapped. It can be seen that the majority of the losses are in the warm linac (first 2 m of the figure), but there is a non-negligible amount of losses also inside the cryomodule. The relative amount of losses in the cryomodule may reduce with a more realistic aperture model, and would then be expected to be lost in the beginning of the downstream LWU.
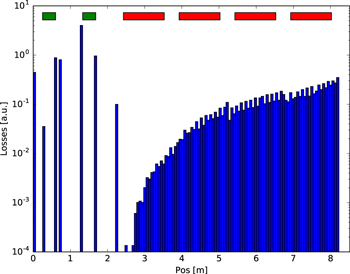
Figure 18. The distribution of intentionally enhanced losses in a medium-period. The LWU is contained in the first two metres, and the cryomodule in the next 6.5 m. The simulation has used a simplified aperture model where the LWU has 50 mm aperture and the cryomodule 60 mm aperture. Quadrupoles are marked in green, and cavities in red boxes.
Download figure:
Standard image High-resolution imageIn figure 19, the energy distribution of the losses in the medium-and start of high-is shown. There are very few losses being initiated from the normal conducting linac and the spoke section. The majority of losses have an energy equal to the medium-input energy of 216 MeV or more. This is expected to originate from the challenging frequency jump between the spoke and medium-section. It is also shown that there are almost no losses from the second half of the region where this data is taken from, indicating that these are slow (longitudinal) losses.

Figure 19. The energy distribution of the particles lost from the start of the medium-and a few periods into the high-section when errors are artificially increased to increase statistics. Almost no losses from the upstream linac are seen.
Download figure:
Standard image High-resolution image3. Accelerating structures
The ESS linac uses multiple accelerating technologies, including superconducting systems, to bring the kinetic energy of the beam to the required value.
Following bunching at 352.21 MHz and acceleration to 3.6 MeV in the RFQ, the proton beam passes through a MEBT in which it is characterised by a full suite of beam diagnostics. It then moves into a DTL containing five tanks, where it is accelerated at 352.21 MHz RF to almost 90 MeV. Following these are the superconducting sections of the linac: 26 double-spoke cavities resonating at 352.21 MHz; 36 medium-β elliptical cavities, and 84 high-β elliptical cavities.
3.1. Ion source and LEBT
The ESS proton source (PS) is a MDIS. This is a type of ion source that is capable of producing high currents of singly charged ions with low emittance. These qualities match well with the ESS requirements that include a proton beam current of 74 mA, and a normalised rms emittance of  at the RFQ entry. Table 9 lists the requirements of the ion source and LEBT.
Table 9. Main beam parameters.
| Parameter | Nominal value | Range |
|---|---|---|
| Proton current |

|

|
| Proton fraction |

|
|
Current stability ( averaged) averaged) |
±2% | |
| Pulse to pulse variation |

|
|
| Beam energy |

|

|
| Repetition rate |

|

|
| Ion source pulse length |

|

|
| LEBT pulse legth (flat-top) |

|

|
| Beam pulse rise and fall time |

|
|
| Emittance (90% normalised) |

|
|
| Twiss parameter α | 1.02 ± 0.20 | |
| Twiss parameter β |

|
|
| LEBT pressure |

|
MDIS use alternating electric fields in the gigahertz (GHz) frequency range to generate the plasma. The microwave energy is coupled to the discharge via a waveguide to a plasma chamber of similar dimensions as the wavelengths of the microwaves. Because there are no internal electrodes that can erode the surfaces, MDIS have very long lifetimes  . An axial magnetic field allows the microwaves to propagate into the plasma even when the electron density is higher than the critical value for the specific microwave frequency. This leads to higher ion densities and beam current.
The ESS PS design, shown in figure 20, is based on the experience of the TRIPS and VIS sources at INFN-LNS (Italy), and the SILHI source at CEA (France) [55]. The microwave and the hydrogen (H2) gas are injected from the backside of the cylindrical plasma chamber. Three solenoids provide the axial magnetic field that can be tuned to best match the injected microwave, and the hydrogen gas pressure. The plasma chamber is held at a potential of 75 kV, and the first extraction electrode at ground potential creates the electric field that pulls out the protons ( ), and co-extracted
  and
and  from the plasma. An intermediate electrode with a negative potential prevents electrons from back streaming into the plasma. The beam then drifts toward the first focusing solenoid of the LEBT.

Figure 20. Schematic view of the proton source for ESS.
Download figure:
Standard image High-resolution imageThe LEBT provides the beam matching from the ion source to the radiofrequency quadrupole (RFQ), and contains diagnostics to monitor the proton beam. Figure 21 shows a cross section of the LEBT 3D model.

Figure 21. 3D model of the proton source and LEBT.
Download figure:
Standard image High-resolution imageThe LEBT consists of two magnetic solenoids, which focus the beam into the RFQ. These solenoids also include a set of horizontal and vertical steerers each to compensate beam misalignments. The iris, which consists of six water-cooled blades, collimates the beam to reduce the beam current when running the accelerator in low-power mode. In addition, the LEBT has a fast electrostatic chopper that removes the first part of the beam pulse during which the ion source plasma needs to stabilise. The electric field from the chopper gives a small kick to the beam such that it still travels through the second solenoid and hits the side of the water-cooled collimator at the end of the LEBT.
To compensate the emittance growth due to the beam space charge, hydrogen or nitrogen gas can be injected into the LEBT to increase the pressure of the residual gas. When the proton beam ionises this gas, the free electrons are trapped by the beam and compensate the Coulomb forces between the protons. The positive ions from the ionised gas are expelled from the beam by the positive beam charge. The increased gas pressure in the LEBT leads to more ionised molecules by beam impact ionisation, thus a higher degree of space charge compensation.
To measure the beam current, the LEBT has a Faraday cup (FC) in the diagnostic box, and a beam current transformer (ACCT) at the RFQ entrance. Two Allison scanners (for horizontal and vertical plane) measure the emittance in the diagnostic box, and a Doppler shift monitor measures the proton fraction at the same location. Two pairs of NPMs measure the beam position and angle. One sits in the diagnostic box, and the other just upstream the collimator.
3.2. Radio frequency quadrupole
The RFQ is a 4-vane type structure resonating at 352.21 MHz. It is divided into five sections, each roughly 0.9 m long, for a total length of 4.55 m [56]. A 3D view of the RFQ is shown in figure 22. The optimisation of the beam dynamics design has resulted in the definition of the ideal pole tip geometry as well as the the inter-electrode voltage, Vp, defined as the voltage without errors, as shown in figure 23. In order to guarantee that the beam quality matches the one predicted by the simulations, any deviation from the nominal parameters shall be minimised.

Figure 22. 3D model of the radio frequency quadrupole (Courtesy of CEA Saclay).
Download figure:
Standard image High-resolution image
Figure 23. RFQ design. Top: aperture versus distance along the axis. Bottom: inter-electrode voltage Vp along the axis.
Download figure:
Standard image High-resolution image3.2.1. RF design
The RF design parameters that need to be specified for the 2D cross section are frequency, length, mean value of electrode tip-to-axis distance r0 versus abscissa z along the RFQ (varying between 3.530 and 5.332 mm), radius of curvature of electrode tips ( mm), and inter-electrode voltage Vp versus z (from 80 kV at RFQ input to 120 kV at RFQ output). The RFQ cross section is designed to achieve the ideal voltage profile Vp(z) by modulating the lateral surface geometry of the electrodes.
Stability analysis shows that, with the proper design of the RFQ end-circuits, the RFQ dipole stabilising rods are not necessary. For this purpose, the vane undercuts are defined to be 41 mm and 45 mm respectively, at the input and at the exit of the RFQ. The quadrupole rods, located close to the pole tips in each quadrant, are located at 50.1 and 50.7 mm, with a translation range from 40 to 60 mm that gives a comfortable tuning interval from −0.1 to  (V m−1) V−1 during the validation process (before the final length is fixed). As a result, the closest quadrupole mode Q1 is located at
  from the fundamental mode Q0. The closest dipole modes are shifted from Q0 by −5.25 MHz for D2 and
  for D3.
Slug tuners compensate the inevitable construction errors. The requirements on the voltage errors are given by:

where UQ is the quadrupolar component and US and UT are the dipolar components of the RFQ voltage Vp indicated in figure 24. A perfect RFQ has UQ = Vp and  . There are 15 tuners per quadrant—60 in total—equally spaced with a diameter of 80 mm. Error analysis shows that with a maximum penetration range of 26 mm in the quadrant, the tuning scheme compensates for construction tolerances of
  with 30% safety margins, assuming that the centre of curvature of each electrode tip is located in a square with side
  (centred at its theoretical location), and the difference between actual and theoretical electro tip profiles is bounded by δ. At position 0 the resonant frequency is 349 MHz.

Figure 24. Voltage representation in the RFQ cross section.
Download figure:
Standard image High-resolution imageThe voltage profile and the frequency is adjusted after an initial dedicated bead-pull measurement in the magnetic field region of the RFQ. The RFQ goes through its final tuning once installed at its final position in the tunnel. The position of the bead trajectory is close to the quadrant bottom walls, with a total of 30 field sampling-points per quadrant. In the absence of experimental errors the voltage profile can be reconstructed with a relative accuracy of 10−4. A unique feature developed for the ESS RFQ is the use of adjustable tuners that allow higher efficiency, time and risk reduction, including the possibility to re-tune the RFQ during its lifetime. Voltage profile monitoring is performed by a total of 20 pick-up loops that are located in the mid-plane of each module, calibrated against a reference bead-pull measurement.
The RF power is coupled to the RFQ through two coupler loops with a design optimised to minimise voltage perturbations. Both loops are located close to the RFQ mid-point, where modes Q1 and D3, most sensitive to perturbations, present a voltage node. The loops are placed in opposite quadrants, as shown in figure 25, in order to avoid inducing dipole-like perturbations. The power coupled into the RFQ cavity is adjusted by rotating the loop, giving the maximum coupling when the loop is aligned to the transverse plane. Each loop is specified to handle a coupled power of 1 MW, although it is expected that the maximum power transmitted during operation will nonetheless be limited to 0.8 MW, equally balanced between the couplers, in order to meet the RF budget detailed in table 10.

Figure 25. Cut view of the RFQ power couplers (Courtesy of CEA Saclay).
Download figure:
Standard image High-resolution imageTable 10. RFQ power budget.
| Component | Power |
|---|---|
| kW | |
| Copper power dissipation | |
| 2D design | 524 |
| Input and output end circuits | 5 |
| Vacuum ports | 62 |
| Tuners at +26 mm max position | 408 |
| Wall roughness | 100 |
| Total dissipation, theoretical 3D design | 1099 |
Maximum operational power ( ) ) |
1375 |
| Beam power | 225 |
| Maximum total coupled power | 1,00 |
Active water cooling controls the RFQ deformations due to power losses on the cavity walls that cause frequency shifts. The cooling channels are located in the cavity body, close to the electrode tips. The temperature of the water is kept constant at  , enabling the electrode temperature (close to the body temperature) to be set with a precision of
  . The cooling water circulation is alternated from one section to the next.
3.2.2. Fabrication design
The five sections of the RFQ are assembled using positioning pins, RF seals and Helicoflex seals (or gaskets). The RFQ is also equipped with 60 tuners, 2 couplers (4 coupler ports in total), from 8 to 10 turbomolecular pumps (TMPs) (36 vacuum ports in total), 22 pick-up ports including 2 for LLRF (28 ports in total), and 80 cooling connectors on 40 cooling plates.
Each section is made of four poles (one per vane) in pure copper, two minors and two majors as shown in figure 26. Pure copper (Cu-OFE,  Cu) is the main material used for the bulk of the RFQ, components and ports (except for stainless steel flanges) chosen for its high electrical and thermal conductivity as well as for its brazing possibilities. Every pole comes from the same casting in order to assure identical properties. Poles undergo several annealing and stress relieving heat treatments at different steps of the manufacturing process to eliminate stress or constraint in the material. A high isostatic pressing treatment during RFQ manufacture avoids any milimetric shrinkage defect or porosity in the copper. The ports are pure copper tubes with stainless steel flanges. Poles are machined with a precision of
  and then positioned and brazed with a
  precision, according to beam dynamics and RF studies and design.

Figure 26. Minor (yellow) and major (blue) poles, with brazing planes in between (Courtesy of CEA Saclay). Cooling channels maintain the pole temperature with a precision of  .
.
Download figure:
Standard image High-resolution imagePole and port assembly is performed in two brazing steps under vacuum. The first is a bi-metal brazing between the copper tube and the stainless steel flange, at high temperature, to obtain a port (i.e. vacuum, tuner, pick up or coupler port). The second step is a copper–copper brazing, at  , to precisely assemble the poles and ports on the poles. The manufacturing process includes different machining steps and cleaning processes, consistent with brazing, vacuum and RF conditions.
3.3. Bunchers
The MEBT line contains three buncher cavities that maintain the bunch shape and match the beam into the subsequent structure, in longitudinal phase space. The MEBT lattice is very compact. Space allocation of the BI and focusing elements results from careful beam dynamics optimisation. Balancing the quality of the beam transport throughout the linac with the ability to characterise the beam parameters in the MEBT in different operational modes of the accelerator (i.e. beam commissioning, start-up and production modes) imposes the specific buncher cavity requirements listed in table 11.
Table 11. Main requirements for the MEBT bunchers.
| Parameter | Units | Value |
|---|---|---|
| Cavity peak field | Kilpatrick |

|
Maximum gap voltage, 
|
kV |

|
| Cavity aperture | mm |

|
| Longitudinal space (flange to flange) | mm |

|
| Maximum RF coupler power | kW | 22.5 |
| Maximum peak power coupled into the cavity | kW | 18 |
3.3.1. RF design
The requirements of table 11 imply that the quality factor Q0 and the shunt impedance rsh must be laeger than 18 000 and 1.26 MΩ, respectively. Careful cavity shape optimisation generates the results presented in table 12, showing comfortable design margins compared to the requirements, and operational margins to adjust the proton beam energy if the RFQ output energy is lower than expected.
Table 12. RF parameters after cavity shape optimisation.
| Parameter | Symbol | Units | Value |
|---|---|---|---|
| Resonant frequency | f | MHz | 352.2 |
| Kinetic energy | W | MeV | 3.6 |
| Gap voltage | V0 | kV | 150 |
| Quality factor | Q0 | 23 477 | |
| Transit time factor | TTF | 0.643 | |
| Shunt impedance | rsh | 1.65 | |
| Dissipated power | Pdiss | kW | 13.7 |
| Kilptrick factor | kp | 1.43 |
Power is coupled into the cavity via an inductive loop. Its prototype is shown in figure 27. The input coupler uses a standard flanged rigid coaxial interface, while the output coupler interface is a standard ConFlat vacuum flange inserted into the buncher cavity. The optimisation goal is to obtain  dBs in a wide frequency band from 300 to 400 MHz.

Figure 27. MEBT buncher prototype (Courtesy of ESS-Bilbao). Left: power coupler. Right: cavity half.
Download figure:
Standard image High-resolution imageA fixed slug tuner on the cavity is used to compensate the frequency shifts due to machining and assembly errors. A movable tuner is available for the low level RF (LLRF) system to tune the cavity frequency during operation, with a frequency correction of up to +2 MHz. A magnetic loop probe samples the field in the cavity, with minimal effect on the axial field. Active water cooling with an inlet temperature of  minimises deformations during operation, paying particular attention to the nose region where the heat deposition is the highest and where the accelerating field is the most sensitive to changes in shape.
3.3.2. Construction design
The cavity mechanical design comprises two main pieces: one includes the cavity barrel and a cover, while the other includes only one cover [57]. Each piece is made of stainless steel (AISI304). Commercial flanges are welded to the body after machining. Once all the components of the cavity are assembled, the interior of both pieces is plated with  of copper, creating a layer thick enough for the RF requirements. Both parts will be assembled using an aluminium seal with raw stainless steel surfaces, to guarantee the vacuum requirements.
The model is fabricated with all the ports opened and the tuners (one fixed and one movable) in the correct positions. The assembled cavity is then measured to verify the design and to check the resonant frequency. The cover piece edge is machined later, shrinking the gap length when the full cavity is assembled, and resulting in a lower resonant frequency. This process continues iteratively until the desired frequency is obtained. A buncher prototype built and tested at ESS Bilbao (Spain) is shown in figure 27.
3.4. Drift tube linac
The DTL is designed to operate at 352.2 MHz with a 4% duty cycle (3 ms pulse length, 14 Hz repetition period), accelerating a proton beam of 62.5 mA pulse peak current from 3.62 to 90 MeV [58]. The DTL design is similar to the CERN LINAC4 DTL; it is a 38.8 m long, divided into five tanks. Each tank is a standalone structure, composed of four 2 m long modules made of AISI 304L stainless steel with internal electro-copper deposition. The drift tubes are positioned on a girder, a precisely machined aluminium alloy structure, which is housed in the upper part of each module. The DTL design parameters are listed in table 13, and the 3D model of the first tank is shown in figure 28.

Figure 28. 3D model of the first DTL tank, with its supporting stands (Courtesy of INFN/LNL).
Download figure:
Standard image High-resolution imageTable 13. DTL design parameters.
| Tank | 1 | 2 | 3 | 4 | 5 | |
|---|---|---|---|---|---|---|
| Cells | 61 | 34 | 29 | 26 | 23 | |
| E0 | MV m−1 | 3.00 | 3.16 | 3.07 | 3.04 | 3.13 |
| Length | m | 7.62 | 7.09 | 7.58 | 7.85 | 7.69 |
| Bore radius | mm | 10 | 11 | 11 | 12 | 12 |
| PMQ length | mm | 50 | 80 | 80 | 80 | 80 |
| Kinetic energy | MeV | 21.29 | 39.11 | 56.81 | 73.83 | 89.91 |
3.4.1. Drift tube design
The drift tubes bodies are made from OFE copper, with copper electro-plated AISI 304L stems. After inserting the internal components, such as the BPMs, the electro-magnetic dipoles, and the PMQs, the drift tube bodies are vacuum brazed and sealed by electron-beam-welding. Prototypes of a drift tube and a PMQ are shown in figure 29.

Figure 29. Drift tube linac component prototypes (Courtesy of INFN-LNL). Left: a drift tube body. Right: a permanent magnet quadrupole that is inserted inside the drift tube body.
Download figure:
Standard image High-resolution image3.4.2. RF design
The post couplers needed for RF stabilisation do not need to be bent, thanks to the choice of constant E0 in each tank [59]. The linear density of the post coupler distribution along each DTL tank varies like

with the increasing cell length and with the 2 m tank modulation. The detuning induced by the post couplers is +20 kHz.
One 2.9 MW klystron feeds each DTL tank. A 30% fraction of that power goes to waveguide losses and LLRF regulation. The remaining 2.2 MW enters the cavity through two iris couplers located at 1/3 and 2/3 of the tank length to minimise the induced field perturbation. The coupling strength is optimised in order to critically couple the waveguide and the beam loaded cavity. The iris height and aperture allow a coupling strength  , with a 20% margin that can be adjusted by shifting the short circuit at the end of the waveguide.
Tuners compensate for static frequency errors as large as ±750 kHz caused by construction errors, taking into account realistic tolerances on the principal DTL dimensions, such as tank diameter, and drift tube lengths, diameters, and face angles. The tuning sensitivity is 7.0 (kHz mm−1)× m, with a diameter of 100 mm. Frequency errors due to thermal deformations in operation are corrected by three movable tuners in each tank, with a tuning range from +120 kHz at the maximum penetration depth of 80 mm, to −90 kHz at zero penetration. The nominal water cooling temperature is optimised during the RF conditioning phase, to benefit from a thermal tuning range from +40 kHz at  , to −100 kHz at
  .
.
The principal DTL RF parameters are summarised in table 14.
Table 14. Principal DTL RF parameters.
| Tank | 1 | 2 | 3 | 4 | 5 | |
|---|---|---|---|---|---|---|
| Post couplers | 24 | 23 | 28 | 25 | 22 | |
| Tuners | 24 | 24 | 24 | 24 | 24 | |
| Tuning range | MHz | ±0.75 | ±0.75 | ±0.75 | ±0.75 | ±0.75 |
| Q0 (25% margin) | 42 512 | 44 456 | 44 345 | 43 895 | 43 416 | |
| Dissipated power | kW | 870 | 862 | 872 | 901 | 952 |
3.5. Spoke cryomodules
Cryomodules containing spoke cavities are used in the first superconducting section of the accelerator. The ESS spoke superconducting linac consists of twenty-six double-spoke cavities to accelerate the beam from the DTL at 90 MeV up to the 216 MeV at the entrance of the elliptical cryomodule section. Like the elliptical cavities, the spoke cavities provide the capacity to transfer energy from RF system to the beam, the capacity to confine the protons longitudinally and the capacity to steer the protons longitudinally.
Figure 30 shows the spoke cryomodule, which contains a cavity string, consisting of two SRF spoke cavities inside their helium tanks, two RF power couplers, two cold tuners, two UHV gate valves, including two small diameter dished ends for the cryostat closure and two cold-warm transitions; one cold magnetic shield per cavity; a thermal shield (TS); several multi-layer insulation blankets covering the cold mass and the TS; several rods for the mechanical anchoring and positioning of the cavity string inside the vacuum vessel; cryogenic piping for the helium distribution inside the cryomodule; vacuum, cryogenic and RF instrumentation for the cryomodule operations; and a vacuum vessel, equipped with dished ends for the insulation vacuum closure, and alignment devices and several ports for interfacing with the vacuum pumping system, the control and measurement instrumentation, and the safety equipment (e.g. relief valves, burst disk, etc).

Figure 30. View of the spoke cavity cryomodule.
Download figure:
Standard image High-resolution imageThese cryomodules operate at 2 K, each containing two spoke cavities with a nominal resonant frequency of  , regulated within a range of at least
  . Frequency control is provided by a slow-tuning mechanism that sets the low-power resonant frequency of the cavity, and a fast piezo-tuner to compensate for Lorentz force detuning. The design ensures that the entire
  long beam pulse is efficiently accelerated when pulsed at the nominal repetition rate of
  . Therefore, the high-power couplers can handle an RF pulse at least as long as the beam-pulse length plus the cavity fill-time.
3.5.1. Spoke cavity design and simulation
The electromagnetic design of the spoke cavity is guided by the resonant frequency, the optimum beta and the optimisation of the peak surface fields. Whereas the most important parameter for the beam is the accelerating field (or voltage) seen by the beam, two other important parameters are the ratios of the peak surface fields to the accelerating gradient; the peak electric and magnetic surface fields should be minimised for a given accelerating field. Another important parameter is the overall length of the cavity. A spoke cavity has re-entrant end-cups that can be lengthened to give more volume per unit of stored energy, thus decreasing the peak surface fields. Such lengthening has the drawback of decreasing the real-estate gradient, with more longitudinal space taken to produce the same accelerating voltage.
The spoke cavity is designed and optimised using the 3D CAD tools of the CST Microwave Studio software package. First the fundamental TM010 accelerating mode is calculated with reduced CPU-time, by applying a magnetic boundary condition ( ) to both symmetry planes of a geometric model of 1/4 of the cavity. The main goal is then to reduce the peak surface field ratios to

using an optimisation procedure that is divided into three parts:
- (i)Optimise the geometry without any cavity body ports.
- (ii)Integrate the RF coupler port with the cavity body and perform Qext calculations.
- (iii)Include all ports: RF coupler, pick-up probes and ports dedicated to cavity preparation (chemistry and rinsing).
Benchmark tests show that at least 105 hexahedral mesh cells are required in order to calculate accurate values of both  and
and  ratios. Table 15 lists the cavity design parameters, after the optimisation is complete.
Table 15. Simulated spoke cavity design parameters.
| Parameter | Units | Mesh type | |
|---|---|---|---|
| Hexahedral | Tetrahedral | ||
| Number of mesh cells | 106 | 1.2 | 0.65 |
| Optimum β | 0.50 | 0.50 | |
Peak electric field, 
|
4.96 | 4.47 | |
Peak magnetic field, 
|
mT (MV m−1)−1 | 7.03 | 6.74 |
| Shunt impedance, r/Q | Ω | 428 | 427 |
3.5.2. Power-coupler for spoke cavities
The power coupler has the double role of supplying RF power to the cavity while insulating the cavity vacuum from the atmospheric pressure inside the RF line. The design is based on the coupler developed for the superconducting spoke cavities in the framework of the EURISOL design study. To adapt that design to the ESS power coupler requirements, a water-cooling system is integrated in the inner antenna and the water-cooling system of the 100 mm diameter ceramic window has been modified to direct the water flow more effectively. The outer conductor is cooled with supercritical helium. The ESS spoke power coupler has been designed for a peak power of 400 kW (335 kW nominal) and its doorknob transition from coaxial to half height WR2300 waveguide. The power coupler prototype can be seen in figure 31.

Figure 31. Prototype of the power-coupler for spoke cavities.
Download figure:
Standard image High-resolution image3.5.3. Cold tuning systems (CTSs) for spoke cavities
Each ESS double-spoke cavity is tuned with a double-level arm type tuner with eccentric shaft actuated by a cold motor and equipped with 2 piezo stacks (figure 32). The coarse tuning range is about +170 kHz with a maximum stroke of 1.3 mm and the fast tuning range shall be +675 Hz minimum to compensate the dynamic Lorentz force detuning. Two versions of CTS have been designed in order to test three different lengths of piezos and two sets of each version have been fabricated. The CTS version 1 (nominal configuration) can host 36 mm and 50 mm long piezos whereas the version 2 (optional design) can host 50 mm and 90 mm long ones. Several configurations of CTS version 1 and 2 have been investigated during vertical tests of the cavities.

Figure 32. 3D model of the cold tuning system for the ESS spoke cavites.
Download figure:
Standard image High-resolution image3.5.4. Spoke cryomodule design
Spoke cavities operate in a boiling bath of superfluid helium at a temperature of 2 K and a stable pressure of 31 mbar. The cryogenic transfer line (CTL) distributes 4.5 K, 3 bar helium for cool-down and for nominal operations of the equipped cavities and the RF power couplers, from the cryoplant, which also serves the medium and high beta sections of the linac. Two helium return lines operating at 1.05 bar and 31 mbar close the cold mass cooling circuit. A valve box between the CTL and each cryomodule distributes cryofluids via a jumper. A vacuum barrier placed on the tunnel side of the valve box permits each cryomodule to be individually disconnected without warming-up its neighbours.
The CTL also provides 19.5 bar helium from an additional circuit to operate a TS at an intermediate temperature range of 40–50 K. This coolant is efficiently re-used at both ends of each cryomodule to intercept heat on the cold to warm transitions that link the cold beam pipe to the warm ultra-high vacuum gate valves.
Superfluid helium is produced at each cryomodule by a subcooler heat exchanger and an isoenthalpic expansion Joule–Thomson valve, placed within the jumper. Superfluid helium is collected into a biphasic pipe with an internal diameter of 63 mm, and is distributed through the top port of the cavity helium tank for filling. Complete cavity tank filling is regulated by measuring the superfluid helium level with a double wired superconductive gauge inside the biphasic pipe collector. In normal operation the biphasic pipe ensures the collection of the pumped saturated vapours. In the worst accident case of a beam vacuum break associated with an air entry into the beam pipe, it ensures the brutal evacuation of warmer gas towards the burst-disk.
The single-window power coupler is connected to the cavity by a double-wall tube. Heat conducted from ambient temperatures and from RF dissipation is intercepted by supercritical helium circulating in three parallel channels inserted helicoidally along the double-wall tube. Laminar flow in these channels, each 1.5 mm  , allows a mass flow rate of about 0.015 g s−1 with a limited pressure drop. The ceramic window and the antenna of the coupler are cooled at room temperature by two demineralised water circuits that can also be connected into a single circuit for the series of cryomodules. The magnetic shield of the cryomodule is actively cooled by the helium cooling line, before the cavities make the transition into the Meissner state.
The cryogenic distribution is dimensioned to handle the estimated static heat loads given in table 16. Dynamic loading induced by RF and beam dissipation brings an additional 4 W into the superfluid helium bath of each cryomodule, and requires about 0.015 g s−1 of liquefaction power to cool each power coupler. The resultant cool-down times are four hours for the thermal and magnetic shields and eight hours for the cold mass. This gives sufficient margin for a full cooling time of one day.
Table 16. Static heat loads for each spoke cryomodules.
| Components | 40 K | 2 K |
|---|---|---|
| Watts | Watts | |
| Thermal radiation | 10.0 | 0.5 |
| Supporting system (rods) | 4.0 | 0.2 |
| Cold to warm transitions (2 items) | 0.8 | 0.9 |
| RF couplers (2 items) | — | 2.0 |
| Cryogenic distribution | 3.0 | 1 |
| Safety equipment | 4.1 | 0.75 |
| Instrumentation | 8.0 | 0.2 |
| Total | 30.0 | 5.6 |
3.6. Elliptical cryomodules
Cryomodules containing elliptical cavities are used in the last two sections of the machine. The geometric-β of the cavities and the number of resonant cells per cavity are the main differences between these two sections. While these two differences lead to several other design divergences, the exterior interfaces of the cryomodules are identical, streamlining the prototyping process.
Both cryomodule families operate at 2 K and contain four elliptical cavities, operating at a nominal RF resonant frequency of 704.42 MHz in the π-mode of the fundamental passband. Frequency control is provided by a slow-tuning mechanism to set the low-power resonant frequency of the cavity, and by a fast piezo-tuner to compensate the Lorentz force detuning, over a range of at least 200 kHz, with a minimum below 704.37 MHz and a maximum above 704.47 MHz.
The linac accelerates the entirety of a 2.86 ms macropulse when pulsed at the desired rate of 14 Hz, so the cavities and the high-power couplers handle an RF pulse whose length is greater than the sum of the beam-pulse length and the filling time of the cavities. Beam pulses contain protons bunched at 352.21 MHz, with no additional time structure (for example, by chopping bunches from the interior of the pulse), so the beam current in the frequency domain contains peaks at integer multiples of 352.21 MHz, convolved with the Fourier transform of an individual beam pulse. Thus, the beam current spectrum contains peaks up to very high frequencies.
It is vital that the cavities are not resonantly driven in the vicinity of these peaks. Cavity modes must be at least 5 MHz away from all integer multiples of 352.21 MHz. This separation is not possible for the other cavity modes in the fundamental passband. However, each cavity is carefully tuned to have the correct accelerating mode frequency, and so it is possible to predict the frequencies of the passband modes with high accuracy. This allows the requirement to be relaxed for these modes: the nearest modes are at least 1 MHz away from the accelerating frequency harmonics.
Medium-β cavities operate in the energy range from about 220 MeV to about 500 MeV, containing six cells with a geometrical-β of 0.67, and providing an accelerating gradient of 16.7 MV m−1. Although this larger number of cells reduces the velocity acceptance of the medium-β cavities (compared to the five-cell high-β cavities), it greatly simplifies their manufacturability, since the length increase is compensated by the lower geometrical-β. Medium-β and high-β cavities have almost identical lengths, so they are housed in identical vacuum chambers. There is a single cryomodule design, and a single configuration of its external interfaces.
High-β cavities bring the beam from about 500 MeV to the nominal energy of 2 GeV, with a geometrical-β of 0.86, and a gradient of 19 MV m−1.
3.6.1. Power coupler for elliptical cavities
The ESS prototype power-coupler is composed of three main parts:
- A window with its antenna to allow RF power coupling to the cavity and to isolate the cavity vacuum from atmosphere thanks to an alumina disk.
- A cooled double-wall tube to keep a coaxial configuration between window and cavity and allow thermal transition between ambient and cold cavity temperatures.
- A doorknob transition to allow RF matching between the coupler and the RF power source.
The antenna is cooled by a water flow and the external conductor is a double wall with an inner chicane cooled by supercritical helium gas entering the tube at the cavity side flange at 3 bar and 4.5 K. The ceramic windows and antennas are the same for both types of cavities and their Qext is adjusted by using external conductors with two different lengths, one for the medium and one for the high-beta cavities. Three diagnostics are used for protection of the ceramic window: a pressure gauge, an electron pickup antenna and an arc detector. Figure 33 shows the power-coupler system and its cooling circuits. The coupler conditioning is being performed first in travelling wave (TW) with low power, short pulses and low repetition rate. Depending on the couplers vacuum multipactor effect and arc breakdown diagnosis, the average power is increased up to 1.2 MW using  pulses with a repetition rate of 14 Hz (nominal duty cycle). Then the power is maintained at nominal value for at least 15 minutes before decreased to check for multipacting zones. In standing wave (SW) RF conditioning, the measurement is similar to the TW one. However, the RF is totally reflected by a movable short circuit allowing the maximum field position sweeping along the coupler and particularly near the ceramic.

Figure 33. ESS power-coupler interfaces and cooling circuits.
Download figure:
Standard image High-resolution image3.6.2. CTS and mechanical design for elliptical cavities
Since these cavities are aimed to work in pulsed mode, it is important to minimise their sensitivity to Lorentz detuning. To do this, stiffening rings are placed between the cavity cells. The static Lorentz coefficient,  , measures the resonance frequency shift produced by the mechanical deformation induced by the electromagnetic field in continuous wave. The positions of the stiffening rings and the cavity thickness have been optimised in order to minimise
  when the cavity has fixed extremities. The result is a niobium cell sheet of 3.6 mm in thickness and a stiffening ring radius of 84 mm for the high beta cavity. With these values,
  is equal to
  for cavites with fixed ends. An exhaustive list of the corresponding RF and mechanical parameters is given in table 17.
Table 17. Mechanical characteristics of the high beta cavity.
| Parameter | Unit | Value |
|---|---|---|
| KL fixed ends | Hz (MV m−1)−2 | −0.36 |
| KL free ends | Hz (MV m−1)−2 | −8.9 |
| Stiffness | kN mm−1 | 2.59 |
| Df/Dz | kHz mm−1 | 197 |
| max VM stress per 1 mm elongation | MPa | 25 |
| Kp fixed ends | Hz mbar−1 | 4.85 |
| Kp free ends | Hz mbar−1 | −150 |
| max VM stress per 1 bar fixed | MPa | 12 |
| max VM stress per 1 bar free | MPa | 15 |
The CTS is based on the proven mechanical design principles of the CEA tuners (France) that can be seen in figure 34. This type of tuner is working at cryogenic temperature inside the insulating vacuum tank. All the surfaces submitted to friction are treated with a dry lubricant coating efficient at cryogenic temperatures. It combines a slow and a fast tuner. The slow tuner is a double lever system with eccentric shafts actuated by a motor gear box and a screw. This mechanism is running under vacuum at cryogenic temperatures. The fast tuner is made by two piezo actuators that can act simultaneously or not to compensate the Lorentz force detuning. The tuning range of this slow tuner is  .
.

Figure 34. Elliptical cold tuning system.
Download figure:
Standard image High-resolution image3.6.3. Cryomodule design
Figures 35 and 36 illustrate the cryomodule design. The cavity package includes a cavity welded to a titanium helium vessel, a vertical power coupler equipped with a single coaxial ceramic window, a WR1150 doorknob transition, and a cold magnetic shield. The CTS includes two piezo stacks allowing fast and slow adjustment of the resonant frequency. Four cavities are connected by three 140 mm diameter hydroformed bellows, with 100 mm diameter cold-to-warm transitions at each end. Neighbouring beamline elements are connected (and isolated) by two DM 100 ultra high vacuum gate valves.

Figure 35. Elliptical cryomodule 3D view.
Download figure:
Standard image High-resolution image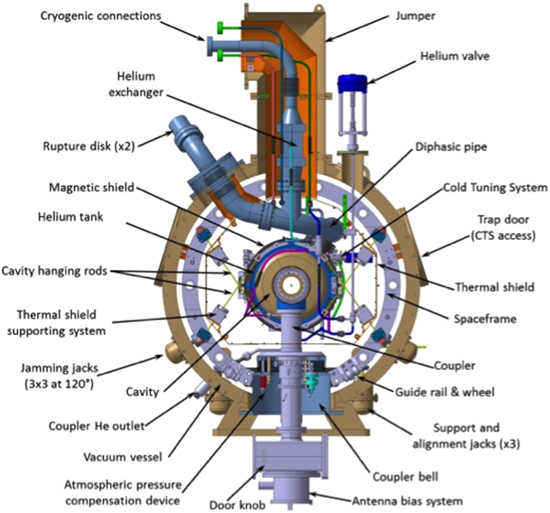
Figure 36. Elliptical cryomodule cross section.
Download figure:
Standard image High-resolution imageThe cavity string is supported within the cryomodule by a network of tie rods made of a TA6V titanium alloy, connected to a stiff spaceframe. The vacuum vessel itself is a 304L stainless steel cylinder with a 1344 mm diameter, capped by two removable lids. Table 18 shows the expected cryogenic heat loads from each elliptical cryomodule. The interface with the linac cryogenic system consists of four helium circuits (inlet and outlet for the cavity string and cooling for the thermal shielding) via a jumper connection.
Table 18. Heat loads for the elliptical cryomodules.
| Components | 50 K | 2/5 K | 2 K |
|---|---|---|---|
| Static | Static | Dynamic | |
| Watts | Watts | Watts | |
| Cavity string (RF on) | 26 | ||
| Beam losses (0.5 W m−1 ) | 3.3 | ||
| Cavity string radiation (14 m2) | 0.7 | ||
| Thermal shield radiation (21 m2) | 31.5 | ||
| Supporting system with thermalisation at 50 K | 6 | 0.25 | |
| Warm-to-cold transitions (2) | 3 | 2 | |
| Helium piping (incl. valves and burst-disks) | 4.23 | 0.78 | |
| Power coupler double wall tube | 4 | (4) | |
| Instrumentation, heaters and actuators | 1.5 | 2.7 | |
| Radiation from coupler antenna to cavity | 2.8 | ||
| Total | 46.23 | 13.23 | 29.3 |
4. RF systems
The RF systems provide the high RF power to the linac accelerating components. This generates the fields that accelerate the protons on their way towards the target. The RF systems get their power from the plant power system. Unused power is absorbed by cooling water, and the generated heat is recycled.
The specification of the RF systems is derived from the accelerator design, which specifies the number and type of cavities as well as the power and the frequency needed for each one. RF systems regulate the amplitude and phase of the cavities to keep the particles moving with minimal losses. ESS has opted to employ one amplifier per cavity in order to gain maximum control over the particle losses. The design is summarised in table 19, which shows the number of cavities, frequency and peak power levels.
Table 19. Number of cavities, frequency and peak power level.
| Linac | Energy | Freq. | Number | Cavities | Geometric | Temp. | Max. |
|---|---|---|---|---|---|---|---|
| section | of | per cryo- | β | RF | |||
| cavities | module | power | |||||
| (MeV) | (MHz) | (K) | (kW) | ||||
| Source | 0.075 | — | 0 | — | — | 300 | — |
| LEBT | 0.075 | — | 0 | — | — | 300 | — |
| RFQ | 3.6 | 352.21 | 1 | — | — | 300 | 1600 |
| MEBT | 3.6 | 352.21 | 3 | — | — | 300 | 20 |
| DTL | 90 | 352.21 | 5 | — | — | 300 | 2200 |
| Spoke | 220 | 352.21 | 6 | 2 | 0.5 
|
2 | 330 |
| Medium-β | 570 | 704.42 | 36 | 4 | 0.67 | 2 | 870 |
| High-β | 2000 | 704.42 | 84 | 4 | 0.86 | 2 | 1100 |
| HEBT | 2000 | — | 0 | — | — | 300 | — |
The subsystems described in this section are listed in table 20.
Table 20. RF subsystems.
| Subsystem | Function | Used where |
|---|---|---|
| High voltage power converter | Generates high voltage to power amplifiers | For tube amplifiers |
| High power amplifier | Provides high power RF | At each cavity and as tube amplifier predrivers |
| Low level RF system | Regulates phase and amplitude in cavity | One for every cavity |
| Local protection system | Interlock that protects the RF equipment | One for every cavity |
| Phase reference distribution | Distributes a reference phase along the linac | Along the linac tunnel |
| Master oscillator | Provides the reference phase that is distributed | At the start or end or frequency switch point |
| High power RF distribution | Transports power from amplifier to cavity | One for each cavity |
4.1. RF Gallery
With the exception of the RF amplifier chains, the equipment in the RF gallery connected with components in the tunnel (e.g. machine and personnel protection systems) is primarily rack mounted. For this reason, the gallery layout is largely dominated by the RF equipment including modulators, klystrons, waveguide, loads and circulators. Typically there are also three racks associated with each RF amplifier chain, housing the auxiliary equipment for the klystrons, interlocks and LLRF systems. There is no overhead crane available, which means that a clear path must be maintained to enable the removal and transportation of all equipment including modulators, klystrons and racks.
The building is 16 m wide and the distance between stubs is 17 m. The layout for the different linac sections is dominated by the size of the installed RF and power converter components. Enough space has been reserved to enable installation, maintenance and replacement of equipment.
4.2. High power RF source selection
The technologies selected for the RF sources are listed in table 21.
Table 21. Technologies chosen for the RF source baseline.
| Section | Power | Baseline |
|---|---|---|
| design | ||
| (kW) | ||
| RFQ and DTL | 2800 | Klystron |
| MEBT bunchers | 30 | Solid state |
| Spoke | 400 | Tetrode |
| Medium-β | 1500 | Klystron |
| High-β | 1500/1200 | MB-IOT |
4.2.1. Solid state amplifier
Solid state amplifiers (SSA) are expected to be more reliable, and usually lighter than tube amplifiers. The SSA in the klystron gallery amplify the RF energy from the LLRF to provide the right power to the next level of the chain, or directly to the cavity, as listed in table 22.
Table 22. Solid state amplifiers in the klystron gallery. Output power is quoted at the 1 dB compression point.
| RFQ | Bunchers | DTL | Spokes | Medium-β | High-β | |
|---|---|---|---|---|---|---|
| Number of SSAs | 1 | 3 | 5 | 26 | 36 | 84 |
| SSA input to | Klyst. | Cavity | Klyst. | Tetr. | Klyst. | IOT |
| Frequency (MHz) | 352.21 | 352.21 | 352.21 | 352.21 | 704.42 | 704.42 |
| Output power (kW) | 0.2 |
 peak peak |
0.2 | 7.4 | 0.2 | 15 |
| Min. gain (dB) | 53 | 76 | 53 | 69 | 53 | 73 |
| Goal efficiency (%) |

|
46 | 50 | |||
| PS AC voltage (V) | 230 | 400 | 230 | 400 | 230 | 400 |
| PS phases | 1 | 3 | 1 | 3 | 1 | 3 |
| Operation class | A | A or AB | A | A | AB | |
| Cooling (Air/Water) | A/W | Water | A/W | Water | A/W | Water |
| LDMOS technology | Yes | (Open) | Yes | (Open) | Yes | Yes |
In addition to the gain and output power (quoted at the 1 dB compression point) the main points of the specifications are:
- RF Pulse and rise time
- Power stability during the pulse
- Phase stability during the pulse
- Power stability between pulses <3% (or 0.12 dB)
- Phase stability between pulses <2°
- Gain and phase variation
- Harmonics
- Voltage SW ratio
4.2.2. RFQ and DTL klystrons
The normal-conducting section of the linac operates at 352.21 MHz and contains the RF quadrupole and five DTL tanks, each fed through two couplers by an individual power source. The power requirement for this section is about 1.6 MW for the RFQ and 2.2 MW for the DTL tanks, plus 30% to compensate for losses and overhead required for regulation. This brings the power required from the source up to 2.1 MW for the RFQ and 2.9 MW for the DTL.
ESS uses six 352.21 MHz, 3 MW klystrons to feed the RFQ and DTL tanks. Klystrons at this frequency and power level are usually very long devices (more than 5 m) and they will be horizontally orientated in the gallery. Klystrons satisfying these specifications are currently available on the market from two different suppliers, as shown in figure 37. The main specifications are shown in table 23. Each modulator feeds two klystrons, with the RFQ klystron sharing the power supply with the first DTL tank.

Figure 37. RFQ and DTL klystrons, delivering 3 MW at 352 MHz.
Download figure:
Standard image High-resolution image
Figure 38. 3D view of the medium-β RF cell. The output of eight klystrons, supplied by two modulators, go to the linac tunnel through one penetration stub.
Download figure:
Standard image High-resolution imageTable 23. Main specifications for the RFQ and DTL klystrons.
| Parameter | Units | Value |
|---|---|---|
| Nominal output power | MW | 3 |
| Frequency | MHz | 352.21 |
| Bandwidth | MHZ |

|
| Pulse width | ms | 3.5 |
| Repetition rate | Hz | 14 |
| Perveance |

|
|
| Efficiency | % |

|
| Voltage standing wave ratio |

|
|
| Power gain | dB |

|
| Group delay | ns |

|
| Harmonic spectral content | dBc |

|
| Spurious spectral content | dBc |

|
4.2.3. Spoke RF power amplifier (RF power station)
The linac spoke section is formed by 26 superconducting accelerating cavities increasing the proton beam energy from 90 to 220 MeV. The RF peak power for this energy gain ranges from 260 to 330 kW at the input coupler of each superconducting spoke cavity.
The maximum required RF peak power of 400 kW meets the request for the cavity accelerating voltage level and takes into account some margin for RF distribution losses and regulation. The tetrodes are the simplest RF power source available to achieve such a power level by means of a combination of two tube transmitters. The choice of this power size allows matching each cavity to one RF power station (RFPS), ensuring an independent control of each system to cope with any phase offset, amplitude level and adjustment required. 26 RFPSs supply the linac spoke section.
The RFPS is the complete system that generates the required RF power levels for acceleration of the proton beam from the electrical grid connection. Driven and regulated by the LLRF signal and triggered at the repetition frequency, the RFPS amplifies the RF power according to the main parameters listed in table 24.
Table 24.
Spoke RF power station parameters. The RF efficiency  is defined as the ratio of the RF output power to the DC power input to the power supplies, during the time of the pulse.
| Parameter | Units | Value |
| Central frequency | MHz | 352.21 |
| Nominal power, peak PN | kW | 400 |
| Nominal Power, average | kW | 20 |
| Bandwidth at −1 dB | MHz |

|
| Gain at PN | dB | 86 |
| RF drive maximum | dBm | 0 |
| Operational mode | Periodic pulsed | |
| Nominal repetition rrequency | Hz | 14 |
| Nominal pulse width | ms | 3.5 |
| Minimum pulse width | μs | 140 |
| RF output line | 6-1/  EIA coaxial line EIA coaxial line |
|
RF efficiency 
|
% |

|
The RF amplification is based on a combination of a solid state pre-amplification and a tetrode amplification stages. Two RF branches are foreseen, with two transmitters. The final output power is achieved by means of high power hybrid combiner. The RF power level is monitored at several consecutive points. Gain and phase adjustment at the beginning of each branch allows the final power combination to be fine-tuned.
The solid state amplification stage has a nominal gain of 71.3 dB with a dynamic range that is optimised for the last 10 dB of the input drive, in order to maximise its linearity in the acceleration power range.
The modulators that supply the tetrode anodes with electrical power are pulsed high voltage power electronic converters. They are physically separated from the other RF power source cabinets. Each modulator has its own internal control and interlock systems, and is fully integrated in the RFPS as a part of the complete system. Each modulator supplies two tetrodes in parallel, hence 26 modulators are required. The tetrode modulators are based on switched mode power converter technology with high voltage stability regulation, high reproducibility and voltage droop compensation.
The main parameters of the modulators are listed in table 25. Key factors are a pulse stability of 0.3% of UA over 2 h, and a reproducibility of 0.1% of UA. AC grid power quality of the modulator follows the best available performances and IEC standard with power factor  and an AC relative voltage flicker of less than 1% within one minute at the nominal repetition rate of 14 Hz.
Table 25. Tetrode modulator rating and parameters. The pulse type is constant voltage, with a pulsed load current.
| Parameter | Units | Value |
|---|---|---|
| Nominal output voltage, UA | kV | 18 |
| Nominal current amplitude, both outputs, pulsed IA | A | 44 |
| Nominal power, both outputs, pulsed PA | kW | 720 |
| Maximum droop or slow oscillation during flat-top | % | 5 |
| Minimum efficiency | % | 90 |
| Voltage ripple, maximum | 0.1 | |
0.3 kHz  1 kHz 1 kHz |
% | 0.3 |
1 kHz  100 kHz 100 kHz |
% | 0.1 |
100 kHz  300 kHz 300 kHz |
% | 0.3 |
| Voltage regulation | % | 0.05 |
A compact design of the RFPS is mandatory to fit all the equipment inside the available service area room. The optimal footprint for the RFPS including the modulator unit is 3600 mm × 900 mm. With this footprint, up to eight complete RFPS can be hosted in a 14 m × 10 m RF gallery area, providing enough space for operation and maintenance. Rear doors or movable panels allow easy access to the main RFPS components. The RFPS is equipped with knobs, switches, display and indicators that permits operation in local mode during commissioning and testing periods.
4.2.4. Medium-β klystrons
The medium-β and high-β sections contain respectively 36 and 84 superconducting elliptical cavities at 704.42 MHz. For regulation purposes each cavity is supplied by a single RF source through one coupler, with RF power levels varying from 225 kW to 800 kW for medium-β, and from 740 kW to 1.1 MW for high-β, depending on the location of the cavity along the linac. The RF source must be able to reliably supply the amount of power required at the cavity coupler, plus a 5% margin to compensate for the losses in the RF distribution system (RFDS), and an overhead for LLRF regulation purposes, currently estimated to be 25% of the coupled power.
Klystrons are used in the medium-β section, and multibeam IOTs in the high-β section. As the MB-IOT is a new technology, klystrons of the same type used in the medium-β section can also be used in the high-β section, as a backup solution. As a result, the medium-β klystrons have to be able to produce up to 1.5 MW of RF peak power at 704.42 MHz, with a pulse length of 3.5 ms at a repetition rate of 14 Hz.
Because of space constraints in the RF gallery (see figure 38), the medium-β klystrons operate in a vertical position, with the collectors at the highest part of the tube. Each single modulator (660 kVA) is used to supply four klystrons. The main klystron specifications are summarised in table 26.
Table 26. Main specification for the medium-β klystrons.
| Parameter | Units | Value |
|---|---|---|
| Nominal output power | MW | 1.5 |
| Frequency | MHz | 704.42 |
| Gun type | Diode | |
| Bandwidth | MHZ |

|
| Pulse width | ms | 3.5 |
| Repetition rate | Hz | 14 |
| Perveance |

|
|
| Efficiency | % |

|
| Voltage standing wave ratio |

|
|
| Power gain | dB |

|
| Group delay | ns |

|
| Harmonic spectral content | dBc |

|
| Spurious spectral content | dBc |

|
The power levels required from the klystrons in the medium-β section vary from less than 300 kW to about 1.1 MW. Operating all the klystrons at the same design beam power (112 kV and 22 A) will lead to an efficiency as low as 11% for the first amplifiers of the section (including 30% overhead). A possible solution is to operate some klystrons at reduced beam voltages, which will also increase their lifetime.
When reducing the beam voltage and current, the space charge forces between the electrons in the klystron vary and the reduced plasma wavelength changes. In this situation, the cavity position, strictly related to the reduced plasma length, is no longer optimal. Furthermore, the impedance of the beam increases in such a way that also the external Q of the output gap is sub-optimal. As a consequence, the saturated efficiency of the tube drops. The external Q of the output cavity can be changed to increase the efficiency at reduced beam voltages by introducing a mismatch at the klystron output.
4.2.5. High power IOTs
The high-β part of the linac accounts for 80% of the accelerator total beam power and consists of 84 high power sources each operating at approximately 1.2 MW.
4.3. LLRF control
The LLRF system starts at the connection to the probe with the cavity, and ends at the feed-point to the power amplifier. It generates an input signal to the amplifier that drives the cavity to a field with an amplitude and phase that are within the requirements for the accelerator.
The baseline design of the LLRF system is similar for both accelerating frequencies, differing only for frequency-specific parts, such as the local oscillator (LO) generation and mixers. The LLRF system is built in a chassis, using primarily commercial, off-the-shelf parts. The chassis chosen is the MTCA.4 chassis, fulfilling requirements on flexibility, size and options for redundancy. The MTCA.4 is a standard developed especially for the physics community, and is a highly modular system. It consists of a crate with modules in pairs, with one module facing the front and the other one the back of the chassis. Sensitive cabling is routed to the back of the crate where it is better protected, and the front panels can be used for monitoring and service. The crates support redundant fans and power modules. Each crate houses a number of modules, including the crate controller, timing receiver, FPGA-board and a CPU running Linux for the EPICS interface.
The LLRF system is based on a digital control structure, in which the automatic control algorithms are executed by an FPGA and a local CPU. The input from the cavity is down-mixed and the RF-signal is sampled in the ADC. The output from the FPGA is converted to an analogue signal in the DAC, and up-mixed to the RF-frequency in a vector modulator. This minimises impacts on phase drifts and frequency errors from the LO, which are synthesised from the reference signal of the phase reference line. The absolute value of the amplitude is measured by the ADC. The timing reference for the phase measurement is given by the signal from the phase reference line. Eight signals are sampled in parallel: the signal from the cavity; the direct output from the vector modulator, the pre-amplifier and the power amplifier; the forward and reflected signal from the cavity; the reflection from the circulator; and the phase reference.
The direct output from the amplifier is used to linearise the amplifier and to close a control loop to mitigate the ripple on the high voltage from the klystron modulators. The reflected signal from the cavity is used to tune the cavity. The automatic control algorithm is based on a classic PI-control structure with pulse-to-pulse feed-forward compensation. Thus, repetitive phase and amplitude shifts within a pulse are corrected by feed-forward compensation, and the loop gain of the feedback loop is reduced. This lowers the necessary overhead in the power amplifier while still achieving the specified amplitude and phase performance. In addition, a separate algorithm to linearise the power amplifier in order to increase system performance is used.
Cavities are tuned by the LLRF system using the slow, servo-driven tuners, and by monitoring the phase and amplitude of the reflected signal. The set point of the tuning of each cavity is given by the control system. Piezo electric actuators in the cavities are used to handle Lorentz force detuning. This is done in a feed-forward network, also implemented in the LLRF system. The superconducting cavities have two piezo actuators, driven in parallel. The system saves time-stamped data from the last pulse for post mortem analysis. A complete LLRF system is housed in a temperature-controlled rack, together with the motion controllers for the tuning actuators.
The linac has one LLRF system per power source. Each system is housed in a separate temperature-controlled rack, as also is the case for the test stand systems. Two main versions of the systems are built, one for each RF frequency. Each cavity type has its own parameters for the control algorithms, and each individual cavity has its unique set-point for phase, amplitude and tuning. The components fitted with LLRF systems include the RFQ, buncher cavities, DTL, spoke cavities, and the medium and high-β elliptical cavities.
The cables from the cavities in the tunnel follow the same path up to the gallery as the cables from the phase reference line. One tap from the line is used for each cryostat in the superconducting part, and one for each cavity in the normal-conducting part. The cables coming from each cryostat, the cavities and their reference, are tied together in order to minimise the phase difference introduced over time between them due to temperature variations. Phase differences in the cable to the power amplifier are handled by the closed loop control system.
4.4. Local protection system
The RF-interlock system is in charge of preventing damage to the RF equipment within each cell and RF chain. It also prevents any damage to other equipment related to the RF station where agreed, typically where fast shutdown of the RF is required, e.g. cryomodule, arc detectors, and power detectors. The RF local protection system works independently for the other accelerator systems, but is controlled and monitored through the EPICS-based main controls system.
The signals are divided into two systems, depending on the required time-of-response: using a fast interlock module (FIM); or a slow interlock module (SIM). The fast interlock functions are critical and are performed in a FPGA module, in order to get the reaction time requirements. The system is deterministic and reliable. The FIM manages the most critical signals with fast time-response requirements, arc detectors, power detectors, pin diode and the external interfaces (MPS, MOD, LLRF). A PLC is in charge of handling signals with the slow time-response requirements, including water-cooling, temperatures, PSU controller, vacuum, etc.
4.5. Phase reference distribution system
The phase reference distribution system (PRDS) provides phase reference signals for all LLRF and beam position monitor systems with low phase noise and low phase drift. PRDS consists of four sub-systems: the RF reference signal delivery system, the temperature control system, the air pressure system and the data acquisition and drift calibration system.
The topology of the PRDS places the master oscillator (MO) in between the 352.21 and 704.42 MHz sections of the linac. Two transition lines transport RF signals from the MO in the klystron gallery to main lines in the tunnel.
Two different pick up signal harmonics are used by the BPIs: 704 MHz in the 352 MHz sections of the linac, and 352 MHz in the 704 MHz sections. The reference line carries these frequencies all the way along the tunnel, with local distribution lines tapping out from directional couplers, reaching as close as possible to the cavity probe and beam position monitor cables. Each cavity or beam position monitor is assigned to a local distribution line, bundled together with the cavity probe signal sent to a LLRF rack or bundled together with four signals to a beam position monitor rack.
4.6. High power RFDS
The high power RFDS extends from the output flange of the high power amplifier (HPA) to the input flange of the fundamental power coupler (FPC). Each single amplifier powers one cavity, so there are 155 amplifiers and RFDS lines. The waveguide length required for a single system varies from 30 to 40 m, depending on each layout. Table 27 gives some details of the RFDS.
Table 27. High power RF distribution system details. HH and FH indicate half height and full height waveguides, respectively.
| Linac | Freq. | Peak | Peak | No. of | Waveguide |
|---|---|---|---|---|---|
| section | power | power, | lines | ||
| to beam | amplifier | ||||
| (MHz) | (kW) | (kW) | |||
| RFQ | 352.21 | 1600 | 3000 | 1 | WR2300 FH and HH |
| DTL | 352.21 | 2200 | 3000 | 5 | WR2300 FH and HH |
| Buncher | 352.21 | 15 | 30 | 3 | Coax 1-5/ 
|
| Spokes | 352.21 | 330 | 400 | 26 | Coax 6-1/  , WR2300 HH , WR2300 HH |
| Mediumβ | 704.42 | 880 | 1500 | 36 | WR1150 |
| High-β | 704.42 | 1100 | 1500 | 84 | WR1150 |
The RFDS main functional requirement is to transport RF power from the amplifier to the FPC with minimum losses and with no RF leakage. The RFDS also facilitates testing an amplifier on a dummy load, independently of access conditions to the tunnel. It protects each amplifier from unwanted reflections that might be due to mismatches in the cavity or to arcs in the RFDS. Arcs are detected by the RFDS, which signals the local protection system to withdraw RF input to the amplifier.
The RFDS has interfaces with many other systems. It has various interlocks such as coolant flow, coolant temperature, coolant pressure, arc detections, high forward and reflected power etc. These interlocks have physical interface with the local protection system. The RFDS also has an interface with the personal safety system, and with the LLRF system. The RFDS measures forward and reflected power, protecting both the cavity and the amplifier. The LLRF system also uses these power measurements in the feedback system that maintains a certain specified gradient in the cavity. The RFDS takes care of the thermal expansion and contraction and also dimensional changes in building layout, such as changes in the tunnel length and differential settlement of the tunnel with respect to the klystron gallery. It adapts to the construction layout by bending waveguides either in the E-plane or in the H-plane. Functional requirements also include water cooling at some RFDS components, consistent with the site-wide energy recovery system.
4.6.1. General design
Figure 39 shows the basic layout of how the RFDS transmits power from the HPA to the FPC, by means of either waveguides or coaxial lines depending on the power level of the linac module. A dummy load facilitates amplifier testing by dissipating the amplifier power. The high power loads are water cooled, connected in series with the klystron collector cooling circuit, simplifying energy recovery and cooling system design.

Figure 39. Basic layout of the high power RF distribution system.
Download figure:
Standard image High-resolution imageWhen closed, a shutter switch after the circulator connects the amplifier to the load via the circulator, for testing. This scenario depends on the conditions to access to the tunnel and hence on permissions from the PSS. The circulator protects the amplifier from unwanted reflections, using an anisotropic ferrite material that transmits power only in one direction, and directs reflected power to the load.
Dual directional couplers (DDCs) are used to measure the forward and reflected power. The directivity of the DDC decides the error in the measured signal. The LLRF system requires a directivity of more than 40 dB for the DDC. The signal from the DDC is split and used by the LLRF and local protections system. The signal from the DDC is used to protect the amplifier and the cavity with the help of the local protection system. Signals from the DDC will be used to maintain the required gradient in the cavity, with the help of the LLRF system.
Flexible waveguide bellows take care of thermal stresses on critical components, like ceramic windows, in the klystron and in the FPC. Bellows in the stub take care of thermal expansion due to heat generation, and due to relative movement between the gallery and the tunnel. Bellows at the stub exit take care of differential thermal expansion of the tunnel wall and the tunnel flooring.
Microwave devices and systems working in high-power area may quickly build up extremely high electric field strengths that exceed the breakdown strength of the air, causing arcs. Once ignited, these arcs grow and travel towards the RF source. Hence arc detection and switching off the RF drive within 10 μs are vital. Locations prone to arcing are the ceramic window at the amplifier and the circulator and the load. Arc detectors will also be placed on the couplers.
4.7. High voltage power converters
In total, three identical modulators are required for the RFQ and DTL tanks, and nine for the medium-beta elliptical cavities. In addition, 21 modulators are needed to power the IOTs in the high beta section. The powering configuration is illustrated in figure 40, with each modulator feeding 4 klystrons or IOTs in parallel.

Figure 40. Powering configuration of one RF cell in the medium-β section.
Download figure:
Standard image High-resolution image
Figure 41. Maximum values of the magnetic field on the  XY plane for different times.
Download figure:
Standard image High-resolution image4.7.1. Requirements
The main requirements on the klystron modulators, in order of importance, are:
- (i)Safety, health and environmental sustainability: safe and reliable energy storage; biodegradable dielectric materials; efficiency >92%.
- (ii)Pulse power ratings: pulse voltage 115 kV; pulse current 100 A, driving 4 klystrons in parallel; pulse width 3.5 ms; pulse repetition rate 14 Hz.
- (iii)Pulse quality: rise times; high flat-top accuracy better than 0.15%; pulse-to-pulse stability %; reverse voltage %; energy in case of klystron arc J.
- (iv)AC grid power quality: flicker%; THD: %; PF >0.95.
- (v)Reliability: mean time between failures greater than 70 000 h.
- (vi)Accessibility for maintenance and module replacement: mean time to repair less than 3 h.
- (vii)Footprint: width m; depth m; height m; weight total ton; weight per component ton.
- (viii)Cost: as effective as possible.
- (ix)Standard components: use to the maximum extent, with at least two vendors.


Safety is the most important requirement for the modulators, so polypropylene self-healing capacitors are adopted, rated for 1 kV. Their extra cost is largely compensated by their longer lifetime—typically 100 000 h. The total volume of polypropylene capacitor banks represents about 7% of the total modulator volume—not a driving factor for size, weight or footprint. Modulators are heavy and bulky pieces of equipment. There is no crane available in the RF gallery for maintenance reasons, and so the weight of individual components does not exceed a few tons. A modular configuration is used, in which the total power is split amongst several identical components.
5. Linac systems
5.1. Low and medium energy beam transport (LEBT and MEBT)
5.1.1. Pulse shaping mechanism
The proton beam is extracted from the plasma source of the MDIS type (see above). While the extraction voltage is kept at 75 kV, the RF power is pulsed at the nominal beam frequency to form and maintain the plasma. It takes up to 3 ms to reach the stable current once the RF has been switched on and the plasma decays in less than 100 μs when no RF power is available. The undesired transients are deviated to the chopper dump, located in the RFQ cone, by the electrostatic field created in the LEBT chopper to keep only 2.88 ms of stable beam pulse.
Because the rise time of the LEBT chopper is 100 ns chopper, it takes 100 ns to deviate the beam from its nominal axis to the dump (and vice versa). When the LEBT chopper is turned off and the beam is on axis again, it takes between 1 and 20 μs for the space charge compensation, which was annihilated due to the presence of the electric field, to recover and thus producing the matched Twiss parameters into the RFQ. Because of this phenomenon, a second chopper is required in the MEBT. The latter needs to be very fast with a rise and decay time of less than 10 ns to prevent potential hazardous losses at high energy of non fully kicked bunches [60].
5.1.2. Choppers
The linac has two choppers and their associated dumps: one in the LEBT and a second one in the MEBT. The main mission of the choppers is to remove the transients from the beam pulse thus keeping only the stable 2.86 ms of the pulse required on the neutron production target. The source of transients are of two kinds: from the plasma generation in the ion source and from the space charge compensation in the LEBT. This is why it is mandatory set a chopping strategy in two steps. In addition to the their main feature, the choppers are also used for machine protection (MP) purposes. The chopper beam dump in the LEBT can handle the full beam current at nominal duty cycle while the one located in the chopper can withstand a 200 μs beam pulse without damage.
5.1.3. Collimators
The normal conducting part of the linac hosts two types of collimators: an iris between the two solenoids in the LEBT and three pairs (i.e. vertical and horizontal) of scrappers in the MEBT at optimised locations [60] along the beam line. The iris permits to reduce the beam current at a desired level while the scrapers remove the unwanted beam halo that may cause losses at high energy.
5.1.4. Current monitoring
The power of the beam during production mode is not fixed. Moreover, it is important to have the capability to limit the power losses at high energy to an acceptable level if required, while keeping the beam power as high as possible. Because the beam frequency and pulse length are fixed values, the only way to modulate the power is by modulating the intensity of the beam. The ion source alone can only produce stable beams with beam currents not lower than 90% of the nominal. In order to produce very low intensity beams of ∼6 mA with a controllability within 2 mA, an iris with movable blades is foreseen in the LEBT.
5.1.5. Halo detection
As experienced in other facilities such as SNS, the only way to reduce hazardous losses at high energy is to reduce the halo formation in the MEBT. For this purpose three movable scrapers are installed in the MEBT that can remove the beam halo above 3 sigmas.
5.2. Magnets
5.2.1. Magnets for LWUs
LWUs located between the cryomodules in the superconducting linac (SCL) as well as in the HEBT and dogleg part of the accelerator-to-target (A2T) section of the ESS accelerator each contain two quadrupole magnets and one dual-plane corrector magnet for beam focusing and trajectory correction. All magnets are normal-conducting and operate in DC mode. There are three different types of quadrupole magnets and two different types of corrector magnets used in LWU. The LWU located between the spoke cryomodules contain two quadrupoles of type Q5 and a combined horizontal and vertical plane corrector of type C5. The LWU located between the elliptical cryomodules and in the HEBT contain two quadrupoles of type Q6 and a combined horizontal and vertical plane corrector of type C6. The LWU located in the dogleg part of the A2T section contain two quadrupoles of type Q7 and a combined horizontal and vertical plane corrector of type C6. Different types of the quadrupole and corrector magnets have different aperture, length and strength.
All three quadrupoles have a laminated yoke and water-cooled coils. Since Q6 and Q7 have the same bore diameter and the same good field region radius, these two quadrupoles can have the same 2D magnetic design with the same lamination geometry, the same ampere-turns and two different yoke/magnetic lengths. Furthermore, in order to use only one type of power converter, the design of all the quadrupole coils allows adopting the same conductor cross section and the same maximum current, or rather the same maximum current density. In order to minimise as much as possible the power consumptions, the conductor must have a cross section area which keeps the maximum current density lower than 4.5 A mm−2. At the same time, the conductor must have a cooling channel with a diameter sufficiently large to reduce as much as possible the required liquid velocity in order to limit the pressure drop in the cooling circuit.
The magnetic field values and the artistic views of the quadrupoles for the LWUs are shown in figures 41 and 42. The main design parameters are summarised in tables 28 and 29.

Figure 42. Perspective view of quadrupole magnets type Q5 (left), Q6 (middle) and Q7 (right) for spoke LWU, elliptical LWU and dogleg LWU respectively.
Download figure:
Standard image High-resolution imageTable 28. Magnet parameters and performance for quadrupoles type Q5, Q6 and Q7.
| Parameter | Q5 | Q6 | Q7 | Unit |
|---|---|---|---|---|
| Quantity | 26 | 95 | 12 | |
| Aperture radius | 34 | 56 | 56 | mm |
| Yoke overall width and height | 440 | 650 | 650 | mm |
| Good field region radius r0 | 22 | 35 | 35 | mm |
| Yoke length | 170 | 230 | 290 | mm |
| Coils overall length | 250 | 340 | 400 | mm |
| Magnetic length Leff at nominal Ic | 200 | 277 | 337 | mm |
| Maximum integrated gradient | 2.21 | 2.47 | 3.01 | T |
| Harmonic contents at r0 |

|

|

|
% |
| Inductance | 8.2 | 36.5 | 45.0 | mH |
Table 29. Coil parameters for quadrupole types Q5, Q6 and Q7 (in parenthesis the values at the minimum required coolant flow).
| Parameter | Q5 | Q6 | Q7 | Unit |
|---|---|---|---|---|
| Type | Racetrack | |||
| Cooling | Demineralised water | |||
| Conductor cross section | 8.2 × 7.2 mm—hole diam. 3.8 mm = 46.8 | mm2 | ||
| Number of turns | 30 | 61 | ||
| Space between coils and joke | 6 | mm | ||
| Maximum current density | 4.27 | A mm−2 | ||
| Conductor length for one coil | 17.6 | 55.6 | 61.4 | m |
| Resistance for one coil at 35 °C | 7.00 | 21.8 | 24.4 | mΩ |
| Coil overall length | 250 | 340 | 390 | mm |
| Coil mass | 8.5 | 30 | 34 | kg |
| PC maximum required current IRMax | 148 | 173 | 179 | A |
| Power dissipation at IRMax | 0.6 (0.6) | 2.6 (2.7) | 3.1 (3.2) | kW |
| Coolant temperature rise at IRMax | 14.0 (25.0) | °C | ||
| Coolant total flow (minimum required) | 0.7 (0.4) | 2.7 (1.6) | 3.2 (1.9) | l/min |
| Cooling branches number | 1 | 4 | 4 | |
| Coolant velocity on each coil | 0.9 (0.5) | 1.0 (0.6) | 1.2 (0.7) | m s−1 |
| Coolant pressure drop | 3.0 (1.1) | 2.7 (1.0) | 4.0 (1.5) | bar |
The overall dimensions of the correctors C5 and C6 are mainly driven by the LWU layout. In particular, the foreseen available space for corrector installation limits the C5 overall length to 70 mm and the C6 overall length to 100 mm. The full apertures of both correctors are equal to those of the quadrupoles in the corresponding LWU. The correctors are designed as window-frame magnets with the yokes made of laminated steel sheets to minimise as much as possible the eddy currents in the iron in order to allow possible feedback operations. The required field quality has to be better than 4%. Since correctors C5 and C6 are powered by only one type of power converter, the coils use the same conductor cross-section and the same maximum current, or rather the same maximum current density. The correctors are designed so that they can be split into two halves allowing installation around the vacuum chamber.
Artistic views of the correctors for the LWUs are shown in figure 43. The main design parameters are summarised in table 30.

Figure 43. Perspective view of corrector magnets type C5 (left) and C6 (right) for spoke LWU and elliptical/dogleg LWU respectively.
Download figure:
Standard image High-resolution imageTable 30. Magnet parameters and performace for correctors type C5 and C6.
| Parameter | C5 | C6 | Unit |
|---|---|---|---|
| Quantity | 13 | 55 | |
| Yoke width and height | 138 | 206 | mm |
| Yoke length | 35 | 65 | mm |
| Yoke mass | 1.6 | 7.6 | kg |
| Coil cooling | Air | Air | |
| Maximum current density | 1.5 | 1.5 |

|
| Resistance of one coil | 16.1 | 40.4 | mΩ |
| Coil overall length | 68 | 98 | mm |
| Coil mass | 1.4 | 3.6 | kg |
| PC Maximum current IMax | 16 | 16 | A |
| Maximum voltage | 0.5 | 1.3 | V |
| Maximum power dissipation | 8 | 22 | 7 W |
5.2.2. Magnets for A2T
Two vertical dipole magnets D1 bring the beam from the accelerator tunnel (AT) level up to the level of the target where the beam is focused and transported to the target in a straight section using six quadrupole magnets of type Q8. The trajectory correction is done by four combined horizontal and vertical plane corrector magnets type C8. These dipoles, quadrupoles and correctors are all normal-conducting and operate in DC mode. The dipoles and the quadrupoles coils are water-cooled. The main design requirements for these magnets are summarised in table 31.
Table 31. Main design requirements of the accelerator-to-target magnets.
| Parameter | C8 corrector | D1 dipole | Q8 quadrupole | unit |
|---|---|---|---|---|
| Min. aperture diameter | 137 | 112 | 137 | mm |
| Effective length | n.a. | 1800 | 800 | mm |
| Max.overall length | 399 | 2200 | 1000 | mm |
| Nominal bending angle | 0.052 | 4 | n.a. | o |
| Nominal bending radius | n.a. | 25.783 | n.a. | m |
| Nominal magnetic field | n.a. | 0.36 | n.a. | T |
| Nominal integrated field |

|
0.648 | n.a. | T m |
| Nominal integrated gradient | n.a. | n.a. | 7.8 | T |
| Integrated field uniformity |

|

|
n.a. | |
| Magnetic field harmonics | n.a. | n.a. | 10−3 | |
| Quantity | 4 | 2 | 6 |
The dipole magnet is designed with an opening in the yoke to accommodate a special vacuum chamber with a straight-out beam port, allowing the beam transport towards the tuning beam dump, when the dipole is powered-off. Due to an expected remnant field when the dipole is powered-off a correction coil may be added to nullify that field and to allow the beam to pass straight to the tuning beam dump. Two dipoles are powered in series by a single power converter.
5.2.3. Raster scanning magnets
To reduce the time-averaged beam intensity, the ESS will use a fast AC transverse (RSM) system that introduces beam centroid displacements across the target and PBW. The total raster system consists of 8 colinear RSM, two sets of four units each acting in the respective transverse planes. Even though the RSM in a set should ideally be synchronised and share the same field amplitude, each RSM is powered by a dedicated modulator based on a capacitor-charging supply and an H-bridge. Not only does this modular design reduces the magnetic load on the RSM and the peak output power of each modulator, but it is also a straightforward approach to reduce the impact of element failures and implement serial redundancy. An isolated RSM or modulator failure within each set can thus be compensated by a 33% amplitude increase of the unaffected subsystems. To uphold a high reliability, active cooling of magnets and modulators is avoided by operating the system at a duty cycle of only 5%, appropriately more than the 4% beam pulse duty cycle, 2.86 ms at 14 Hz.
To avoid burn-in near pattern edges and corners, the sweep speeds should ideally be constant, while the direction alternates as dictated by the frequency. Each RSM subsystem is thus to generate a pulsed triangular magnetic field waveform, acting in either the horizontal (H) or vertical (V) direction.
Maintaining a sweep frequency ratio differing from the unity in the two planes,  , the RSMs produces a fine-meshed Lissajous-like, diagonal crosshatch beam centroid displacement pattern with a rectangular outline (see figure 44). Such an approach, combined with a
  beamlet, generates a time-averaged intensity distribution with a large uniform central region and less than 1% beam deposited outside the 160 × 60 mm2 nominal beam footprint.

Figure 44. Simulated raster pattern and consequent intensity distribution at the target following a full cycle of the Lissajous-pattern with the nominal beam parameters. Left: a Lissajous-pattern generated by triangle waveforms with a frequency ratio of 113/83. For comparison, the relative beamlet rms sizes at the target are illustrated by a red ellipse. Right: the intensity distribution is scaled to represent the peak current density, normalised to 2.5 mA average current. The blue rectangle illustrates the outline of the raster pattern. The dashed lines indicate the footprint containing 99.0% of the beam. Notice the 3:1 aspect ratio on the scales.
Download figure:
Standard image High-resolution imageSubstantial fundamental raster frequencies are required, tens of kHz with 40 kHz as the specified maximum, to minimise raster-correlated modulation of the moderated neutron pulse.
The same RSM and modulator design is applicable to both the horizontal and vertical set of RSMs, differing only by magnet orientation. The RSM are placed in pairs of identical field direction,  . With the required magnitudes of dB/dt, a ceramic vacuum chamber is required, and a RSM pair shares a single 850 mm ceramic vacuum tube with metallic flange connections. A cross section and isometric view of a horizontal RSM (with a vertical field component) can be seen in figure 45. The magnet is based on a window frame yoke that gives good field uniformity in a large region of the magnet aperture. The considerable operating frequency calls for a yoke material with low eddy current losses and a high frequency response. A NiZn ferrite yoke, possibly CMD5005 from Ceramic Magnetics, is an obvious choice. Due to the skin depth in Cu, the coils are cut from thin, 1 mm, OFHC Cu plates and bent into 2-turn bedstead coils.

Figure 45. Sagittal cross section of a RSM with dimensions in mm (left panel) and isometric view of a complete RSM (right panel). Ferrite parts are shown in turquoise and are held in place by spring-loading them against a metallic housing.
Download figure:
Standard image High-resolution image5.3. BI and diagnostics
5.3.1. Beam position monitors
It is planned to install in total about 100 BPMs on the ESS linac. The BPM measure the beam position and phase, and provide input to the beam interlock system (BIS) to stop the beam in case of fault. The phase measurement is mainly intended for cavity tuning and ToF energy measurements.
The ESS BPM system uses BPM sensors of different sizes and types. Small-aperture stripline BPM are used in the low-energy linac including the MEBT and DTL sections. The BPM of the downstream sections are of electrostatic button type.
Most of the BPM belong to the LWUs installed in between each two successive cryomodules. The current plan is to have one BPM per LWU with staggered BPM location (i.e. BPM location being alternatively closer to the upstream and downstream ends in the successive LWU). This creates two baselines for TOF measurements, and the phase difference between the two BPM including the number of periods can then be calculated by comparing the readout phase from the short and long baselines.
In order to minimise potential disturbances from nearby RF sources, the BPM signal processing is done opposite to the RF. This means that the second harmonic (i.e. 704.42 MHz) of the BPM signal is processed in the spoke and upstream sections, and the fundamental harmonic (i.e. 352.21 MHz) in the sections downstream to the spokes. A direct consequence of this is that the BPM and the LLRF systems shall use phase references with opposite frequencies.
Most of the BPM need to have an overall accuracy of  μm and a resolution of 20 μm with the nominal beam current of 62.5 mA and pulse width of 2.86 ms. The BPM also need to successfully measure the beam position under off-optimal conditions such as with a de-bunched and low-current beam of 6.25 mA and pulse-width of 5 μm that is foreseen for linac commissioning. It is therefore important to ensure that even under such extreme conditions, the BPMs still provide a rough position so that the beam can be safely steered all the way to the target or the tuning dumps.
The BPM button voltage is expected to decrease to less than a half from the beginning to the end of the linac [61]. This is due to the beam velocity increase and the changes in the processing frequency and beam pipe size. Despite these variations, the same electronics is used for most of the BPM. Since the LLRF and BPM systems have similar requirements, considerable technical effort has been put in place to maximise synergies by using same or similar electronics and firmware for both systems.
The chosen platform for the BPM electronics is μTCA.4. Its design includes a rear transition module, where the BPM signals are level-adjusted, down-mixed to IF and filtered in the analogue domain, as well as an advanced mezzanine card for analogue-to-digital conversion and FPGA processing.
5.3.2. Beam current monitors (BCM)
The BCM system are used to measure the pulsed beam current as well as the per-pulse and cumulative beam charge. It consists of 15 AC-current-transformers (ACCTs) and one fast current transformer along the 600 m linac with a higher concentration of the sensors in the low-energy sections. This is mainly to address issues regarding fast detection of high beam losses and initiating a beam abort request especially in areas where the BLMs cannot be successfully used.
The MPS requirements include differential beam current measurement using several ACCT pairs. The readout current from the two ACCT are compared with each other and in case the difference exceeds a certain threshold, a beam abort request is sent to the BIS. The pulse width, amplitude and frequency are also measured by the ACCT in absolute mode and a beam abort signal is sent to the BIS in case a mismatch is detected between the real beam and the selected beam mode.
It is planned to use commercial off-the-shelf ACCT sensors. The associated electronics is installed in the klystron gallery and consists on a stand-alone analogue front-end box and customised readout electronics based μTCA.4 technology.
5.3.3. Beam loss monitoring (BLM)
The primary goal of the BLM system is to detect abnormal beam behaviour and trigger a beam abort in case of beam failures in order to keep the machine safe from beam-induced damage. In addition to its protection functionality, the system is expected to provide the means to monitor the beam losses during normal operation with the aim to avoid excessive machine activation.
The protection functionality gives a constraint on the system response time and sets the upper limit of its dynamic range. Similarly the lower limit of the dynamic range is set by the monitoring functionality.
Regarding the response time, the BLM system is required to react within ∼10μ in the superconducting and within ∼1 μs in the normal conducting parts of the ESS linac. These numbers were set based on a simplified calculation of the time needed to melt a block of material under a perpendicular incidence for the beam parameters expected in the time. The numbers have recently been recheck with updated values for beam current and beam size, while assuming a Gaussian beam instead of a uniform circular one. The results raise a concern for the 1 μs limit expected for the NC linac (see figure 46). However, these calculations give a conservative result on the melting time as no cooling process was included. On the other hand, the results agree well with the 10 μs limit for the SC parts of the linac. Though experience at SNS raises a question for this limit, since there a degradation of the superconducting cavities is observed already after losing  pulse of a 26 mA beam about 10 times per day [62].

Figure 46. Time needed to melt a block of copper (blue) or stainless steel (red) under perpendicular (light colours) and shallow (dark colours) incidence of the proton beam along the MEBT and DTL parts the ESS linac.
Download figure:
Standard image High-resolution imageIn the normal-conducting parts of the ESS linac, between one and two BLM devices per metre are foreseen. On the other hand, three to four devices per double lattice cell are planned in the superconducting parts, four where there is a cryomodule (three surrounding the quadrupole doublet and one more per cryomodule) and three in the transport section. The number of devices in each of the linac sections is listed in table 32.
Table 32. Number of beam loss monitoring devices (ionisation chambers and neutron detectors) in each linac section.
| Linac section | Ionisation chamber | Neutron detector | ||
|---|---|---|---|---|
| Density | Count | Density | Count | |
| RFQ | 1–2 per m | 6 | ||
| MEBT | 1–2 per m | 4 | ||
| DTL | 1 per tank | 5 | 1–2 per m | 17 |
| Total | 5 | 27 | ||
| Spokes | 4 per cryomodule | 52 | ||
| Medium β | 4 per cryomodule | 36 | ||
| High β | 4 per cryomodule | 84 | ||
| HEBT | 3 per quad doublet | 45 | ||
| Dogleg | 3 per quad doublet | 21 | ||
| 1 per dipole | 2 | |||
| A2T | 15 | |||
| Dump line | 6 | |||
| Total | 261 | |||
| Grand total | 266 | 27 | ||
Parallel plate gas ionisation chambers (IC) filled with N2, which were developed for the LHC BLM system, are selected for the SC parts of the linac as a BLM detectors, mainly due to their their fast response performance.
What must be taken into account when using ICs is the photon background due to the RF cavities. This is mainly due to field emission by the electrons from the cavity walls, resulting in bremsstrahlung photons created on the cavities or the beam pipe materials [63]. Estimations of the energy spectra show that photons with energies up to few tens of MeV can be expected [64]. The LHC ICs have a cut-off for transverse incidence for photons below ∼ 2 MeV [65], thus in order to know the importance of this background, its level needs to be determined. However these levels are difficult to predict numerically as they depend on the quality of the cavities, beam loading, operation conditions and time.
In order to address this issue during the operation, baseline correction of the recorded signal is anticipated. Ideally the data for the baseline calculation is foreseen to be sampled in the time window after the RF power is turned on and before the beam pulse arrives in order to correct the BLM raw data in the pulse accordingly.
The expected particle fields outside the tanks in the normal-conducting parts of the linac are dominated by neutrons and photons. Therefore IC are not a good option for a BLM device in these parts of the linac. Instead micromegas detectors are currently being considered as BLM detector choice in the low energy parts of the linac Micromegas detector sensitive to fast neutrons and blind to photons based on signal discrimination may be used.
Current concept for the electronics of the IC based part of the BLM system located in the superconducting parts of the linac consists of two separate units (see figure 47). The BLEDP card [66], which was developed for the new BLM system at the CERN injector complex, is used as acquisition unit, serving as an analogue front end and a digitiser. This card has a wide dynamic range (10 pA—200 mA) and is likely to fit the ESS requirements for the dynamic range also after the revision.

Figure 47. Schematic of the ionisation chamber part of the beam loss monitoring system.
Download figure:
Standard image High-resolution imageThe acquisition unit can provide information on the integrated loss over a fixed time of 2 μs, so called running sum 0 (RS0). Processing unit is in turn planned to provide additional RS giving information on losses integrated over longer time scales. The unit acquires the baseline data and subtract them from the raw data. Depending on the beam mode, each RS for each channel can be masked if needed.
5.3.4. Longitudinal bunch profile monitoring (LBM)
It is essential to have the linac equipped with a certain set of BI during its commissioning phase and start-up in order to tune it for optimal beam transmission and minimal beam losses during the operation periods. An example of such an instrument is a LBM, which provides information about an average time structure of the bunches. The ESS accelerator hosts four LBM devices. Their positions along the linac are indicated on figure 48. The one-sided rms longitudinal bunch size is expected to shrink from ∼150 to 3 ps during the acceleration process. The intrinsic limit for the LBM methods that are based on detection of the bunch electric field at the beam pipe boundary can be estimated [67] as

where  represents the rms value of the longitudinal charge distribution on the inner wall of the beam pipe with radius Rbp, which is produced by a charged particle moving with speed v. Due to the rather low Lorentz factors γ of the ESS beam the one-sided rms bunch lengths will be far below this limit (see figure 49). Therefore the available options to measure the bunch profiles are rather limited.

Figure 48. Longitudinal bunch profile monitor locations.
Download figure:
Standard image High-resolution image
Figure 49. Expected one-sided rms bunch lengths at the ESS linac (blue) and intrinsic limit on the one-side rms length due to the spatial spread of charge field (green).
Download figure:
Standard image High-resolution imageThe most common device used for measuring the longitudinal bunch profile in proton machines like ESS is the bunch shape monitor (BSM) proposed by A. Feschenko [68]. Feschenko's BSM is based on collecting the low energy secondary electrons (SE) emitted from a thin wire target placed in the beam. The time structure of the primary bunch is transformed into spatial distribution of SE through a RF modulation generated by a RF deflector. High negative voltage potential is applied to the wire to accelerate the SE towards the RF deflector with a set of slits and an electron detector at the exit.
A typical phase resolution of this device is ∼1o [69], which is accurate enough only for one of the four planned LBM devices at the ESS linac3 , namely LBM1 located in the MEBT section. However it has been recently proposed by A. Feschenko that a resolution of 0.5o or less could be achieved with a modernised version of the RF deflector, which should provide more symmetric electro-magnetic fields with less fringing fields at the edges [69]. As this is accurate enough for both LBM1 and LBM2 device, it has been decided to use Feschenko's BSM with proposed modernised RF deflector for both. Depending on how well the modernised BSM resolution can be improved the LBM3 could potentially also be a BSM device. However the expected bunch lengths at the LBM4 location are shorter than 3 ps, thus to short to be resolved even with the modernised BSM. Since a standard solution with sub-picosecond resolution does not exist for proton machines like ESS, LBM4, and potentially LBM3 as well, require development of a new device type. Additional argument for new development in the case of LBM3 follows from the study of the space charge effect on the performance of a BSM, which is described in [70].
For the case of LBM3 and LBM4, an alternative based on Cherenkov or transition radiation together with a streak camera is considered. The primary motivation for focusing on photons as the secondary particles is to avoid the space charge effects. Additionally both Cherenkov and transition radiation interactions are considered to occur fast in contrast to SE emission, where it was experimentally shown, that the emission time delay does not exceed (4 ± 2) ps [71]. Due to the rather low beam energy at the LBM3 location, there is a concern regarding a sufficient photon yield from transition or Cherenkov radiation. Therefore it is foreseen to use the new method proposed in [72] for this location, either as a supplementary option or as a back-up solution.
5.3.5. Wire scanner, emittance measurement (EMU), and FCs
Wire scanners have been deployed successfully for decades in accelerators. This represents a conservative choice for beam profile measurement. Their principle is rather simple and consists of moving a wire across the beam while monitoring a signal proportional to the number of particles interacting with the beam.
Eleven wire scanners are installed in the linac at different locations. The wire cannot withstand the beam power during the production mode (2.86 ms, 62.5 mA, 14 Hz), thus, the beam power shall be reduced in order to preserve the wire integrity. Two beam modes are dedicated to commissioning and specific beam studies when the insertions of interceptive devices are allowed:
- Slow tuning mode (i.e. 100 , up to 62.5 mA, 1 Hz).
- Fast tuning mode (i.e. 10 , up to 62.5 mA, 14 Hz).


At low energy (i.e. below 200 MeV), the primary source of the signal is SEM current from the wire, while at higher energy the primary source is the light generated in a scintillator by high energy secondaries. All the wire scanners in the linac shall be able to reconstruct the beam profile in SEM mode.
The numbers of WS station per section, the numbers of actuator and acquisition channel are summarised in table 33.
Table 33. Location of the WS in the ESS linac, axis and channel number per Wire scanner station are also mentioned.
| Location | Number of station | Actuator | SEM signals | Scintillator signals n |
|---|---|---|---|---|
| per station | per station | per station | ||
| MEBT | 3 | 1 | 2 | — |
| Spoke | 3 | 2 | 2 | — |
| Elliptical | 4 | 2 | 2 | 4 |
| A2T | 1 | 2 | 2 | 4 |
| Total | 11 | 19 | 22 | 20 |
Two types of wires have been considered a  carbon wire for the warm linac and a
  tungsten wire for the cold linac
Due to the low beam energy, the MEBT represents the worst case for the wire scanner, in addition beam density is relatively high. The maximum temperature reached by each wire scanner during a scan at 1 Hz are summarised in table 34 as well as the expected beam sizes at the wire location.
Table 34. Maximum temperature with a scan at 1 Hz.
| Beam sizes (mm) | Tmax (K) | Tmax (K) | |
|---|---|---|---|

|

|
50 
|
100 
|
| 1.85 | 1.45 | 1900 | — |
| 3 | 1.5 | 1430 | 2110 |
| 2.5 | 2.4 | 1240 | 1780 |
| 3.2 | 3.2 | 975 | 1350 |
As shown in table 34, the temperature increase for the first wire scanner is above the mechanical limit of the wire even with a reduced beam power, the wire survives only if the pulse length is reduced to 50  . In this case, the maximum temperature is around 1900 K, below threshold of thermoionic emission and the limit of a carbon wire, in fast mode, the temperature is below 1400 K.
In the spoke section, a wire scanner is installed after the first four cryomodules, the beam sizes at the wire scanner location and the maximum temperature reached during the scan are summarised in table 35.
Table 35. Beam parameters at the spoke wire scanner location.
| Beam sizes [mm] | Tmax [K] | Tmax [K] | |
|---|---|---|---|

|

|
slow mode | fast mode |
| 2.5 | 1.9 | 1790 | 1325 |
| 2.9 | 1.6 | 1730 | 1260 |
| 2.6 | 2.1 | 1610 | 1240 |
| 2.8 | 2.2 | 1500 | 1170 |
In the elliptical section, the average beam sizes ( mm) have been considered for a beam energy of 200, 500, 1000 and 2000 MeV, the maximum temperature on the wire are shown in table 36.
Table 36. Maximum temperature on a tungsten wire in the elliptical section.
![${T}_{\max }[K]$](https://content.cld.iop.org/journals/1402-4896/93/1/014001/revision2/psaa9bffieqn159.gif)
|
||
|---|---|---|
| Energy [MeV] | slow mode | fast mode |
| 200 | 1590 | 1215 |
| 500 | 1340 | 978 |
| 1000 | 1250 | 890 |
| 2000 | 1210 | 860 |
In the spoke section, the temperature might be too high during the slow tuning mode and a smaller wire diameter (20 μm) is used. In this case the temperature drops by almost 200 K after spoke 1 during the slow tuning mode and 100 K during the fast tuning mode after spoke 4.
In the elliptical section, The temperature is below 1600 K for all the cases and should not be an issue for the wire integrity. More details can be found in [64, 73].
In the MEBT, at full current (62.5 mA), the maximum peak signal expected is around 400  for the more focused beam and 180
  for the less focused one.
In the spoke section, the maximum expected signal will be 120  after the first spoke cryomodule and 60
  after the fourth cryomodule.
The wire scanner shall be also able to measure the beam profile with the lowest current foreseen in the linac (i.e. 6.5 mA). The level of the signal increases linearly with the beam current at constant beam sizes, in first approximation, it can be assumed that the signal is divided by a factor 10 compared to the previous estimation for the lowest current. This means that the peak signal will be around 40  in the MEBT and will drop to 6
  in the spoke section.
In the cold linac, the BI is positioned in the warm sections, between the quadrupoles doublet. Due to the low energy of the beam, the shower created in the wire is stopped at the quadrupole, in order to keep a sufficient signal, both wire scanner actuator and scintillator shall be positioned between the magnetic elements, in consequence the full system has to fit in less than 45 cm.
The signal produced by the detector shall be independent on the beam position, the geometry of the detector is done in order to minimise this effect. The detector consists in 4 scintillators positioned around the beam pipe, the size of each active element is  , arrange in order to have a square with a dimension equal to
  , each scintillator is surrounded by a 1 mm thick aluminium foil.
The homogeneity of the detector has been checked at different beam energies by moving a 1D gaussian beam ( ) across the beam pipe aperture. For each energy, 49 points have been simulated to cover an square aperture from −30 to 30 mm in steps of 10 mm in both transverse directions. The signal on each scintillator shows a strong dependency on the wire position. In the worst case, a variation about a factor 2 can be measured along the full beam pipe aperture. By summing the signal from the four scintillators, the variation on the deposited energy can be lowered to just some units per cent.
At low energy, the detector is less homogenous. For the 220 MeV case, the error compared to the reference is less than 10% if the beam is kept in a square of  and less than 5% for a square of 10 × 10 mm (see figure 50). At 2 GeV, the error compared to reference is less than 5% over the range considered in the simulations. From these results, and assuming a beam size less than 3 mm (i.e. 1 rms) along the cold linac, it can be concluded that the homogeneity of the detector is sufficient for transverse profile measurement.

Figure 50. Error map for a 220 MeV beam.
Download figure:
Standard image High-resolution imageA plastic scintillator might not be suitable for the ESS linac in terms of radiation hardness and light production. Other type of scintillators have been studied. The evolution of the signal as function of the beam energy has been estimated for three commons scintillators type [74]:
- BC 412 plastic scintillator
- NaI crystal
- BGO (bismuth germinate)
Beam energies from 200 to 2100 MeV have been considered with steps of 100 MeV, assuming the beam in the centre of the beam pipe, and with the same geometry as the one above.
The number of photons produced per primary crossing the wire in each scintillator has been calculated from the average energy deposition in the four scintillators and the photon yield. These values have been used to estimate the light power generated in each scintillator for typical beam sizes in the superconducting linac and for the nominal beam current. For these estimations, the scintillation photons have been considered as mono energetic, with an energy equal to the luminescence peak. The minimum power is then about 3.5 mW at 300 MeV for a plastic scintillator and up to almost 50 mW at 2 GeV for a NaI crystal.
At these levels of power, a photodiode can be used a light detector. Assuming a light collection and transmission from the scintillator to a photodiode of 20% and a typical spectra response of 0.2 A W−1 for the NaI and plastic scintillator and 0.3 A W−1 for the BGO scintillator, the signal level at the output of the photodiode is in the mA range for the inorganic scintillators [75].
5.3.6. Emittance measurement
The accelerator has two EMUs: one in the LEBT and the second one in the MEBT.
The LEBT EMU is used intensively during the commissioning phase to characterise the ion source, the beam transport in the LEBT and measure the Twiss parameters at the RFQ matching plane, the results of this measurement campaign is also used to provide input for the end to end beam dynamics simulations of the ESS linac In order to fulfil these requirements, the EMU shall be able to reconstruct the transverse emittance with an error lower than 10%.
The specifications of the EMU are:
- The maximum peak power absorbed by the thermal screen shall be 7.5 kW4 .
- The EMU shall be used at 8% of duty cycle (i.e. 6 ms, 14 Hz).
- The minimum beam sizes at the Allison scanner position shall be .
- The maximum beam sizes at the Allison scanner position shall be .
- The resolution in position shall be better than 500 μm.
- The EMU shall be able to measure a maximum beam divergence of .
- The angular resolution shall be better than 0.5 mrad.
- The user of the EMU shall be able to choose the signal sampling in a range between 100 kHz and up to 2 MHz.
- The head of the Allison scanner shall fit in a DN250 CF flange or less.
- The length of the movement shall be design in order to scan a beam pipe aperture of 160 mm.

In order to withstand the beam power, a full finite element analysis has been performed [76] showing that only few materials are able to meet the specification on beam power density. The final design of the EMU is shown in figure 51, its consist of a beam stopper in copper plated with tungsten and entrance slit in TZM to withstand the beam power.

Figure 51. View of the cross-section of the CAD Model of the EMU. Source: CEA Saclay, 2015.
Download figure:
Standard image High-resolution imageMEBT EMU. One of the functions of the MEBT is to fully characterise the beam at the exit of the RFQ [60]. For this, a slit and grid system are installed in the reserved drift space for beam diagnostic downstream the chopper.
The space available for the beam diagnostics after the second triplet is less than 350 mm (flange to flange) and might not be sufficient to meet the performance requirement for EM with the slit and grid system. The distance between the slit and grid has to be increased to provide enough angular resolution, therefore the slit has to be positioned between two quadrupoles, in this case the distance between the slit and the grid is increased to 400 mm.
The mechanical design of the slit is constraint by the space available between the two quadrupoles and the function to absorb the beam power. The slit is not able to absorb the nominal beam power, during emittance scan the pulse length as well as the repetition rate has to be reduced to 50  and 1 Hz respectively. From the studies done for the LINAC4 emittance metre [77], graphite is the best candidate for the slit material. The slit has to be tilted with respect to the beam axis in order to spread the energy deposition on a larger surface, the angle can not be less than 45° due to space limitation.
Error on emittance reconstruction. The slit and grid method for measuring the beam transverse phase space might induced some errors in the emittance reconstruction, the major errors contributions are:
- Error on the slit/grid position
- Multiple scattering on the slit edges
- Space charge effect in the drift between the slit and the grid
- Cross talk between the wires
An optimised design of the slit and grid system reduces the contribution of these errors to an acceptable level. The influence error on slit/grid position can be reduced by increasing the distance between the slit and the grid, the effect of multiple scattering can be reduced by increasing the slit thickness above the penetration depth of the proton beam and increasing the slit aperture while the influence of space charge can be reduced by decreasing this aperture, a more complete study of this various effect can be found in [78, 79].
In order to avoid cross talk between the SEM grid wires, a second plan of wire shall be positioned downstream the grid and be polarised to attract the SEs [77].
In order to preserve a good accuracy for the measurement the slit and grid system has to fulfil these specifications:
- For the slit:
- An aperture of 100 μm
- A thickness of 200 μm
- For the SEM grid:
- A minimum number of wire equal to 24.
- The grid pitch shall be better than 500 μm
- The grids shall be equipped with 20 μm tungsten wire
- The minimum distance between the slit and the grid shall be at least 350 mm
The overall accuracy on the emittance reconstruction depends on the knowledge of the relative longitudinal and transverse distances between the slits and the grids. A constant offset between their positions does not affect the emittance reconstruction accuracy, The slit and grid system are designed in order to insure mechanical stability of their position with respect to each other. In addition, the actuator system of is able to measure the position of each unit with an accuracy better than ±50 μm.
5.3.7. Faraday cup
In total, four FCs are installed in the ESS linac: one in the LEBT, one in the MEBT an two in the DTL.
LEBT: FC The LEBT FC is the primary diagnostic used for the ion source and LEBT commissioning [80]. This FC is designed in order to withstand the full beam power at the exit of the ion source, the relevant beam parameters are:
- Beam current equal to 100 mA.
- Beam pulse length equal to 6 ms.
- Repetition rate equal to 14 Hz.
For a duty cycle above 8% and an average power above 600 W, a cooling circuit is necessary. A representation of this FC is shown in figure 52.

Figure 52. LEBT FC (courtesy of PANTECHNIK).
Download figure:
Standard image High-resolution imageThe accuracy of the current measurement shall be better than 0.5%, a biased electrode is needed to achieve this specification.
In the MEBT, a FC is installed in order to avoid beam losses in the downstream section during the tuning of the first part of the MEBT, specially for emittance scan with a slit and grid system. The FC is located as close a possible to the end of the vacuum chamber foreseen for the installation of the various beam diagnostics in order to optimise the distance between the slit and the grid.
The cup is designed to absorb a beam with an energy equal to 3.62 MeV, with a peak power equal to 230 kW, at a maximum pulse length of 50  with a repetition rate equal to 1 Hz. In addition, the FC is able to withstand the same peak power, at a beam pulse length of 10
  and a repetition rate of 14 Hz. At the MEBT FC location, assuming a beam with Gaussian distribution, the beam sizes are 2.5 mm (1 rms) in both transverse planes.
The MEBT FC is able to measure the full beam current without limitation on the beam position, the aperture of the FC shall be at least equal to 50 mm. To preserve space, the length of the FC is less than 50 mm, including the repeller electrode.The MEBT FC is able to measure the beam current with accuracy better than 1% and a resolution better than 0.1%, for all beam intensity foreseen in the ESS linac (6.3–62.5 mA). The signal is sampled at a frequency of at least 2 MHz.
In the DTL, two FC are installed in order to avoid beam losses in the downstream part of the ESS warm linac during tune up of the first DTL. The FC is installed in the inter-tank area, the FC positioned after the second DTL tank is named here FC2, the one after the fourth DTL tank is named FC4.
The FC2 and FC4 are designed to absorb a beam energy range from 20 MeV to 39 MeV and 39 MeV to 74 MeV respectively. From these values, the maximum peak power absorbed by each FC is calculated. Assuming a beam current equal to 62.5 mA, the peak power absorbed by the FC2 and FC4 is 2.43 MW and 4.62 MW respectively.
The FC is primary used during the RF tuning of the upstream tank(s) with a reduced beam duty cycle. For this particular studies it is foreseen to use a 5  pulse length at a repetition rate of 14 Hz. In this case, the maximum average beam power absorbed by the FC is 170 Watt for the FC2 and 324 Watt for the FC4.
In addition, the two FCs shall be able to absorb a 100  pulse length at a repetition rate of 1 Hz, at this duty cycle, the maximum average beam power shall be 243 Watt for the FC2 and 462 Watt for the FC4.Thermo mechanical analysis are mandatory to estimate the maximum power which can be absorbed by the FC and define the beam modes/duty cycle which allow a safe operation of the FCs. At the their locations, assuming Gaussian distribution of the beam, the beam sizes are 1.3 mm by 2 mm (1 rms) at the FC2 location and 1.6 mm by 1.9 mm (1 rms) at the FC4 location.
5.3.8. Non-invasive profile monitors
NPMs measure the profile of long high power pulses by imaging the interaction between the proton beam and the residual vacuum in the beam chamber. They complement lower intensity wire scanners by measuring transverse beam profiles of macropulses with more than 1012 protons, without any upper limit. They also provide longitudinal profile information, making them important diagnostics for high-power commissioning and during routine operation. There are two NPM designs: the beam induced fluorescence (BIF) design, and the ionisation profile monitor (IPM) design.
The simpler BIF design is the first NPM installed, imaging the fluorescence of the residual gas interacting with the proton beam. It consists basically of an imaging system: a source, an optical system, and an image readout system. The BIF system is simple, with the ability to deliver 2D transverse profiles, initially providing two orthogonal projected 1D profiles of the beam. The source exists whenever protons are present, hence it is passive and robust. However, the residual gas pressure in the cold section of the linac is low, in the 10−9 mbar range. Consequently the source may not be bright enough to be displayed within the required performance. Also, there are technical challenges, in particular due to the hard-to-predict radiation environment in which the optical system will work.
The IPM design does not suffer from these challenges, but it is more complex. It relies on a high voltage applied across the ionised residual gas to project ions onto a screen. The detector observes the projected particles (ions and electrons) in the vacuum chamber. Again, the radiation environment is a critical issue for both operation and reliability. Maintenance is not trivial, in the high vacuum in the proximity of the cold accelerating cavities.
5.3.9. Doppler-shift spectroscopy
Doppler shift measurement diagnostics provide an accurate measure of the intensities of the different ion species produced by the source. It is based on the interaction of accelerated particles from the source (mainly H+,  , and
, and  ions) with the vacuum chamber residual gas, producing a proportional fraction of neutral excited atoms that emit de-excitation radiation at specific wavelengths. Doppler shifted spectra produced by H, H2 and H3 are observed at a given angle to the moving beam, allowing the fraction of H+,
  , and
, and  to be measured. Doppler measurements are available from the first operation of the ion source, installed in the LEBT, and able to characterise the PS during commissioning.
5.3.10. Target and tuning dump
The target proton BI systems monitors the beam on the target and on the tuning dump. This instrumentation supports commissioning, startup, and operations by providing measurement data through the EPICS control system. In addition, the systems detects errant beam conditions that could be damaging to the dump or target components and informs operators via the alarm system. If the errant conditions meet a predefined severity threshold, the instrumentation mitigates it by suppressing beam production via a direct and low-latency interface to the BIS. As part of the MPS, this interlock can suppress beam production within 10 μs of receiving a signal from an instrumentation system. Most of the systems described below measure beam parameters and detect errant conditions within the pulse period of 1/14 Hz. With this latency, each pulse is measured and qualified before the upcoming pulse is allowed. Some systems should make measurements many times during a pulse and could therefore detect and mitigate errant conditions within a single pulse.
To fulfil its primary mission of protecting target and tuning dump components, this instrumentation suite measures the proton beam current density in the two transverse dimensions, and the beam current outside of a desired footprint. The harsh environment and the requirements for MP about redundancy and diversity. In other words, each of these primary beam parameters has to be measured by at least two different systems. Each instrumentation system provides additional measurements for diagnostic purposes.
Components located within the target monolith and, to lesser extent, components located in the tuning dump are subjected to extreme radiation. For this reason, all of these beamline devices incorporate remote handling features. In addition, cost and radioactive waste associated with maintenance and replacement activities are minimised.
Imaging systems: Three imaging systems are present in the ESS accelerator: one for the target wheel, one for the PBW and one for the tuning dump. These measure the two-dimensional distribution of the beam current at or near the target and dump components. The density distribution is measured for each pulse and based on the result, the next pulse is enabled or disabled by the MPS. For the imaging systems, the most important parameter to measure is the maximum current density within the beam footprint. This should be measured with a precision of about 10% of the nominal peak density and with a spatial resolution of about 1 mm. If required, a measurement from an upstream beam current monitor can be used to normalise the results from the imaging system. To support imaging and calibration without beam, an illumination system should cover the entire field of view. Near the edges of the field of view, fiducials allow alignment, determination of scale factors and, optionally, correction of distortion. The imaging system that views the target wheel is also capable of measuring the relative position of the wheel and the moderator assembly. To support background suppression and diagnostic studies, the imaging systems provide adjustable spectral selectivity over the visible and near IR range.
For diagnostic purposes, it is desirable to measure the beam density distribution as a function of time during the pulse. This can be the result of data collected over many pulses in order to achieve an adequate signal-to-noise ratio. If errant conditions can be detected within a single pulse, the imaging systems and the MP interface is designed to interrupt beam production during the pulse. To verify configuration of the beam delivery system, a short pulse of about 10 μs is transported and measured.
The beamline device includes the source of the light to be imaged, plus a complete optical system to bring the image out of the shielding to a location suitable for electronics. Optical components that support illumination are also included.
The current concept for the source of light is based on the previous experience from the SNS at ORNL. Cooled surfaces in the proton beam path receive a coating of chromium doped alumina. This coating is applied in a thermal spray operation. For ESS, the coated surfaces are: the beam window directly upstream of the tuning dump, the PBW within the target monolith, and the rim of the target wheel. Coatings must remain functional for the lifetime of the component onto which they are applied. In the case of the beam dump window, the goal is life of the facility, as this component receives very little fluence. During full power operations, the PBW must last about one year, and the target wheel must last about five years.
The optical system must provide a field of view determined by the full size of the beam aperture, including fiducial elements, and transport the image through the shielding to the electronics. For the PBW and the target wheel, this is of the order of 260 × 110 mm2. For the tuning dump, the field of view is about 100 × 100 mm2. The object resolution must be of the order of 1 mm. The thermo-mechanical design of the optical components near the beam aperture accommodates the energy deposition from the proton beam and from secondary particles.
All three systems incorporate an alignment and illumination system for in situ testing and calibration covering the entire field of view.
The grid system consists on one beamline device located in the target monolith along with the supporting electronics. The device measures the horizontal and vertical projections of the beam current density such that changes of 20% with respect to nominal peak density can be accurately determined. The goal is to make this determination in less than 100 μs. The system interfaces with the BIS so that the beam can be interrupted within the pulse if the current density exceeds a programmable threshold. The measurements are made over beam widths that range from about 160 mm horizontally and 60 mm vertically down to several millimetres in each dimension.
The scope of the beamline device includes a multiwire grid assembly consisting of two planes of wires (horizontal and vertical), and additional planes as needed to provide electric fields. This replaceable assembly is integrated into a shield plug that provides cooling and positioning and is part of the target work package. All radiation tolerant cabling and feedthroughs between the multiwire grid assembly and a location just outside of the monolith is also included.
The aperture monitoring system consists on three devices for the target (one integrated into PBW assembly, one in proton BI plug, and one in the neutron shield wall far upstream of the monolith), and one for tuning dump (integrated into the beam window just upstream of the dump surface). Requirements for the beam on the target and dump specify the amount of beam current that can reside outside of a nominal footprint. For example, in the case of beam within the target monolith, this current is about 0.1% of the total. If the current near the aperture and outside of the nominal footprint exceeds a predetermined value, then the aperture monitoring system suppresses the beam production via its interface to the interlock system. The aperture monitors must provide a measurement precision that supports this function.
Fixed sensors surround the apertures of the PBW, the proton BI plug, and the tuning dump aperture. At each of these locations, the fixed assemblies provide many measurement points and will be integrated into bulk steel assemblies provided by the target work package. In addition, moveable sensors reside close to the upstream aperture of the neutron shield wall. Sensors on the moveable unit are set far outside of the beam core, but close enough to detect the result of deviations from nominal DC optics. Each beam line device also includes radiation hard cable assemblies and feedthroughs that carry signals several metres through the bulk shielding.
Two types of sensor are used in each location. One type is a low mass thermocouple that can detect errant conditions after many pulses. To achieve faster response, a complementary technique that measures current induced in metal blade (primarily by the charged particle shower) will also be employed. These metal blades are arranged in a segmented array surrounding the aperture and located about 1 cm upstream of the thermocouples.
5.3.11. Insertable beam stops
Three insertable beam stops enable commissioning, tuning and startup of the linac while minimising beam loss in the downstream sections. One is located in the first spoke section LWU and allows tuning through the DTL. The second is located in the middle of the spoke section and the third is located in the middle of the medium beta section. This latter stopper provides the final destination before beam is sent to the tuning dump or to the target. Because they function primarily as beam stops and not as measurement devices, the accuracy requirements of the upstream FCs do not apply to these beam stops. All should handle probe, slow tuning and fast tuning beam modes.
Each of them is positioned between two quadrupoles, leaving a length available for the dump and the longitudinal shielding of about 0.46 m. The main concern with these devices is their activation. Shielding keeps the received dose rate after a 4 h cooldown below 25 microSieverts h−1 at 30 cm from the shielding surface. Because they are located in close proximity to the superconducting cavities, these stops are designed for easy cleaning and incorporate formed bellows. An interface from the motion control and instrumentation systems to the BIS assures that damaging beam conditions are mitigated before harm comes to the beam stop or the cavities.
5.3.12. Gamma blockers
The activated target wheel backshines gamma radiation through the proton beam pipe, following beam exposure during periods of operation. The line of sight to the target wheel is blocked by a gamma blocker inserted in the beam pipe upstream of the target during maintenance periods, allowing personnel to perform their activities on components located in the A2T section of the linac. There is a similar situation with backshine from the tuning beam dump in the dump line section of the linac, although the irradiation times and beam powers (5 MW to the target wheel versus 12.5 kW to the tuning beam dump) are very different.
A gamma blocker reduces radiation levels to be compatible with hands-on maintenance conditions. Additionally, the radiation hazard is minimised by reducing the strength of the source (given by the irradiation and cooling times of the target wheel and tuning beam dump), by reducing exposure times to personnel (determined by maintenance procedures), and by increasing the separation between source and components (set by the lattice design).
The gamma blocker design is inspired by the SNS gamma blocker. A cylindrical core of high-Z material that resides in vacuum to one side of the beam line is horizontally movable and able to block the whole aperture of the beampipe. The gamma blocker servicing the accelerator to the target section is located just upstream of the neutron shield wall, while the one servicing the tuning dump line is just upstream of the external wall of the dump vault.
6. Safety
The ESS is committed to safety at all stages of the project. The Organisation strives to, as low as reasonably practicable, prevent exposure to hazards and to provide guidance for a safe workplace. A special attention is given to radiological hazards during operation and access modes as well as to oxygen deficiency hazard (ODH) during the access mode to the tunnel. Safety analysis principles and results are given for accelerator shielding configuration and for expected prompt and residual radiation dose rates. This chapter also presents the preliminary results of the computational fluid dynamics (CFD) simulations and anticipated oxygen levels at different locations and for various accidental scenarios.
Additionally, in order to achieve the desired machine performance a number of studies like failure mode an effect analyses (FMEA), fault tree analyses (FTA), reliability, availability, maintainability and inspectability (RAMI) analysis are performed for individual systems as well as for the whole accelerator facility. Some results and conclusions are presented here.
6.1. Radiological hazards
The sources of ionising radiation associated with accelerator operation are:
- Prompt radiation from normal operational beam losses
- Prompt radiation from accidental beam losses
- Prompt radiation (x-rays) due to RF fields
- Residual radiation from activated systems and components
- Activated tunnel air
Prompt radiation levels can be very high [81] and require mitigation. Passive shielding is designed to maintain levels of radiation in the nearby buildings and the environment within regulatory limits during normal operations [81]. The full results of the shielding analysis are presented in [81] and mentioned later in this chapter.
Residual radiation is limited by operational beam losses. Operational beam losses are limited to 1 W m−1 [82] to allow hands-on maintenance of accelerator components using only administrative measures. However, local hot spots might be observed which may require additional local shielding. Beam losses are measured by the BLM system.
The activated air in the tunnel is managed by the ventilation system, which is design taking into account the radionuclide production rates in AT air [83].
6.1.1. Prompt radiation and shielding design
Along the accelerator beam, halo particles can fall outside the beam envelope and interact with accelerator structures and components. These primary protons generate secondary particle showers via nuclear interactions and produce prompt ionising radiation. The maximum average normal operational beam loss of 1 W m−1 has been adopted at ESS [82] to allow hands-on maintenance of accelerator structures [84]. This loss of 1 W m−1, together with the beam spill limits defined in [84] is used as requirement for establishing the design of the prompt radiation shielding. Note that performed error study analysis show that the expected beam loss levels at the ESS accelerator are much lower than 1 W m−1 [85]. Additionally, operating experience at other facilities in Europe and the US demonstrates that losses below 1 W m−1 are routinely achieved. Thus a limit of 1 W m−1 is conservatively established.
A dedicated model of the ESS AT and surrounding structures has been built in the MARS15 code [81]. A detailed geometry model of the DTL and superconducting linac has been created. As-built AT construction drawings and existing 3D models for planned surrounding structures are also used to create the corresponding geometry in MARS15. With a simulated average 1 W m−1 beam loss along the entire linac, the expected maximum total prompt dose rate in the vicinity of accelerator components, as shown in figure 53, it is estimated to be around 10 Sv h−1 [81].

Figure 53. Side view of the total prompt dose rate across the drift tube linac (top) and across the entire linac (bottom) for a beam loss rate of 1 W m−1, without a safety factor.
Download figure:
Standard image High-resolution imageThe ESS accelerator shielding is designed to guarantee an external prompt dose rate of less than 3 μSv h−1, corresponding to the limit for a supervised radiation area [86] in all adjacent accessible areas. Bulk shielding has been derived and special care was taken to correctly model and calculate the radiation transport and resulting local doses associated with over forty penetrations that are required for personnel and equipment access to the tunnel [81]. The ESS procedure for designing shielding for safety [87] has been followed. Details of the study can be found in [81].
Figure 53 shows that the total prompt dose rate changes depending on beam energy along the linac. The ratio of the highest and lowest prompt dose in the immediate vicinity of the beamline (at the Linac end and beginning of DTL, respectively) is approximately 100.
Accidental worst full point beam loss has been simulated at 2 GeV and the prompt dose rates calculated outside of the accelerator shielding, with a maximum estimated dose rate of 400 mSv h−1 (including a safety factor of 2) on top of the accelerator shielding [81] and a maximum value of 120 mSv h−1 in the klystron gallery [81]. Figure 54 shows a prompt dose rate map for accidental beam loss with a shallow angle directed vertically up.

Figure 54. Elevation view of prompt dose rate isocontours in the ESS linac tunnel and surrounding soil for a point full beam loss with shallow angle, vertically up, at 2 GeV. Including a safety factor. Values are given in mSv h−1 .
Download figure:
Standard image High-resolution image6.1.2. Residual radiation
Any lost proton beam leads to activation of accelerator components and structures through nuclear reactions. These activated structures and components generate ionising radiation, which is called residual radiation. The residual radiation is dominated by gamma particles and has been calculated using the same MARS15 model as for shielding calculations. The ESS procedure for activation calculation [88] has been followed and the on contact residual dose rates calculated for the quadrupole and bending magnets and concrete tunnel walls [81]. Obtained on-contact peak residual dose rate can be up to 4 mSv h−1 , for 100 d of irradiation with a beam loss of 1 W m−1 , with 4 h of cooling time. Results are consistent with hands-on maintenance conditions and a design criteria of 1 mSv h−1 residual dose rate at 30 cm from a surface of any given accelerator components, after 100 d of irradiation and 4 h of cooling time [82].
6.1.3. Inventory of radioactive material
Activation of accelerator systems and components: The same MARS15 geometry model has been used for radioactive inventory calculations. The ESS procedure for activation calculation [88] has been followed. Isotope production rates have been calculated using the MARS-DeTra tool to determine nuclide inventories [89]. The quadrupole yoke and coil materials, beam pipe, accelerating niobium cavities, liquid helium, and cooling water have been also studied [90].
Activation of tunnel air: For 1 W m−1 beam loss model, the produced unstable isotopes and total production rates in the entire tunnel air have been calculated and tabulated [83]. No ventilation was assumed. These results are used as the source term to calculate on–and off-site doses from normal operations.
6.2. Cryogenic hazards
In the context of the ESS project, cryogenic cooling is essential for various equipment of the facility that will be provided with nitrogen, helium and hydrogen. The use of cryogenic fluids can be associated with two main hazards:
- Cold burns due to the effects of cold vapours and gases on the lungs in case of inhalation and on the skin in case of direct contact.
- ODH due to the displacement of oxygen in air lowering its volumetric concentration below the acceptable value of 18% [91].
The following accelerator areas and buildings are concerned by the cryogenic hazard:
- The helium compressor building housing the compressor system of the target moderator cryoplant (TMCP), the compressor system of the test and instruments cryoplant (TICP), the compressor system of the accelerator cryoplant (ACCP), the helium recovery system and the HP gas storage area.
- The coldbox building housing the 20 000 l LHe storage tank, the 5000 l LHe Storage Tank, the mobile dewar filling station as well as the TMCP, TICP and the ACCP coldboxes.
- The cryogenic transfer line gallery (CTLG).
- The gallery technical area housing the ESS cryomodule test stand (TS2) used for the site acceptance tests (SATs) of the elliptical cryomodules.
- The AT housing the superconducting linac (43 cryomodules) and the cryogenic distribution system (CDS).
6.2.1. Accelerator tunnel
The tunnel has an internal volume of  m3, housing 43 cryomodules connected to a distribution system consisting of a cryogenic line, valve boxes and jumper connections. The entire cryogenic system enters its steady-state phase of normal operation once all cryomodules are cooled down to 2 K. Access to the tunnel is allowed after cooldown, in order to perform maintenance activities such as leak test, visual inspection, and repairs.
Table 37 shows the estimated helium inventory that is stored in the cryogenic systems components.
Table 37. Estimated helium inventory in the linac cryogenic system.
| Component | Quantity | Maximum helium mass (kg) | |||
|---|---|---|---|---|---|
| Per item | In total | ||||
| At nominal | Transient | At nominal | At transient | ||
| operation | mode | operation | mode | ||
| Distribution system | 1 | 215 | 530 | 215 | 530 |
| Elliptical cryomodules | 30 | 34 | 29 | 1014 | 882 |
| Spoke cryomodules | 13 | 21 | 18 | 277 | 240 |
Table 38. Failure scenarios considered for the simulations in the accelerator-to-target area of interest.
| Scenario | Ventilation | Helium | Spill | Helium |
|---|---|---|---|---|
| system | flow rate | duration | mass | |
| (kg s−1) | (s) | (kg) | ||
| 1 | On | 14.2 | 2 | 28.4 |
| 2 | On | 15.0 | 4 | 60.0 |
| 3A | On | 2.4 | 12 | 28.4 |
| 3B | Off | 2.4 | 12 | 28.4 |
An accidental release of helium in the tunnel during the maintenance phase might lead to personnel exposure to oxygen deficiency and cold burns. For that reason, the need has been expressed to carry out a CFD in order to provide a complementary study to the preliminary ODH assessment carried out using the Fermilab and CERN approach and to estimate the temperature, the oxygen concentration as well as the pressure at different locations and at different times in case of a release of helium inside the tunnel in order to quantify cold burn hazard, oxygen deficiency and pressure rise The simulated failure scenarios are listed in table 38.
The first failure scenario chosen for the CFD is an air inlet into the beam pipe and affecting a high-beta elliptical cryomodule. If such event occurs, it will be characterised by a high helium discharge dynamic. This event will lead to condensation and solidification of the air on the inner surface of the cavities which is not protected by any insulation layer. Heat from the air will then be transferred to the helium bath leading to an overpressure in the 2 K LHe circuit and bursting of the disks causing helium vapour to be discharged in the tunnel, figure 55.

Figure 55. Location of the burst disks of a high-beta cryomodule.
Download figure:
Standard image High-resolution imageA scenario with the characteristics indicated in figure 57 has been considered for the cryodistribution simulations.
It shall be noted that the simultaneous release of helium from several cryomodules has been discarded due to the fact that the gate valves used to allow the vacuum isolation of the different sections and located in between the cryomodules, are closed during the maintenance periods of the accelerator. Thus preventing any propagation of a pressure increase in the beam vacuum to the adjacent cryomodules.
Figure 56 shows an estimation of the temperature and O2 concentration near the faulty cryomodule 10 s after a helium discharge. Near the area of interest, O2 concentration can drop down to 6% and the temperature can reach −135 °C.

Figure 56. Simulated temperature (top) and oxygen concentration (bottom) 11 s after a loss of beam vacuum event in a high-beta cryomodule.
Download figure:
Standard image High-resolution image
Figure 57. Helium release caused by a loss of beam vacuum of a high-beta elliptical cryomodule.
Download figure:
Standard image High-resolution imageAdditional scenarios have been investigated in order to assess the level of safety for operators potentially located in critical areas, such as the dead-end of the A2T area, including helium pressure levels that might compromise the mechanical integrity of the exit doors, as occurred during the LHC accident in 2008. Moreover, the ventilation system of the AT plays a significant role in the helium dissipation in case of an accidental release and thus the efficiency of such system is of importance and needs to be analysed via a CFD.
A summary of the different failure scenarios simulated via CFDs can be found in figure 58.

Figure 58. Failure scenarios considered for the CFD simulations.
Download figure:
Standard image High-resolution image6.2.2. General control measures
In order to prevent and minimise the exposure of the personnel to helium discharge in the tunnel, several control measures are implemented during the design and operation phases.
The implementation of a helium collection header allows venting the helium outside of the tunnel in case of a significant overpressure of the 2K helium vessel of one of the cryomodules (figure 59).

Figure 59. Conceptual design of the helium collection header.
Download figure:
Standard image High-resolution imageIn addition, the AT is equipped with an air management system based on the ISO 17873 standard. This system facilitates the dissipation of the vented helium in case of a discharge/leak in the tunnel.
During maintenance phases, all control measures are implemented as defined in the ESS ODH Safety Process and Implementation:
- Fixed and personal oxygen monitoring systems with a set alarm at 19.5% O2
- ODH training.
- Operation, emergency and access procedures.
- Warning signs.
6.3. Fire hazard
Combustible materials are present in the AT and the klystron gallery, including electrical cables, oil from the klystrons and the modulators, electrical racks and components, and the beam dump. Ignition could be due to cable overheating, electrical short circuits, electrical arcs in modulators, et cetera. The fire loads in the AT and the klystron galleries are estimated to be 200 and 1051 MJ m−2, respectively, according to the SS-EN-1991-1-2 standard.
Preventive and protective measures in the AT include: fire resistant walls; electrical cables with insulation jackets compliant with the requirements specified in [92] (preventing smoke emission); aspirating smoke detection system; an automatic (pre-action) fire extinguishing system; and low air pressure to dynamically confine a fire. In addition, the klystrons and modulators in the klystron gallery use synthetic ester oil (MIDEL 7131) with a high combustion temperature (316 °C). Automatic fire-extinguishing in the klystron gallery uses a wet-pipe system. Details can be found in [93, 94].
7. Reliability
From a user perspective, the reliability and availability of the neutron beam and the neutron scattering instruments are key performance aspects of the ESS facility. High reliability and availability ensures the efficient execution of the scheduled scientific experiments. If the quality of the beam or its availability or reliability are not good enough to perform the experiments, the scientific goals of ESS might be compromised.
The main goal of the RAMI studies is to estimate the probability and duration of beam interruptions (i.e. trips), and to identify ways to reduce them to an acceptable level. The accelerator is expected to be the principal contributor for trips of all durations. These events occur when the MPS stops beam operations after an event that might damage the machine, for example, sparks due to high voltages of components, or beam losses of the high power beam. Precautionary trips occur frequently. Component failure is another source of interruptions.
RAMI studies help to identify different sources of beam trips, estimate the consequences, and to minimise both the probabilities of occurrence (for example by preventive maintenance) and mitigate the consequences of such events (for example faster recovery, availability of spares, or operation without that component). The RAMI analysis motivate design changes and drives maintenance planning.
7.1. Availability requirements and system allocations
Neutron beam availability and reliability requirements are derived from the user needs [95, 96]. These requirements consider the reliability of the neutron source, its brightness, the consequences of interruptions for the experiments and its measurements, the flexibility of the operations schedule, and good practices followed in similar facilities. The preliminary requirements obtained are summarised as a maximum number of trips with certain durations that can be accepted by the users in table 39 [97].
Table 39. Preliminary requirements on the maximum number of neutron beam trips, and initial allocation to major systems.
| Trip | Unit | Max. | Rate | Initial allocation by system | |||
|---|---|---|---|---|---|---|---|
| duration | rate | unit | Accelerator | Target | Controls | Instruments | |
| 1–6 | s | 120 | /d | 120 | |||
| 6–60 | s | 40 | /d | 40 | |||
| 1–6 | m | 5 | /d | 4.8 | 0.2 | ||
| 6–20 | m | 350 | /y | 340 | 010 | ||
| 20–60 | m | 99 | /y | 90 | 2 | 4 | 3 |
| 1–3 | h | 33 | /y | 29 | 1 | 2 | 0.5 |
| 3–8 | h | 17 | /y | 15.5 | 0.5 | 0.5 | 0.5 |
| 8–24 | h | 6.7 | /y | 5.7 | 0.5 | 0.2 | 0.3 |
| 1–3 | d | 2.9 | /y | 2.43 | 0.5 | 0.1 | |
| 3–10 | d | 0.25 | /y | 0.20 | 0.05 | ||

|
d | 0.1 | /y | 0.075 | 0.025 | ||
The definition of a beam trip is [97]:
The beam is considered unavailable when its power is less than 50% of its scheduled power for more than one minute.
In addition to the trip rate requirements,
The average proton beam power over 10 days shall be higher than 80% of the scheduled beam power.
The preliminary top-level requirements are allocated between the different parts of ESS in order to assign detailed requirements on the individual systems and components. The first allocation of the requirements shown in table 39 is based on experience from other facilities and from expert judgment [97].
Table 39 shows that the accelerator takes the major part of the budget for beam interruptions in all bins. This is due to the complexity of the accelerator, and shows the necessity of understanding in detail and improving its reliability and availability. Comparing to SNS operational data, the requirements from table 39 are relaxed in the lower duration bins, but are challenging to achieve in the bins of more than 1 h [97].
To reduce the number of events lasting one hour or more, an important effort has to be put on the failures of components that require human intervention, which are nearly all failures of components required for operation. Some examples of the most problematic components are the power supplies, electronic cards, pumps, modulators, fans, PLCs, etc [98]. Improving reliability of these components is essential; however, reducing the consequences of failures (e.g. possibility to run with reduced performance) are critical to reduce the time without beam.
The main goal of the RAMI study is to evaluate the design of the accelerator systems in order to estimate the accomplishment of the RAMI requirements and to identify the systems and components that can lead to more frequent and longer interruptions. This work has to identify weak points of the design, evaluate different options and give recommendations to the system owners.
7.2. Accelerator availability analysis
As indicated above, the ESS accelerator is a complex machine that imposes many challenges from the RAMI point of view. First, many of its components are one in a kind, which means that the experience and reliability data about them is non-existent and even if they are used in other places, often, a good record of reliability and maintainability log cannot be found. Second, the accelerator has many uncertainties coming from operation plans, beam physics, spares, and manpower and even from the design itself and its functionalities. Third, the machine has an important degree of flexibility but the consequences for the users of reducing the performance and operating in a degraded mode are not clear. Nevertheless, using some assumptions, the reliability models allow to perform simulations and analytical calculations that are very valuable for optimising the machine design.
To estimate the availability of the accelerator it is necessary to know which components is the accelerator made of, which functions they provide, their probability of failure, and the consequences of the different failure modes. This last point is complex to evaluate and it requires various kind of information. If the component is redundant or not required for normal operation, then the consequence is none for the users. However, if it is essential for operation, it might require maintenance and then the times to access, to diagnose, times for logistics, times to repair, to restart, etc have to be considered. Spares, manpower and other relevant parameters can also be included in the analysis. There is a more complex option in which a failure of a component might lead to the possibility to operate with reduced performance. Such scenario has to be evaluated carefully following the consequences for the users. As described previously, the option of operating with reduced performance was evaluated and considered acceptable for the users with some restrictions. With this definition, and knowing how much the performance will be degraded in each failure scenario, it is possible to make a model that represents that behaviour.
The complexity of modelling the accelerator availability does not allow the use of commercial software. The dedicated software AvailSim is used instead [99]. This software has been used used for the ILC and IFMIF accelerators and is now being used for LCLS-II. An effort has been done to adapt it to the ESS needs.
Having a global overview of the accelerator availability and the contribution of the main systems is important in order to allocate requirements, to identify weak spots, to understand the flexibility of the machine, to have an idea of the spares and manpower required and even to see the consequences of accelerator operation with different schedules.
7.3. Specific RAMI studies
The RAMI analysis is a very important contribution to the design choice process for a machine like the ESS accelerator. Many decisions are taken based on cost, schedule, performance, efficiency, etc. One of the additional aspects considered in such decisions is RAMI, which includes reliability, maintainability, and inspectability studies. In these cases, specific analyses with very detailed boundaries are done to evaluate RAMI aspects of the design. To perform these studies different methods and tools are used depending on the need of the study. Some examples are FTA, reliability block diagrams (RBD), failure mode an effect analyses (FMEA). These studies can be very different one from another, some examples are:
- Tetrodes versus klystrons: an analysis was done to compare the availability of using klystrons or tetrodes for the Spoke cavities [100]. Different configurations for each option were evaluated and the result of the analysis was used in the decision of using tetrodes for that section. The analysis was done with RBDs and included availability, reliability and maintenance considerations. Different flexibility options in the accelerator cavities were evaluated.
- Cryomodules spares quantification for operation: quantification was done to identify the number of spares required for operation in order to reduce the downtime caused by the lack of spares [101]. The calculation was done through availability simulation that included logistic analyses with spare pools and all logistic times associated. This study was used to determine the number of spare cavities required.
- Cryomodules risks when warming-up: a risk analysis was done to estimate the probability of damaging a cryomodule or one of its components when warming up [102]. This study was used as a reason to keep the cryomodules cold for as long as possible and therefore impacting on maintenance of the cryogenic systems.
- Analysis of modulator reliability: one of the possible designs for the modulators to be used at ESS was evaluated from the reliability perspective with very detail since its design showed possible issues from the availability perspective [103]. The method used followed the US Military standard MIL-HDBK-338B and used the data from the MIL-HDBK-217F. In order to support the overall accelerator RAMI analysis, and to consistently and on timely manner identify and address potential issues, RAMI questions and documentation was included in accelerator systems design reviews.
7.4. MP and availability
MP plays an important role in the machine availability; it is the system responsible of avoiding long periods of downtime caused by equipment damage (e.g. overheating, short circuits, beam losses). However, due to the large amount of components to be protected in the accelerator and the high power of the beam, which implies that it has to be very fast and thresholds very accurate, the probability that operation is stopped due to a spurious signal (i.e. false trip) can be very high.
In addition, the accelerator RAMI analysis contributes in the calculations of the reliability of the systems in charge of the protection functions (PFs), estimating and reducing the probability that the systems are not stopping operation when there is a hazard (blind failure) [104]. The main method used is failure mode effect diagnostics analysis (FMEDA), which allows to take into account both false trips and blind failures.
8. Specialised technical services
The specialised technical services (STS) in ESS consists of cryogenics, vacuum, technical cooling water systems, technical power systems and cryomodule test stands. While located in the accelerator division, the STS Group provides assistance to all the ESS Divisions in these technical areas. This approach is taken to promote standardisation, prevent duplication of effort and benefit from economies of scale. The extent of STS assistance varies between disciplines; ranging from design, procurement, installation, commissioning and operation of completed systems in the case of cryogenics, vacuum and test stands to principally engineering design and specification support in the case of cooling water and power systems. Close collaboration with stakeholders throughout ESS and with in-kind partners is required for these STSs to be successfully provided at ESS.
8.1. Cryogenic systems
Cryogenics is an important technology for ESS [105], used in the accelerator, target and neutron science areas. In the accelerator, cryogenics cools the SRF cavity cryomodules (see section 5) to their 2 K operating point both in the linac tunnel and in the cryomodule test stand. In the target, cryogenics provides the nominal 16 K cooling needed for proper operation of the supercritical hydrogen moderator. In the area of neutron science, liquid helium is supplied for use in sample environment systems and in the cooling of superconducting magnets found in some of the instruments.
Three separate cryoplants form the ESS cryogenics system: the ACCP which cools the linac SRF cavity cryomodules, the TMCP which cools the hydrogen moderator and the TICP that provides liquid helium to the instruments and provides cooling to the SRF cavity cryomodules at the cryomodule test stand. The design decision to use separate cryoplants was driven by the goal to increase system availability, allow optimisation of the cryoplants and as a response to the differing schedule needs of the various cryogenic systems [106]. The cryoplants share a common cold box hall and a common compressor building near the accelerator gallery. Dedicated CDS connect the cryoplants with the components being cooled. A site-wide helium recovery and storage system supports these cryoplants. Recovery and reuse of helium is a key sustainability goal of the ESS.
Liquid nitrogen will be supplied throughout the site by a commercial vendor and then vented to atmosphere once used.
8.1.1. Accelerator cryoplant
A dedicated ACCP is used to serve the accelerator superconducting section. The ACCP is the largest and most complicated of the ESS cryoplants. The cooling requirements and the initial concept design have been developed and improved over the years [107–111].
Architecture. The ACCP consists of a warm compressor, oil handling and gas management station, located in the ACCP compressor building, and one single coldbox, located in the cold box building. The simplified block diagram in figure 60 shows the main components of the ACCP, consisting of:
- The warm compressor station circulating helium at the flow rates and pressures required by the ACCP cold section
- Helium gas treatment comprising bulk and final oil removal and a gas dryer
- Gas management panel for process control
- One cold box mainly containing six turbines, three cold compressors in series, two 80 K adsorbers, one 20 K adsorber, several heat exchanger blocks and acceptance test equipment to provide the specified cooling and tests
- An ambient heater to assist warm-up of the system or the cool-down of single cryomodules
- Liquid helium storage tank
This equipment forms part of a single procurement by ESS. Other related equipment required to run the ACCP, particularly warm helium storage tanks, warm interconnecting piping, the CDS or the recovery system are separate procurements or in-kind contributions to ESS.

Figure 60. Simplified ACCP flow diagram.
Download figure:
Standard image High-resolution imageCooling requirements and steady state operation modes.Detailed thermal performance studies and analyses have been performed to estimate the heat load imposed on the CM and the CDS including heat load due to beam losses. The 2 K heat loads consist on the isothermal load, which is applied to the liquid helium bath surrounding the cavities and the non-isothermal load from the CDS. The isothermal load, including the statics and dynamics from RF loses in the cavity walls and beam losses, determines the helium mass flow through the 2 K circuit handled by the cold compressors. The non-isothermal load will strongly affect the 2 K return temperature at the inlet of the first cold compressor. The installed cooling capacities of the ACCP are 3050 W at the 2 K circuit, 9.0 g s−1 liquefaction rate at 4.5 K for power coupler cooling and 11380 W at approximately 43 K for the TS.
The main steady state operation modes include the nominal design comprising both beam and RF operational and the nominal turndown with both beam and RF non operational. The former mode features the highest cooling capacity needed in both stages. In the latter, the total heat deposited into the 2 K circuit comprises only the static load. The 2 K refrigeration cycle is able to efficiently handle the dynamic heat load range. Two standby operation modes include 4.5 K standby for several-days interruptions of the RF power and beam and TS standby for the scheduled machine maintenance lasting 90 d per year (approximate 60 d in summer and 30 d in winter). In addition, the maximum 4.5 K liquefaction capacity of the designed system is used for cool-down and CM re-filling operation.
Project stages. The different groups of cryomodules, spoke, medium beta and high beta cryomodules, are installed and commissioned stepwise in the tunnel.
In order to achieve stable and efficient operation the cryoplant operates in two configurations, namely stage 1 and stage 2. This is realised by means of two sets of flow parts for cold rotating equipment, turbine expanders and cold turbo compressors, and variable frequency drives in the warm compressor system. The stage 1 turndown 2 K load is 48% of the stage 2 installed 2 K load. In the case that not all safety factors are required, The stage 1 turndown 2 K load is 30% of the stage 2 installed 2 K load. As this turndown ratio can not be handled by the cryoplant in an efficient manner; the relatively simple configuration with two sets of flow parts provides a good additional load adjustment possibility and has advantages in the spare strategy. The variable frequency control for the low pressure (LP) compressor, the sub-atmospheric pressure (SP) compressor and the cold compressors also help to provide efficient plant adaptation in all intermediate modes.
Design choices. The cryogenic system provides 4.5 K helium at a pressure of 0.3 MPa to each cryomodule. The actual production of 2 K helium occurs in the tunnel by means of a combination of a 2 K heat exchanger and a subsequent Joule-Thomson valve, found in each of the cryomodule-valve box assemblies. This kind of set-up permits independent warm-up/maintenance/cool-down of single cryomodules while the rest of the system is maintained in cold condition. The helium vapour with the corresponding saturation pressure of 3.1 kPa is warmed in the 2 K heat exchanger and by static heat load in the CDS before returning to the cryoplant. There, a combination of cold and warm compression stages ensures high flexibility regarding load adaption at optimal efficiency. Industry studies have shown that this concept and the decision to use one integrated coldbox for all cold ACCP components provide highest space and investment cost saving.
The ACCP operates without using liquid nitrogen pre-cooling as the load is dominated by 2 K refrigeration. The other two cryogenic loads that the cryoplant has to supply—TS cooling and liquefaction load for cooling the RF main power couplers—represent only 11% and 10% respectively of the plants total energy. This load combination makes the use of liquid nitrogen pre-cooling less attractive as performance boosting with LN2 pre-cooling is moderate in this load regime. The very thin walled cavities result in a relatively low cold mass of only 20 tons for the whole accelerator [108]. Hence cool-down is not a significant issue and LN2 support not required. Only expansion turbines will provide the cryogenic refrigeration in the ACCP, increasing reliability, capital cost saving and traffic reduction.
The TS temperatures are chosen to optimally fit not only the CM designer needs but also the ACCP process layout. This applies particularly on the temperature step across shield feed and return which should match the temperature step the related turbine string in the ACCP does. Turbine 3 in the ACCP takes care of the shield cooling and operates between HP inlet and MP outlet, resulting in a temperature step of about 20 K. The selected TS temperatures are >33 K in and <53 K out.
The ACCP control system is based on local PLC for internal, time critical and deterministic control loops and safety functions. Supervisory controls and high level batch operations run in the EPICS process controller. The HMI on local screens as well as in the control room, alarm handling and data archiving are all based on EPICS. This functional split between local PLCs and EPICS IOC provides safe operation even in case the EPICS IOC shuts down. The ACCP control system is compatible with the other linac control, providing all advantages of an open control system.
The ACCP compressor system is one of the heavy energy users at ESS. Apart from the focus on matching the cryoplants refrigeration capacity optimally with the linacs load requirements a second approach for using energy efficiently is to recover heat from the cooling water. For this purpose the compressors oil coolers are designed to minimise the temperature differences between cooling and warming flows. The cooling water flow to the single coolers is controlled primarily to achieve the required oil outlet temperatures but secondarily also to achieve a preferably high temperature spread between inlet and outlet of the cooling water. Besides reducing the required cooling water flow the water returns at elevated temperatures, enabling efficient heat recovery to serve Lund's district heating system and greenhouse applications.
8.1.2. Cryogenic distribution system
The ESS CDS connects the ESS superconducting linac cryomodules with the ACCP. Its main function is to transfer the required cooling power from the ACCP to all the elliptical and spoke cavity cryomodules. The nominal operating temperature for the linac cavities is 2 K. However, the helium is delivered in two temperature levels: 4.5 and 40 K [109]. Then, the 2 K temperature level is produced at each cryomodule by isoenthalpic expansion of the 4.5 K supercritical helium, previously subcooled to 2.2 K in a counterflow heat exchanger.
The CDS consists of a CTL, a cryogenic distribution line and four auxiliary process lines, as shown in a schematic layout of the ESS linac cryogenic system in figure 61. The CTL runs from the ACCP cold box located in the cold box hall into the dedicated CTL gallery with a chicane leading directly to the linac tunnel. The CTL ends with a splitting box equipped with two cryoline terminals. The first terminal is connected to the cryogenic distribution line designed for serving all the 13 spoke and 30 elliptical cavity cryomodules of the Optimus + linac [112]. If the ESS linac requires any future extensions an additional CTL will connect all the contingency or/and upgrade cryomodules to the other terminal.

Figure 61. Layout of the cryogenic distribution system for the linac.
Download figure:
Standard image High-resolution imageThe cryogenic distribution line of the Optimus + linac is located in the linac tunnel alongside the cryomodules. It consists of 43 valve boxes and an end box. Each valve box is equipped with cryogenic control valves and some other process control elements, such as check valves, warm control valves, safety valves as well as pressure transmitters and temperature sensors. Figure 62 shows the conceptual design and flow diagram of the valve box for the elliptical cavity cryomodules.

Figure 62. Valve box for elliptical cavity cryomodules. Top: conceptual design. Bottom: process and instrumentation diagram.
Download figure:
Standard image High-resolution imageThe valve box design results from a number of main functional and technical requirements for the CDS that fundamentally come from the top-level requirement of 95% availability of the ESS linac itself. The CDS must be extremely reliable throughout the expected lifetime of 40 years. It must facilitate easy repairs or even easy replacements of faulty components, since the linac is operated remotely and continuously 24 h per day, for about 250 d per year. As a result, the valve box and entire CDS designs allow for warm-up and cool-down of a single cryomodule while keeping the rest of the system at cryogenic temperatures. They also keep very high thermal and mechanical properties within the operation lifetime and tolerate rapid cool-downs and warm-ups [113].
To meet these requirements the valve box contains six cryogenic valves (CV03, CV04, CV05, CV60, CV61 and CV63) and 2 warm valves (CV05 and CV62) as shown at the bottom of figure 62. In the nominal operation conditions CV03 and CV04 are fully open. Supercritical helium at 4.5 K and 3.0 bar flows from the Helium supply line to the cryomodule cold circuit. The major portion of this helium is throttled below 31.3 mbar and the liquid fraction of the produced 2 K helium cools down the cavities. The required subatmospheric pressure in the cavity helium vessels is produced by the constant evacuation of the helium vapour via the BB line, CV04 and further via the VLP line to the ACCP cold compressor system. The other portion of the supercritical helium is used for cooling the cavity power couplers, and returns to the ACCP compressor station as gaseous helium at 300 K and 1.1 bar.
The CDS also distributes 40 K helium to the cryomodules. This helium flows from the TS supply line to the cryomodule TS circuit, via the BE line and CV60, and return to the TS return line via the BF line and CV61. Since the BF line and TS return line are thermally linked to the CDS TSs the lines also work as thermal sinks for the 40–50 K heat loads of the cryogenic transfer and distribution lines.
The two remaining cryogenic valves (CV06 and CV63) and the warm control valves (CV05 and CV62) are dedicated to facilitating and speeding up the warm-ups and cool-downs of a single cryomodule. If one or a few cryomodules need some maintenance or repair work at room temperature the cooling loops in the particular cryomodules are shut off, whilst the other cryomodules are brought to the so-called 4.5 K stand-by mode. Then, just after the evaporation of the liquid helium from the cavity helium vessels in the serviced cryomodules, warm helium from the HP line is supplied to the cryomodule circuits via the BH line, CV05 and CV62. The supplied helium warms up the cold parts of the cryomodules and flows to the ESS helium recovery system via CV06, CV63, the BR line and the helium recovery line. Later, after maintenance or repair, valves CV05 and CV62 are closed and valves CV03 and CV04 are opened in order to bring the serviced cryomodules back to the cryogenic conditions. As soon as the cryomodule cooling loops are sufficiently cold, valves CV06 and CV63 are closed and valves CV04 and CV61 are opened, and the entire linac cryogenic system is brought back to the nominal operation conditions.
The valve boxes for the spoke cryomodules differ slightly from those for elliptical cryomodules. In order to optimise the design and assembly of the spoke cryomodules some items of the cold circuit are moved from the spoke cryomodules to the related valve boxes. Therefore each of these valve boxes additionally houses a counterflow heat exchanger and two additional cryogenic control valves, i.e. a throttling valve and a filling valve of the cavity helium tank.
8.1.3. Target moderator cryoplant
One key feature of the target system is the hydrogen moderators, which use supercritical hydrogen at 17 K and 1.5 MPa to reduce the energy of the neutrons before they reach the instrument lines. Neutrons, protons and photons deposit significant energy into the hydrogen, which must be removed to maintain the hydrogen at its nominal operating temperature of 17 K. The TMCP [114] cools this hydrogen cryogenic moderator system (CMS). The heat deposited into the hydrogen is removed via a heat exchanger in the CMS coldbox that transfers the heat from the hydrogen circuit to a gaseous He circuit operating between 15 and 20 K which is connected to the TMCP cold box via a CTL.
Target cryogenic system overview. The target cryogenic system consists of three subsystems: the CMS, the TMCP, and the CTL. The CMS [115] comprises a vacuum insulated cryostat that contains hydrogen circulation pumps, a helium/hydrogen heat exchanger, an ortho-to-para hydrogen conversion catalyst bed, a pressure control accumulator, interconnecting piping, valves, and instruments. Supercritical cryogenic hydrogen circulates through vacuum insulated piping connecting the CMS cryostat with the cold moderators, which are located at the target wheel. The TMCP is comprised of a cold box containing turbo-expanders, heat exchangers, and associated valves and piping; a warm compressor station containing helium compressors, oil removal system, gas management panel, and associated piping and controls; and an automatic control system. The CTL consists of a set of vacuum insulated piping (one supply line and one return line) that circulates cold helium between the TMCP and CMS. Figure 63 shows a simplified schematic of the target cryogenic system.

Figure 63. Simplified schematic of the target moderator cryogenic system.
Download figure:
Standard image High-resolution imageTMCP design. The total heat load handled by the TMCP is the sum of the CMS heat load plus the additional static ambient heat load into the helium from the CTL. The TMCP must operate efficiently over a wide range of heat loads due to the following factors:
- (i)The neutronics heat load can change significantly depending on the proton beam power.
- (ii)Beam trips will also result in large changes in heat load for short durations.
- (iii)The ESS linac will be commissioned in phases, with proton beam power increasing incrementally as additional cryomodules are installed, over several years.
Table 40 outlines the required cooling capacity of the TMCP with no beam, initial beam commissioning, and at each phase of accelerator commissioning.
Table 40. Target moderator cryoplant heat load range.
| Beam mode | Beam power | Total TCMP |
|---|---|---|
| maximum | heat load | |
| (MW) | (kW) | |
| Off | 0 | 4.9 |
| Commissioning | 0.5 | 7.3 |
| Phase 1 | 1.4 3 | 9.42 |
| Phase 2 | 3.2 3 | 19.82 |
| Phase 3 | 5.0 1 | 30.25 |
The TMCP minimum allowable helium temperature is set considering the H2 freezing point of 13.8 K. A margin of 1.2 K is added, setting the minimum TMCP supply temperature at 15 K. The maximum temperature is determined considering the maximum CMS hydrogen temperature of 20.5 K. Therefore, the design of the TMCP is based on a heat load range of approximately 4–32 kW, and operating temperature range of 15–20 K.
TMCP operation. The TMCP accommodates ESS overall operating modes and the CMS requirements by defining three sets of operational modes:
- (i)Steady state modes—Nominal design, nominal low power, and nominal turndown.
- (ii)Transient operating modes—Cool down and warm up.
- (iii)Switching modes—Long term switch from nominal to turndown, long term switch from turndown to nominal, and beam trip.
Accommodating the large variation in heat load and narrow operating temperature range of 15–20 K requires a sophisticated control scheme to operate efficiently. The proposed TMCP process design features two parallel warm compressors and two parallel turbo-expanders to accommodate the high load variation, as well as using the so-called floating pressure cycle [116] for a significant portion of the operating range.
8.1.4. Test and instruments cryoplant
The TICP primarily provides refrigeration for the cryomodule test stand in a closed loop [117]. Its secondary function is to provide liquid helium for the neutron science instruments in an open loop. The TICP is the smallest of all three cryoplants. It is essentially a customised standard plant, twenty times smaller than the ACCP [118]. The sub-atmospheric pressure (SP), required for the test stand operation temperature of 2 K, is created by means of a warm process vacuum pump station, comprising a set of two parallel roots pumps and rotary vane pumps. The flow is too small for efficient cold compression.
Like the ACCP, the TICP delivers supercritical 4.5 K helium for the 2 K circuit, 40 K refrigeration for TS cooling and helium liquefaction for the coupler cooling. With very low 2 K heat loads, cold sub-atmospheric compression is not feasible. Instead, the returning vapour flow is heated up and compressed in process vacuum pumps to the low cycle pressure. Hence for the TICP the supercritical 4.5 K helium flow translates to constant level liquefaction of about 4 g s−1. Furthermore, the TICP provides refrigeration of about 390 W between 33 and 53 K for TS cooling. The TICP size is not impacted by the static load on the transfer line, interconnecting TICP coldbox and cryomodule test stand, apart from the TS. In fact the load on the transfer line is allowed to be quite high and is only limited by the operational restrictions of the economiser in the cryomodule.
The test stand load translates into energetically equivalent rising level liquefaction of about 130 l h−1. This is considerably more than required later, when serving the liquid helium demands of the neutron instruments and their sample environments. When operating to supply the cryomodule test stand, the characteristic plant load is ideal for liquid nitrogen pre-cooling. This reduces the plant size significantly and halves the electrical power and cooling water consumption. For the normal TICP liquefaction operation in an open loop, there is the choice to pre-cool with liquid nitrogen or not, depending on the specific needs at the time of operation. A variable frequency drive for the recycle compressor helps to cope with the different load scenarios and use the plant most efficiently.
One of the worst case scenarios in view of the cryogenic system at ESS is a long power shut down, causing the helium in the cryomodules to evaporate due to the static heat load. In this case the evaporating helium flows eventually into the main LP line of the ACCP that is connected to the equivalent main LP line of the TICP. The TICP recycle compressor, that receives power from a backup system, is able to compress the evaporating helium and shift it to the warm medium pressure storage tanks, avoiding a major loss of helium.
8.1.5. Helium recovery and storage
Apart from the three cryoplants and the vast cryodistribution system, the CDS comprises auxiliary equipment including an external, stand-alone purifier, an impure helium recovery system, warm high and medium pressure gas storage, liquid helium and nitrogen gas storage.
The cryogenic system contains substantial amounts of helium. During nominal operation about 3 Tm of cold helium circulates between the cryoplants and their loads, not counting the helium in the 20 m3 s−1 fill liquid helium storage tank attached to the ACCP [118]. Up to 19 tanks, each with a geometrical capacity of 70 m3, store the helium in warm condition at about 20 bar.
About two thirds of this helium is contained in the cryomodules and distribution system of the cold linac Before the pump-down to 2 K, when being filled with liquid helium, the linac and cryodistribution systems require about 130 kg more helium than during nominal operation. This is due to the large 2 K vapour return line, which is filled with 25 times denser vapour at 4.5 K compared to the gas at nominal conditions. The density increase of the liquid helium during pump-down has a slightly lower impact and affects only the cryomodules, not the CDS.
A significant portion of the helium is deposited in the long transfer lines connecting the TMCP and its load (the CDS) in the target building. The cryoplant loads and cools down about 350 kg of helium from warm to operating conditions [119].
When the TICP is serving the cryomodule test stand, it operates in a closed loop. The helium to fill the connected test cryomodule is stored in a warm buffer tank. The amount needed is insignificant compared to the amount required for the bigger cryoplants.
The expected monthly consumption of the neutron instruments, sample environments and related facilities is about 7500 l of liquid helium. Helium is liquefied by the TICP into a dedicated 5000 l liquid helium storage tank, transferred to mobile helium dewars and transported to the neutron science users, with three satellite gas collectors and gas bags in the neutron instrument halls. From there the helium returns warm at a more or less constant flow rate to the central helium recovery system where it is pressurised and stored in twelve 1 m3 high pressure storage vessels at 200 bar. Connected to the central helium recovery system are also the flash gas return connections form the mobile dewar filling station, the neck cooling discharge connections from the liquid helium storage tanks, the discharge connections of the safety relief valves protecting the sub-atmospheric circuits, discharge from helium quality detectors and diverse purge and regeneration connections from the cryoplants and helium purifiers.
Pressurised 'dirty' helium is mainly purified in the internal purifier of the TICP cold box when the liquefier is switched on. An external purifier is available when the TICP cold box is not running or helium has to be replenished for the closed loop systems. This purifier is a fully automatic stand-alone unit, based on liquid nitrogen cooled absorber beds and a drier connected upstream. The purified helium from this stand-alone purifier is distributed to the clean medium pressure storage tanks or can feed directly the ACCP.
8.2. Vacuum systems
Conventional vacuum technologies are good enough to meet the performance required by the users. The vacuum team is responsible for all technical vacuum systems, including accelerator, target and neutron science instruments. The team provides guidance and on going support to ensure the implementation of compatible vacuum designs for vacuum chambers, instruments, detectors and other equipment exposed to a technical vacuum environment and supporting these systems during commissioning and operations.
A vacuum standardisation policy provides an integrated approach to all vacuum system activities including the selection and use of standard interchangeable vacuum equipment, minimising project costs, reducing spares holdings and training. The overall design, selection of materials, manufacture and test of vacuum components and systems is delineated in the ESS Vacuum Handbook [120] and is applicable to all Technical Vacuum Systems within the responsibility of the ESS Vacuum Team.
Vacuum test facilities support ongoing vacuum activities in the design and development of equipment and operational procedures of the various vacuum systems used. These facilities comprise:
- A Particle Test Facility' that supports the development of equipment and procedures needed for the superconducting region of the accelerator where particle control is essential. The risk of contamination during cryomodule installation and vacuum operations must be measured and minimised. Operations such as assembly, valve operation or instrumentation, pumping down and venting as well as steady state operation of equipment as ion and getter pumps, can result in the liberation of particles at the sub-micron level that degrades the performance of the superconducting cavities if precautions are not taken. The facility consists of a series of clean rooms with changing area for donning of cleanroom apparel and laminar flow benches design to achieve ISO class 3 (ISO 14644) during quiescent periods and ISO class 5 during periods of active use.
- A Material Test Facility that supports the selection and approval of materials used in a vacuum environment in accordance with the requirements of the Vacuum Design Handbook. The majority of the work conducted in this facility is to support the accelerator and neutron instrument design, where materials used for the accelerator instrumentation and neutron guide tubes can pose specific vacuum issues due to outgassing and in some cases undesirable constituents resulting in the need for preconditioning prior to installation. The selection of vacuum compatible cabling, to minimise the contamination of vacuum spaces from the outgassing of hydrocarbons from plasticisers inherent in cable insulation, is made using this facility. The selection process also includes a quality control aspect requiring the batch-to-batch monitoring of materials for potential changes as a result of the manufacturing process. Surface finishes can also have an adverse affect on vacuum performance, and need to be qualified for use.
- A Gauge Calibration Facility that confirms the operation and calibration of all vacuum gauges prior to installation with calibration performed against secondary standards (from 1 to 10−7 Pa). All vacuum gauges installed on the accelerator, target and neutron instruments are calibrated on this facility before installation. Performance evaluation on controllers for time responses on fast signals and long term operation are others task performed in this facility.
- A Vacuum Integration Test Facility that provides the capability for seamless integration of all vacuum systems used on the accelerator, target and neutron instruments with the integrated control system (ICS). Control logic and interlocks are checked before implementation on the actual systems for which they are designed. EPICS control screens are developed together with data acquisition functions using this facility. This facility comprises a vacuum vessel that with the installation of vacuum pumps, valves, gauging and any other vacuum equipment used to replicate any vacuum subsystem or system used on the accelerator, target or for neutron instruments. While the equipment will be physically different (in most cases smaller) it will operate in the same manner providing a vehicle for the development of the vacuum-to-controls interface.
8.2.1. Accelerator vacuum systems
Accelerator vacuum systems service the entire accelerator from the PS to the target station.
The front-end systems comprise the PS, LEBT, RFQ, the MEBT and the DTL. With the exception of the MEBT and DTL, these front-end systems handle the high hydrogen and nitrogen gas load needed for PS operation. As such, the vacuum pumping systems are sized to handle the gas loads needed for ionisation within the PS and exhaust from these pumps which must eliminate the potential for the formation of explosive mixtures. Mass flow controllers provide the independent flow of hydrogen and nitrogen into the PS with pressure measurements made using a capacitance manometer to eliminate errors due to changes in gas composition inherent with a Pirani style of gauge.
Injected gas pumping is provided by four TMP, nominally rated at 600 l s−1, located in the LEBT. No pumping is provided in the PS. Two dry pumps back the four TMP's through a common manifold to provide redundancy. While the typical operating pressure of the PS and LEBT is in the 10−2 Pa range, these systems are directly coupled to the RFQ, which operates at a pressure of less than 10−4 Pa to minimise beam-gas and RF interactions. An orifice 14 mm in diameter, located on the beam path, enables a pressure gradient from the LEBT to the entrance of the RFQ where up to ten 200 l s−1 TMPs satisfy the pressure constraints at the entrance to the MEBT, where the pressure is 10−5 Pa or better. As with the LEBT, the TMPs are backed by two dry pumps connected to a common manifold to provide redundancy.
The MEBT operates in the range 10−5–10−6 Pa. It is pumped by a series of noble diode ion pumps, nominally 100 l s−1, distributed along its length. Initial pump down uses a TMP directly connected to the MEBT beam pipe and backed by a dry pump. Vacuum measurements are made by a combination of Pirani and Penning vacuum gauges. Gate valves located at the outlet of the LEBT, RFQ and MEBT allow these sections to be isolated for vacuum pump down and maintenance. All metal sealing is used to the maximum extent possible and all systems are vented with dry nitrogen.
On exiting the MEBT, the beam enters the five DTL tanks, which also operate in the range 10−5–10−6 Pa. These tanks are 7.5 m in length and 0.5 m in diameter, fabricated from copper and driven by RF power entering each tank though ceramic windows. Each tank is pumped by three noble diode ion pumps rated at 300 l s−1 distributed along the length of the tank, pumping through a screen that limits the RF power deposited into the ion pump to 4 mW. Initial pump down to the ion pump initiation pressure is accomplished from a common pumping manifold servicing all tanks, backed by dry pumps. This also provides the capability for DTL tank leak testing. Vacuum measurements are made using both Pirani and Penning vacuum gauges. Gate valves are located between each tank, except that space constraints force tanks 1 and 2 to share a common vacuum.
In-between the warm and cold sections of the linac is the LEDP unit, designed to protect and limit the flow of gas into the cold section of the accelerator, with a pressure reduction ratio of 100:1. Pumping is performed by three noble ion pumps distributed along the length of the LEDP. In addition, cold cavity protection is provided by a fast valve with a closure time of less than 10 ms. This valve closes on rising pressure and limits the flow of gas in an unplanned air in-rush event. Initial pump down is achieved using a mobile pump cart incorporating a TMP and dry backing pump. Again, Pirani and Penning vacuum gauges and all metal sealing are used to the maximum extent possible. The system is vented with dry nitrogen.
Downstream of the LEDP is the first spoke cavity. At full beam power of 5 MW, the cold section incorporate 26 spoke, 36 medium-β and up to 84 high-β cryogenically cooled elliptical cavities. These cavities are cryogenically pumped at between 2 and 4 K. It is imperative to limit the build up of the monolayers, so as not to degrade cavity performance. The limit is about 20 or 30 monolayers at the end of operations that extend over 30 years. The vacuum interface with the cryomodules must also take into account the limited capacity for intervention.
The cryomodules are also susceptible to particulate contamination at submicron levels that may degrade their performance due to field emission and will lead to cavity quenches. The cavities pump cryogenically when cold, and so do not require auxiliary pumping. Each cryomodule incorporates a metal seal gate valve at each end that remains open during operations, and is only closed during accelerator maintenance periods. Pressure within the cavity is measured by a means of a Penning gauge. A separate vacuum jacket is cryogenically pumped following initial pump down, providing part of the thermal insulation of each cryomodule. Active pumping is available to pump potential helium leaks into the jacket. This system is a TMP based system servicing a number of cryomodules.
LWUs as shown in figure 64 are located between cryomodules and at regular intervals from the last cryomodule to the PBW. Each LWU comprises a beam pipe with centrally located pumping system and accelerator beam diagnostics. Bellows at each end of the beampipe act as interface between cryomodules. The LWUs are cleaned and assembled under ISO class 3 conditions, and installation is performed in portable clean rooms providing ISO class 3 conditions. Each LWU is evacuated after installation, using a mobile pump cart before starting the low profile NEG-ion pump used in normal operation that provides an emergency egress route under the LWU beam pipe. The LWU is pumped to a pressure below 10−6 Pa before opening the gate valves and cooling the cryomodules to operating temperature. When cold, cavity pressures will be less than 10−8 Pa.

Figure 64. Linac warm unit (LWU).
Download figure:
Standard image High-resolution imageAt the exit from the last cryomodule the high energy differential pumping unit, like the LEDP, protects and limits the flow of gas into the cold section of the accelerator.
8.2.2. Target vacuum systems
The major target vacuum system is in the monolith, which operates under either helium or a high vacuum environment. The PBW is eliminated In the vacuum mode, providing the beam with a clear path to the target wheel, with monolith pressures of less than 10−3 Pa. The monolith operates under high vacuum and incorporates both roughing and high vacuum systems. Condensing coils are used in conjunction with a turbo-molecular pump during initial pump down, to handle the high water vapour load that is anticipated.
The PBW is installed in the helium mode, isolating the monolith and HEBT vacuums. The PBW incorporates inflatable metal seals that mate with metal flanges in the accelerator beam pipe. The window is designed for routine remote replacement, and allows remote leak testing. A service valve located on the upstream side of the PBW allows vacuum isolation during PBW replacement.
8.2.3. Neutron science instrument vacuum systems
The vacuum systems for the first instruments incorporate choppers, neutron guides and detector tanks. Both choppers and neutron guides operate in the 10−1 Pa range, incorporating pumping systems using TMP.
The neutron filter materials used in some neutron guide tubes pose specific vacuum issues due to outgassing and, in some cases, undesirable constituents resulting in the need for preconditioning prior to installation. The Material Test Facility is used for material evaluation and to assist in the design and strategy needed during installation, commissioning and installation.
Detector tanks have volumes from around 1 m3 to several hundred m3, operating in the pressure range from 10−1 Pa to 10−4 Pa, with some tanks requiring fast cycle times. This variety in design parameters leads to a spectrum of vacuum system designs. A central venting system provides a controlled environment to the various vacuum systems. A supply of clean, dry and filtered air prevents contamination that could degrade equipment, materials, etc, resulting in a loss of performance. Dry air enables fast system pump down, a critically important feature for instruments that requiring a fast cycle time.
Thin windows on the entrance and exit sides of the neutron guides and choppers are usually diaphragm plates, in which the deflection may be greater than half of the diaphragm thickness. These windows have limited exposure to cyclic loading (typically less than 1000 cycles) and are not generally subject to negative load cycling. The Thin Window Test Facility enables loading and unloading cycle tests, which are performed on each window assembly to ensure structural integrity prior to installation.
8.3. Cooling water systems
Besides the two core areas of cryogenics and vacuum, the STSs group also provides site wide cooling support. By acting as a liaison between and the CF division and all end users STS Division provides technical design support and management of interface requirements, making sure the cooling system adheres to applicable codes and standards, as well as meets requirements in terms of functionality, capacity and safety. The cooling system succeeds in being robust, safe and reliable, by using state of the art, modern industrial components, materials, and engineering solutions, and by incorporating unique aspects and experiences from other research facilities.
District heating is a common means of heating industries and buildings in southern Sweden. ESS makes use of this opportunity and sell its waste heat back to the district heating system. Thus, the ESS facility is not cooled by cooling towers, but by heat pumps that then interface with the district heating system.
Starting from the low energy end of the accelerator, the ion source requires cooling to maintain stable operating and test conditions. Some ion source components are cooled at a high voltage of 75 kV. Low conductivity, necessary to avoid stray currents, enhances the corrosiveness of the ion source cooling water, in particular with copper components. Thus the cooling system is equipped with oxygen removal systems, pH has to be maintained, and in general the water chemistry is kept within specified limits. ESS uses state-of-the-art practices from industry to solve this problem, drawing in particular from power transformer cooling systems that have similar challenges.
Two of the most important accelerating structures are the RFQ and the DTL. The RFQ tank is tuned to resonance by changing the temperature of the various parts and thus controlling the deformation. RFQ and DTL cooling systems are delivered from in-kind partners, with whom the STS cooling team works closely. The RFQ cooling system contains a number of pumps and circuits that allow for independent cooling of the RFQ body sections and vanes. The DTL is also thermally tuned in a similar way, although mechanical tuners are mainly used do the dynamic tuning, so the cooling system is somewhat less complicated.
RFQ and DTL sections are powered by horizontal 354 MHz 3 MW klystrons, while the spoke section is powered by Thales TH595 tetrodes, and the medium-β and high-β sections are powered by vertical 704 MHz 1.5 MW klystrons. Klystron oil tanks, bodies and solenoids are cooled by medium temperature water, at 25 °C. Because as much as 40% of the power is dissipated as waste heat in the collectors, they are cooled by the high temperature circuit, at 50 °C. The waste heat from the collectors can go directly to the district heating system without using intermediate heat pumps.
When cavities are out of tune, or during pulse rise and fall times, power is reflected back to the klystrons. As this reflected power could damage the klystron, circulators are installed, which redirect the power waves into dummy loads. Depending on the operating mode, the various fractions of the total power dissipated in the collectors, loads and beam differ. The loads are also installed on the high temperature circuit, as this minimises temperature fluctuations on the collectors if, say, the beam goes down. The RF components pose many interesting challenges ranging from practical matters such as installation and technical layout, to future operation and maintenance.
Other important stakeholders are the neutron instruments, located in the large instrument halls and consisting of a number of sub-assemblies, such as choppers, neutron guides, detectors, and sample environment equipment. Neutron instruments will be continuously changed and redesigned during the lifetime of ESS, so cooling solutions have to be highly flexible, but yet robust and reliable, since availability is very important for the users.
8.4. Electrical support systems
8.4.1. Power system
ESS is supplied by two transformers (130/24 kV, 63 MVA) and uses 130 kV switchgears. The transformers and switchgear are outdoors, installed within protective concrete walls that contain fire and explosion. The connection points to the ESS electrical grid are at the 24 kV incoming cubicles inside the Primary Substation building, as shown in figure 65 [121].
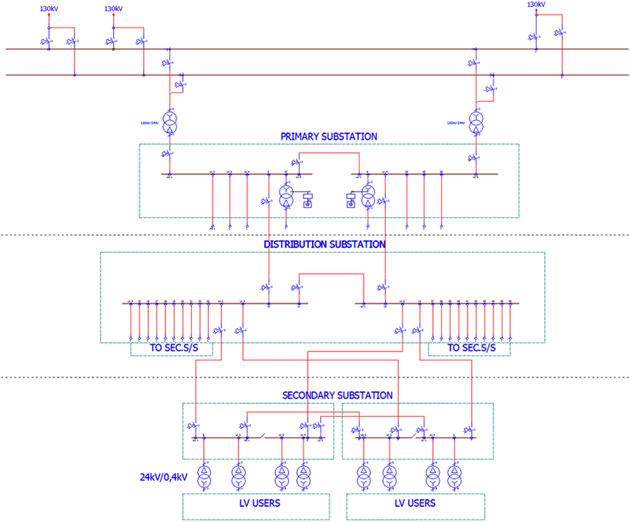
Figure 65. Layout of ESS MV-distribution system (courtesy of E. Vaena).
Download figure:
Standard image High-resolution imagePrimary substation (H05) directly feeds the target station, instrument halls, and site offices, as well as the distribution substation (H06) which, in turn, supplies the cryoplants (G04), the accelerator (G02), the central utility building (H01) and houses the backup generators. The ground point for the 24 kV power systems is provided by zero-point transformers and grounding resistors (zero-point equipment), limiting the single-phase fault current to approximately 5 A. Under these conditions, the mandatory required separation between the MV cables and other services is reduced to 50 cm.
Secondary substations convert MV from the distribution substation to the voltage levels required by plant and equipment: 400, 600, 690 V and 6.6 kV. The secondary substations are equipped with four transformers, one MV and one LV switchgear, both including two separate groups of three phase bus bars that can be connected through transfer switches in case one incoming feeder trips. The installed power per substation is 40% more than the actual maximum load, allowing the substation to operate with one transformer off.
The 6.6 kV switchgear is of the same type and construction as the 24 kV systems, to simplify service, operation and maintenance of the HV equipment. The 400 V and 690 V switchgears comply with applicable standards for enclosure isolation class form 4 A/B, and are equipped with arc guard and over current protection.
8.4.2. Monitoring and control
Power grid status and event lists are monitored and operated by a supervisory control and data acquisition system. The SCADA system communicates this information to the ICS), enabling machine operators to monitor the status of the power supplies, and to assist them with diagnosing failures.
8.4.3. Backup and UPS
A cluster of redundant diesel generators, providing up to 3 MVA, is installed in the secondary distribution station to back up the 24 kV grid. This power is provisioned by the SCADA system. For specific, highly safety-critical purposes, local backup or UPS-solutions are required. Remote backup and UPS-power is foreseen for conventional safety-related systems, such as ventilation, fire, and security. Smaller amounts of UPS power, around 40 kVA, are provided by UPS systems installed in the low voltage switchgear room of the secondary substations. Small UPS systems are designed for five minutes of endurance, backed up by generators.
8.4.4. Grounding
The grounding system satisfies several general requirements: electrical safety requirements; EMC/EMI compatibility; and practicality for the installers and users. It is based on a standardised meshed bonding network (MESH-BN) topology [122, 123]. The mesh includes all metallic civil elements (such as pillars, reinforcements) as parts of the protective bonding (PB). Galvanised strip steel conductors are installed and clamped to the reinforcement bars at regular intervals. Conductors entering the buildings are connected to the potential equalisation (PE) network at the penetration points. The PB and PE networks are bonded together and connected to physical earth at the lightning down-conductors, and the PE-bars, inside the electrical substations, as shown in figure 66.

Figure 66. Implementation of the meshed bonding network (MESH-BN) [122].
Download figure:
Standard image High-resolution imageAdditional grounding meshes are installed in the floors of the klystron gallery, the AT and the front end building (FEB), due to the expected level of EMI in these areas. This EMC-mesh spacing is sized to approximate a ground plane for the expected EMI from the RF-power supplies, resulting in a mesh size of 2 m by 2 m in the tunnel and the gallery, and 1 m by 1 m in the FEB. A 4 m by 4 m grid of floor-pads provides direct connections to the EMC-mesh in the klystron gallery and FEB. The EMC mesh is also connected to the other grounding systems [124].
Neutron instruments have different grounding requirements, and have adopted a star-ground topology that potentially allows better control of EMI, which requires a careful cable routing and reliable connections to the BN. This is managed by making of each instrument a ground zone with only one connection to the buildings PB-network.
1.8.5. Accelerator test stands
Many accelerator components are not available off-the-shelf, and are developed or adapted by the manufacturers to suit the specific requirements. The cryomodules are particularly critical and need to be acceptance tested before installation in the tunnel. A total of 120 elliptical cavities are grouped in 30 cryomodules that each hold four cavities. Another 26 superconducting spoke cavities are grouped in 13 cryomodules that each hold two cavities.
Elliptical cryomodules undergo their SAT at the ESS accelerator test stand TS2 in Lund. They come in two variants, medium-β and high-β, with geometrical parameters that make them interchangeable, from an external testing perspective. TS2, with its waveguide installation and other infrastructure, can accommodate both medium-β and high-β cryomodules. Spoke cavity cryomodules are tested at another test stand called FREIA, at the university of Uppsala [125].
The main purpose of the elliptical cavity cryomodule SAT is to verify the proper functioning of the series production cryomodules, to assess their performances and to allow re-conditioning of some of their RF equipment. Thus, both cryogenic and RF operability are evaluated and key parameters of the cryomodules subsystems, such as heat loads of the cryogenic components and resonant efficiencies of the RF components are measured. Besides these performance tests, a number of preparatory operations are carried out on the cryomodules.
The test programme starts with cryomodule reception on-site, and an initial verification of the cryomodule integrity after transport. After successful reception, the cryomodule is unloaded from the transport vehicle in a loading area next to the test stand. The loading area, but not the test stand, is equipped with an overhead crane adapted to careful handling of the cryomodules. Upon unloading and unpacking, the cryomodule is installed on the test bench in the bunker. Initial cryomodule testing comprises checking electrical connections, functional verification of instrumentation, and verification of the integrity and cleanliness of the cryogenic circuits.
The integrity of the RF system is tested by applying a very low power RF signal. If re-conditioning of the main RF power coupler is necessary, it is initiated while the cryomodule is still at room temperature and repeated at the final cryogenic operating temperature. Quantitative acceptance tests are performed once the cryomodule is cold. The main parameters to be determined are Q0, Qext, Eacc, Lorentz force detuning, and cryogenic heat loads. The verification of the detuning compensation system includes observing the action of the piezo tuners on the cavity, observing their ability to adjust the cavity frequency and to counter excitation of mechanical modes, ready for use in the feed-forward system.
The test bunker and its metre-thick, magnetite-loaded concrete walls reduce radiation levels outside the bunker to an acceptable level. X-ray radiation produced during the tests originates in field emissions, which are in turn caused by the RF power fed to the cavities reacting to the presence of imperfections in and on the niobium cavity walls. X-ray emissions are measured during high power testing, both inside and outside the bunker. The levels inside the bunker give additional information concerning the quality of the resonant cavities. Measurements outside the bunker are used by the personnel protection system, guaranteeing safe operation where human presence is unavoidable.
The cryomodule tests at cryogenic temperatures require a constant flow of cold helium in order to extract the heat flowing into the cavities and to maintain the cryomodules at their operating temperature. The test stand is therefore connected to a helium cryoplant via a CTL line that spans the 50 m from the test stand to the cold box hall.
The ESS Design: Target
M. Anthony1, E. Pitcher1, L. Coney1, M. Göhran1, J. Haines1, R. Linander1, D. Lyngh1, U. Oden1, K. Batkov1, Y Lee1, L Zanini1, M Kickulies1, Y Bessler2, J Ringnér1, J Jurns1, A Sadeghzadeh1, P Nilsson1, M Olsson3, J-E Presteng3, H Carlsson1, A Polato1, J Harborn1, K Sjögreen1, G Muhrer1, F Sordo4
1 European Spallation Source, Lund, Sweden2 Forschungszentrum Jülich, Jülich, Germany3 Combitech, Linköping, Sweden4 ESS Bilbao, Zamudio, SpainE-mail:
1. Target station
Once at full-power operation, the ESS should deliver the brightest neutron beams in the world. At the heart of ESS is the target station, which uses energetic protons delivered by the linear accelerator to liberate neutrons from tungsten nuclei via nuclear spallation reactions. A small fraction of these liberated neutrons are slowed down to speeds useful for studying the structural properties of matter using water and liquid hydrogen as moderating media. Of those neutrons that are slowed to useful speeds, a fraction leak from the moderators in a direction where they enter neutron guides that deliver them to neutron scattering instruments. This process defines the high-level functions of the target station:
- generate neutrons via the spallation process,
- slow the neutrons to speeds useful for neutron scattering,
- direct neutrons to neutron scattering instruments,
- operate safely with high reliability and availability.
Several unique features of the ESS target station distinguish it from its predecessors. These include a rotating spallation target, helium as the target primary coolant, flat moderators, proton beam expansion using raster magnets, neutron beam ports that allow viewing of either the upper or lower moderator, a doubling of the number of neutron beam ports over the conventional number, among other innovations. Here we describe the salient features of the target station, which include the spallation target, the moderator-reflector system including neutron beam extraction, remote handling systems, and the safety approach and features.
The ESS benefits greatly from the experience of a number of spallation sources that have come before it. Table 41 compares some performance parameters and design features of past and existing spallation sources with those of ESS. The ESS design power level is 2.5 times greater than the design value of the most powerful spallation source in operation today, the SNS at ORNL. For the ESS, the design value for the amount of beam energy per pulse is 4.5 times greater than that of the Japan Spallation Neutron Source at the Japan Proton Accelerator Research Complex (J-PARC MLF). Tungsten has longed served as the spallation target material of choice due to its high neutron production density, high melting temperature, good thermal conductivity, and cost. However, its brittle nature introduces certain challenges that must be taken into account in the design.
Table 41. Design features and performance parameters of past and present spallation sources for neutron scattering. Specified values are those achieved to date, while design values are shown in brackets.
| Facility (lab) | Beam | Pulse | Target | Coolant | Moderator |
|---|---|---|---|---|---|
| power | energy | ||||
| MW | kJ | ||||
| KENS (KEK) | 0.0024 | 0.12 | U, W | H2O | CH2, solid CH4, H2O |
| IPNS (ANL) | 0.0075 | 0.25 | U | H2O | CH2, solid CH4, H2O |
| ISIS TS2 (RAL) | 0.05 | 5 | W | D2O | Solid CH4, liquid H2 |
| LANSCE (LANL) | 0.1 | 5 | W | H2O | H2O, liquid H2 |
| CSNS | [0.1] | [6] | W | D2O | |
| ISIS (RAL) | 0.16 | 3.2 | U, Ta, W | D2O | H2O, liquid CH4, liquid H2 |
| SINQ (PSI) | 1.2 | — | Zr, Pb, PbBi | D2O | D2O, liquid D2 |
| SNS (ORNL) | 1.4 [2] | 23 [33] | Hg | — | H2O, liquid H2 |
| JSNS (J-PARC MLF) | 0.5 [2] | 20 [80] | Hg | — | H2O, liquid H2 |
| ESS | [5] | [357] | W | He | H2O, liquid H2 |
Table 41 also shows the moderating media used at other spallation sources. One of the most important properties of moderating media is the hydrogen atom density. Polyethene (CH2), with an H atom density near that of water, is easy to manufacture and does not require a vessel to hold it. Methane (CH4) has one of the highest H atom density of any substance (about 5% more than water), and has excellent low-energy transfer modes in its liquid and solid states, which gives it unparalleled performance at low temperature. However, hydrocarbon sensitivity to radiation damage limits its service to low-power sources. This leaves only water and liquid hydrogen (and their deuterated variants) as options for high-power sources. Water operating at 20 °C produces a neutron spectrum that peaks around 25 meV, while the spectrum from liquid hydrogen operating at 20 K peaks near 5 meV. Innovative low-dimensional butterfly moderators are used. There are two moderator positions, one above and one below the target. Each moderator can be viewed by any of 44 neutron beam lines whose average angular spacing is  . At each extraction angle, two ports are provided so that the instrument has the choice of looking at either the upper or the lower moderator. Bi-spectral neutron guides [126] are used to deliver neutron beams from the moderators to the neutron scattering instruments.
1.1. Layout
The target station (see figure 68) occupies the target building, which is a large structure of about 130 m in length and 22 m in width. The proton beam enters the target building from the left (see figure 67), passing through the proton beam transport hall and into the target monolith. The monolith is a large structure (11 m diameter by 6 m tall) consisting mostly of 3000 tons of steel shielding. Embedded within the monolith there is the vessel containing the major components involved in the neutron production and their delivery to the instruments: the spallation target, the moderator-reflector system, the PBW, and instrumentation. Some fraction of the proton beam power goes into liberating neutrons from tungsten nuclei, but most of the 5 MW of beam power, around 88%, is deposited as heat in the target and surrounding structures. This heat is removed by the cooling systems whose principal components are located in utility rooms downstream of the monolith. The target building also contains the active cells where the highly activated components from the monolith are moved via the high bay once they reach their end service. Components are stored for a short period (several months to several tens of months) and then dismantled and packaged for transport to an approved off-site disposal facility.

Figure 67. Cutaway view of the target building, showing the physical locations of many systems constituting the target station.
Download figure:
Standard image High-resolution image
Figure 68. A cutaway view of the monolith, showing components in the monolith and the connections cell above it.
Download figure:
Standard image High-resolution image
Figure 69. Beam envelopes in the x- and y-planes showing the beam waists at the crossover. Shown are the maximum deflections of the beam centroid (magenta line) by the raster system, and the 10  envelope (blue lines).
Download figure:
Standard image High-resolution image1.2. Neutron efficiency and energy balance
For every 2 GeV proton incident on the tungsten target, approximately 56 neutrons are liberated via nuclear spallation and subsequent reactions. Of these, a small fraction enters the cold and thermal moderators, where some are down-scattered to reach thermal equilibrium with the moderating media before leaving the moderator. A small fraction of those that escape after thermalisation are headed in a direction where they enter one of the neutron guides that constitute the start of the neutron scattering instruments. The entire process is extremely inefficient. Out of the 56 neutrons created by each proton, only around 10−4 enters one of the neutron guides with a proper direction and energy to be useful for neutron scattering. The remaining neutrons either activate components within the target monolith and instruments, contribute to personnel dose in the target building and instrument halls, or become a source of background to the instruments. This low efficiency is a prime motivator behind the efforts to seek further optimisation of the target-moderator-reflector systems.
1.3. Accelerator-target interface
The accelerator delivers an average beam power of 5 MW in the form of 357 kJ pulses at 14 Hz repetition rate. In order to keep the pulse temperature rise in the tungsten within tolerances, the beam must be expanded before it hits the target. This is accomplished using fast-switching magnets to raster the beam within a specified footprint on the rotating target. Downstream of the last optical element and 22 m upstream of the target, the transport includes a crossover point where the beam achieves a waist in both transverse planes.
The size of the beam footprint on the target is a compromise between a tolerable pulse temperature rise in the tungsten and the neutronics performance. The beam expansion system delivers a 60 mm tall by 160 mm wide rectangular footprint containing 99% of the proton beam, with a peak current density of 53 μA cm−2 on target under nominal beam conditions. The beam current density spatial distribution for this nominal beam is shown in figure 71. To accommodate departures from an ideal tune and uncertainty in the measured beam profile, the target is designed to accommodate a maximum beam current density of 71 μA cm−2. At 53 μA cm−2 the adiabatic heating of the tungsten in the peak heated region is 100 °C over the 2.86 ms proton beam pulse duration. This sharp temperature rise leads to cyclic stresses in the tungsten approaching but not exceeding 50 MPa. The tungsten will be subjected to as many as 70 million thermal cycles per year with a design lifetime of five years.
1.4. Target
The concept of a rotating target for high-power SNS application was first proposed for the German SNQ project of the 1980s [127]. The main advantages of a rotating target elucidated then hold true today: long service life and distribution of decay heat over a larger volume which offers the ability to remove decay heat passively. For sources that use a stationary target, the target (or the target container for liquid metal targets) must normally be changed more frequently than any other component. For the ESS target, which is composed of 36 sectors, the target wheel is expected to last at least five years. This makes the moderator-reflectors, which are located just above and below the target in the peak neutron flux position, and the PBW the shortest-lived components. These components are expected to be replaced every six to twelve months.
Helium, operating at 10 bar pressure and flowing at 3 kg s−1, carries away the 3 MW of heat deposited in the target by the 5 MW proton beam. The choice of helium is based on its benign interaction with tungsten at elevated temperature, whereas water vapour interacts with tungsten above 700 °C [128]. While the use of helium as the target primary coolant does not preclude the possibility of tungsten-steam interaction under all plausible accident scenarios, it does reduce the possibility and therefore contributes to safety by design. In addition, helium is expected to operate much more cleanly than water. Proton-induced reactions in water lead to the production of problematic radioactive species in the water (Be-7 and N-16) that would likely increase gamma dose rates in the connections cell above the target monolith, higher dose rates to personnel servicing the loop components, and add to the radioactive waste stream from target operation. By contrast, helium coolant should operate cleanly with low radioactive inventory when operated with a properly designed purification system. The main drawbacks of using Helium as coolant are a lower wall heat transfer coefficient in convective cooling, higher operation temperature and increased complexity of confinement and maintenance.
1.5. Moderator-reflector
The flat moderator design developed for ESS produces a cold source brightness that is three times greater, on a per-proton basis, than those employed at existing spallation sources [129]. The unique butterfly geometry produces near uniform thermal and cold source brightness on all 44 beam lines. The engineering design employs a unique wister design for inserting and extracting the moderators from their operating positions above and below the target in a manner that does not require the target to be extracted in order to replace the moderators. This is an important feature as the target is expected to have a service life five times greater than the moderator-reflectors.
The calculated heat load in the liquid hydrogen and associated cold aluminium containment is 20 kW. In order to limit the temperature rise in the cold moderators to 3 K (from 17 to 20 K), the design flow rate of the liquid hydrogen is 1 kg s−1. A large hydrogen loop and secondary helium cryoplant are needed to deal with the unprecedented heat load.
1.6. Monolith
In addition to the target and moderator-reflectors, a number of other systems reside in the high radiation field. These systems reside in 6 m diameter by 5 m tall a monolith vessel, whose atmosphere during operation is either high vacuum or helium at a pressure slightly below atmospheric. High-vacuum operation would negate the need for a PBW, which offers a number of potential benefits from an operations perspective: lower annual operating cost of 1 M€(two windows at 500 k€each), up to 1% improved neutronic performance, lower scattered beam (and therefore heat load and radiation damage) on components between the window and the target, and a cleaner image for the beam imaging diagnostic, to name a few. Still, a PBW will be designed and built, and be ready to install should an unanticipated issue be encountered when operating the monolith vessel under vacuum.
A proton BI plug is located between the PBW and the target. It holds a variety of beam diagnostics that measure the characteristics of the beam impinging on the target, while a control system confirms that the beam characteristics are within the operational limits. A target diagnostic plug is situated on the downstream end of the target wheel, which provides a means of measuring properties of the target wheel.
Neutron beam extraction is accomplished through holes set in the neutron beam port blocks. The port blocks are welded to the monolith vessel and form part of the monolithic atmospheric boundary. A unique feature of the port blocks is the provision of neutron beam holes at two elevations for each of the 44 beam extraction angles. This allows any instrument to view either the upper or the lower moderator, independently of the beam line on which it is situated. If an instrument uses a particular beam hole, it will be filled with a neutron guide to transport cold and thermal neutrons, starting at 2 m from the monolith centre and extending to the monolith outer radius at 5.5 m. To realise the full benefit of the flat moderators, the neutron beam holes and the neutron guides occupying them must be aligned vertically to the moderators to within 1 mm.
1.7. Handling and logistics
During operation, the components within one to two metres of the point where the beam impinges the target become highly activated. The target wheel and the moderator-reflector plug are the most activated. Simulations show that the dose measured at 30 cm in air from the target after two weeks of cool-down is in the order of 1 kSv h−1. The concept for replacing these highly activated components is incorporated into the design. When a component reaches the end of its service life, workers enter the connections cell (the room directly above the monolith, see figure 67) and disconnect piping and electrical services of in-monolith components at their connection points on top of the monolith. Using the 95-ton High Bay crane, the large T-beam blocks that constitute the portion of the high bay floor above the connections cell are lifted off and set aside. The in-monolith shield blocks that must be removed to access the end-of-life component are lifted off and set aside. Then a shielded transfer cask is lowered into place on top of the monolith and the activated component is lifted into the transfer cask. The transfer cask is moved within the high bay from the connections cell to the top of the active cells, where it is placed over a floor valve. The floor valve is opened and the activated component is lowered out of the transfer cask and into the process cell, which is one of two rooms constituting the active cells. The active cells include provisions for interim storage, dismantling, and packaging of activated components for shipment to waste repositories.
1.8. Safety
Safety is paramount in the design of the target station. Radioactive materials are produced as a byproduct of the spallation process and by the radiative capture of liberated neutrons in the surrounding structures. Most of the radioactivity is confined into the tungsten within the target and the uncontrolled dispersal of this radionuclide inventory would result in a significant radiation dose consequence to workers and the public. Therefore, an overarching design goal for the target station assures that none of the tungsten is dispersed during the postulated accidents. If a source of energy were to heat the tungsten to an unsafe temperature, the tungsten may oxidise and the oxide vapour could readily disperse. The onset for runaway oxidation of tungsten in the presence of steam occurs between 700 °C and 800 °C [128]. Thus the radionuclide inventory in the tungsten remain substantially intact as long as the tungsten temperature stays below 700 °C.
There are three sources of energy that can heat the tungsten during an off-normal event: the 5 MW proton beam, the liquid hydrogen in the cold moderators located next to the rotating target and the residual decay heat within the tungsten. A highly reliable target safety system (TSS) protects the target from most off-normal events that can lead to unsafe beam-induced heating. A detailed analysis of tungsten heating due to a release of the liquid hydrogen from the cold moderators shows the tungsten remains within a safe range. The radioactive inventory within the ESS target produces 32 kW of decay heat.
Tungsten-187, which has a 24 h half-life, accounts for 40% of the decay heat. Most of the other isotopes that have larger contributions to the decay heat have even shorter half-lives. This means that after about 7–10 d the system is in thermal equilibrium. A prime motivation for employing a rotating target at ESS is the distribution of this decay heat over a much larger volume (a factor of 36 for the ESS design) than would be the case for a stationary target. The 2.5 m diameter target wheel has a large surface area that radiates the decay heat to surrounding structures. Calculations indicate the ESS target design is able to transfer decay heat passively, relying solely on conduction and radiation, with the tungsten remaining in a safe temperature range.
A hypothetical scenario that involves failure of the moderator system that contains the hydrogen, at the same time as a failure of the monolith confinement barrier with subsequent ingress of air, could potentially evolve into a situation where there would be a flammable mixture of the boiled-off hydrogen and oxygen. All identified potential scenarios that may lead to overheating of the target have been analysed and mitigations have been implemented where necessary.
Safe operation is guaranteed through a rigorous hazards analysis process where potential radiological consequences of off-normal events are qualitatively assessed. Those postulated events with unacceptable consequences are identified as bounding events, which undergo more detailed quantitative analysis. Structures, systems, components (SSC), procedures that are credited with reducing the probability of an event occurring or mitigating its radiological consequence, are deemed important to safety. Quality classes then apply to these SSC that guarantee these elements meet strict standards in their manufacture, installation, and testing for service. In addition, the defense in depth principle (see chapter 4, Integrated Control System) is applied to assure diversity and redundancy in the systems employed to assure safe operation of the target station.
2. Target system
2.1. The worlds highest power spallation target
The target system includes the spallation material and the primary cooling system of the spallation material. The design is based on a helium cooled rotating tungsten target. The essential design requirement is to safely generate a high flux neutron beam based on a 5 MW, long pulse, proton beam. Safely considers both radiation protection to public and workers, and availability of neutrons to the scientific instruments.
The tungsten is placed in the target wheel, which is attached to the target shaft and target drive unit as shown in figure 71. Only the drive unit supports the target wheel and Shaft. The 5 m long shaft provides the required steel block shielding.
The 2.6 m wide target wheel is slowly rotating at about 24 rpm which is synchronised with the 14 Hz proton beam. The outer diameter of the target wheel component is 2.6 m. The radius of the outermost tungsten bricks is located at 1.25 m, which relates to the diameter of 2.5 m mentioned above. In full operation at 5 MW, the temperature in the tungsten increases 100 °C during the 2.86 ms long proton beam pulse. The helium flow in the target wheel cools the spallation material until the next pulse hits the sector again. The peak temperature in the tungsten for normal operation conditions is calculated to be 430 °C and 90 °C on the flat surface of the Wheel. On the rim of the wheel, where the proton beam hits, the temperature is around 170 °C.
The target wheel is cooled by a 3 kg s−1 helium flow with 1.0 MPa pressure. The cooling system includes filtering and purification of the helium to reduce radiological contamination of the cooling system and to prevent corrosion of the tungsten surface. The helium cooling system is connected to the secondary water-cooling system. The proton beam power is 5 MW and 60% of the energy is deposited to the target system. The cooling capacity is balanced to reduce the temperature in the helium from 240 °C, coming from the target wheel, to 40 °C reentering the target wheel.
2.2. Spallation material
In order to maximise the neutron yield for a given proton beam energy, it is required to keep the spallation volume of the target as small as possible. This requirement is satisfied by choosing the target material that has a high atomic number with a high mass density. At ESS, pure tungsten has been selected as the spallation target material. Compared to other tungsten alloys such as densimet 18 and tungsten with 10% rhenium impurity, the pure tungsten has better residual ductilities under neutron irradiations showing the lowest degree of irradiation-induced microstructural disintegration. The higher thermal conductivity of the pure tungsten than those of the compared tungsten and tantalum based alloys results in smaller temperature gradients within the spallation volume. Specifically, rolled and annealed tungsten is used for the target wheel. It shows a high mass density and superior mechanical strength compared to sinterred and HIP'ed and forged tungsten.
Tungsten blocks do not play a structural role in the target wheel. Nevertheless, it must retain structural integrity over the lifetime of the target to avoid the formation of a anomalous hot spots in the cooling channels. In order to better understand the mechanical failure criteria under periodic mechanical loads, stress-controlled fatigue tests in a tensile regime with a runout limit of  cycles have been conducted. The fatigue limits depend on the degree of surface roughness. The unpolished specimens showed a fatigue limit of 150 MPa, whereas the polished one showed 237.5 MPa at 25 °C. It is therefore important to pay attention to the surface treatment of the tungsten blocks, in order to reduce the risk of having micro-cracks on the surface.
Literature on the mechanical properties of irradiated tungsten is scarce. For the test carried out at temperatures up to 500 °C, the irradiated tungsten specimens fail in a brittle regime even at low radiation damage of 0.1 dpa. The yield stress of irradiated tungsten with unknown production route can be as low as 60 MPa at a low neutron fluence of  .
.
In order to understand the mechanical behaviour of tungsten under proton irradiation, a post irradiation examination (PIE) was performed on the tensile and bending test specimens. The irradiation of six bending test specimens up to 2.4 dpa shows that all the specimens failed in a brittle regime at temperatures of 350 °C, 400 °C and 450 °C, and the maximum stress is about 50% of the yield stress of unirradiated reference materials. Tests have been also carried out to yield more information about mechanical and thermal properties of irradiated tungsten: four-point bend tests on low dose (up to 3 dpa displacement dose by protons and fast neutrons) miniature specimens. All the bend bars broke in linear regime, showing no sign of ductility. The ultimate tensile stress got reduced by half compared to the non irradiated samples.
It is also a concern that the radiation induced degradation of thermal conductivity. It has been estimated about 20% loss of thermal conductivity in tungsten after 0.1 dpa of radiation damage. At the time of writing, a series of PIE tests are planned to study the radiation impact on thermal conductivity, using the STIP-V specimens and the specimens irradiated by uranium beam at GSI.
In the presence of a small fraction of oxygen impurity in the helium coolant, the tungsten block getd oxidised at high temperatures above 500 °C. The oxidation characteristics of hot rolled tungsten for the temperature range from 400 °C up to 900 °C have been investigated. The test results show that even the small oxygen impurity 5 ppm in the 'pure' helium and argon gas led to oxidation of tungsten already at 500 °C and above within 2 h of exposure. For the higher oxygen contents of 0.5% in 'pure' helium, the oxidation of the tungsten surface has been observed already at 422 °C. Given that the target operates for five years, it is reasonable to assume a temporary oxygen ingression into the helium loop and the oxidation of the tungsten surface if the tungsten surface temperature exceeds 500 °C. As the interaction of the oxidised tungsten surface layer with the pulsed proton beam is not known, it is advised to keep the operational temperature below 500 °C avoiding oxidation.
Oxidation resistant AlTiN coating of the tungsten bricks is not applied because long term pulsed proton beam impact of the coating material is not known.
In case of loss of coolant accident (LOCA) with the ingression of air into the spallation volume, the decay heat must be removed such that the tungsten temperature is kept below 700 °C. Above 700 °C, tungsten oxide may become volatile in the presence of water vapour. Furthermore, tungsten oxidation can generate exothermic heat, which is enough to heat up the tungsten blocks beyond the point of volatilisation. This might pose a critical case from a public safety point of view. In an accidental case where tungsten is exposed to steam at high temperatures, tungsten reacts with steam to generate hydrogen, and the hydrogen concentration must be maintained below explosive levels. It is important to keep the tungsten temperature below 700 °C in order to minimise the risk of hydrogen explosion due to tungsten oxidation.
2.3. Requirements—materials viewpoint
Due to radiation hardening, the tungsten operates in a brittle regime shortly after a month of 5 MW beam operation on target, as the ductile brittle transition temperature (DBTT) of tungsten is above 500 °C, which is higher than the designed operation temperature of target. In order to avoid crack initiation from the surface irregularity, the surface roughness of the tungsten block shall be smaller than 10 μm. The post-pulse maximum stress in the tungsten shall be lower than 100 MPa, which is two thirds of the fatigue limit of the unpolished tensile specimen. The post pulse peak stress amplitude shall be lower than 50 MPa, which is a third of the fatigue amplitude of the unpolished tensile specimen.
2.4. Vessel material—DPA and lifetime
Solution annealed 316L type stainless steel serves as the baseline target vessel materials. The 316L is one of the most widely used structural materials in existing SNS and in nuclear installations. Among three different grades of 316L stainless steel, the EN1.4432 with enhanced Mo contents for better corrosion resistance is selected.
Ferritic/Martensitic steels are less desirable because of the relatively low operation temperature of the shroud, as the DBTT may increase progressively with radiation damage. Indeed, the ferritic/martensitic steels irradiated at LANSCE with the irradiation temperature below 164 °C showed prompt necking at less than 2% plastic strain at the dpa value of as low as 0.5.
Several kinds of austenitic steels from Europe, Japan and the USA have been irradiated to a maximum dose of 17.3 dpa and a sample of the specimens have been tested. After irradiation at temperatures below 350 °C, the yield stress and the ultimate tensile strength increase, while the uniform elongation or strain to necking and total elongation decrease with irradiation dose. It has been observed that the steels lose their work hardening capability after irradiation due to irradiation-induced hardening. The total elongation remains above 5% up to 17.3 dpa, indicating that the steels still have relatively good ductility.
The tensile samples taken from the beam entrance region of the target vessel at SNS have been tested after the service lifetime of the first and second target. The beam entrance window (BEW) is made of 316L and the dose range of the tensile samples are ranging from 3 to 7 dpa. It has been observed that 316L retains more than 10% of total elongation and fractures in a ductile manor after irradiation to approximately 67 dpa in the mixed proton/neutron radiation environment at the SNS. At 5 MW operation, the radiation damage in the target wheel BEW is 1.2 dpa per year. If the lifetime of 316L under proton/neutron irradiation should follow the operational experience of the SNS target, the target vessel at ESS should be able to withstand the radiation damage up to six years until it reaches 7.2 dpa.
2.5. Characteristics of the proton beam pulse
The main function of the target system is to provide a structurally and thermally stable framework for the spallation material. The rotating target concept is primarily driven by the need to distribute the impact of the proton beam along the periphery of the target.
The rotating target wheel is a way to accommodate high beam current density, since each part of the wheel, or sector is hit once per revolution only. The helium cooling system is designed to keep temperature within safe operational limits over one revolution of the wheel.
The proton beam footprint at full operational power projected on BEW (the rim of the target wheel) has the shape shown in figure 70, with average heat deposition values listed in table 42.

Figure 70. Beam current density distribution on the target for a nominal beam.
Download figure:
Standard image High-resolution image
Figure 71. Target wheel drive and shaft in the monolith (shielding blocks excluded).
Download figure:
Standard image High-resolution imageTable 42. Average proton beam characteristics focused on heat deposition. The data is averaged using the s duty factor of 0.04—pulse length times number of pulses per unit time.
| Parameter | Units | Value |
|---|---|---|
| Heat deposited by each beam pulse | kJ | 357 |
| Pulse frequency | Hz | 14 |
| Beam power | MW | 5 |
| Power deposited in tungsten | MW | 2.8 |
| Power deposited in shroud | kW | 36 |
| Power deposited in beam entrance window | kW | 10 |
2.6. Target vessel
The purpose of the target vessel is to provide an enclosure around spallation material keeping structure and ensuring cooling with summary coolant data listed in table 43.
Table 43. Basic helium coolant data.
| Parameter | Units | Value |
|---|---|---|
| Nominal massflow | kg s−1 | 3 |
| Inlet temperature | °C | 40 |
| Outlet temperature | °C | 240 |
| Pressure drop, entire system | bar | 0.6 |
| Coolant pressure | bar(a) | 10 |
The target vessel is exposed to heavy irradiation, limiting the lifetime of the material. Sources of radiation-induced damage to target vessel are [130]:
- Collisions: energetic particles collide with nuclei and transmits parts of its incoming energy, in its turn colliding with other atoms and producing a displacement cascade.
- Nuclear reactions can take place between incident high energetic particles and atoms.
- Gas production: high energetic particle irradiation can produce large amounts of hydrogen or helium which may cause swelling and cracking of material.
Since the shroud is made of annealed stainless steel (316 L) the effect of radiation damage becomes a gradual loss of ductility in the material, especially a notable loss of strain at yield stress. This effect is acknowledged when designing structures with high secondary stresses.
2.7. Central timing system
The rotating target wheel concept introduces the need to synchronise the rotation of target wheel with Accelerator and Instruments. At the ESS, the synchronisation of systems will be achieved through the ESS central timing system, as described briefly in table 44. The central timing system is a MO generating a 352.21 MHz frequency pulse. The pulse is synchronised with the accelerator but is in addition connected to an absolute synchronisation signal through the GPS.
Table 44. Central timing system.
| Parameter | Units | Value |
|---|---|---|
| Bunch frequency | MHz | 352.21 |
| Bunches per event clock period | 4 | |
| Event clock frequency | MHz | 88.053 |
| Event clock period | ns | 11.357 |
| Event clock ticks per macropulse start | 6289464 | |
| Beam macropulse repetition rate | Hz | 14 |
| Event clock ticks per macropulse length | 251830 | |
| Beam macropulse full length | ms | 2.86 |
The design of the timing system allows for adjustment of phase between individual components of the synchronisation chain. It is a necessary feature to ensure synchronised operation.
2.8. Phase synchronisation, drive system, commutation and modal characteristics
The target wheel design is based on the physical size of the beam footprint and the frequency of the beam pulse, with parameters listed in table 45.
Table 45. Target wheel parameters.
| Parameter | Units | Value |
|---|---|---|
| Wheel diameter | m | 2.5 |
| Number of sectors | 36 | |
| Sector periphery | m | 0.218 |
| Rotational speed | rpm | 23.3 |
The target wheel speed regulator compares a discrete signal corresponding to a sector passing in front of the proton beam to the beam macropulse frequency and regulates it based on the allowable phase error.
The drive system is based on a brushless synchronous permanent magnet frameless torque motor. It is built into the drive unit and cooled by convection and contact with surrounding structures. Commutation of the motor is done through the measuring system.
Smooth and undisturbed movement of the rotor is of vital importance to the performance of the target design. Therefore, modal response of the rotor to frequencies from commutation and regulation as well as unbalance-excited vibrations have been studied.
2.9. Impact of the neutron irradiation on the target wheel driving system
Neutron irradiation proposes some unique difficulties for the designer. In the design of the ESS target wheel drive system, adverse effects of the neutron irradiation must be considered. In the selection of components, semiconductors have been avoided as far as possible. A map of the fast neutron flux is shown in figure 72, with flux and fluency values listed in table 46.

Figure 72. Fast neutron mapping in the drive unit. (Courtesy of Tomás Mora Aglio, ESS-Bilbao, 2015.)
Download figure:
Standard image High-resolution imageTable 46. Fast neutron flux and fluence on top of the monolith.
| Parameter | Units | Value |
|---|---|---|
| Approximate neutron flux in drive unit position | n (cm2 s)−1 | 104–105 |
| Operating time per year | h | 5000 |
| Fast neutron fluence, per year | n cm−2 |

|
| Total fluence over 40 years of operation | n cm−2 |

|
Fast neutrons (above 1 MeV) mainly damage the inner structure of (semiconductor) materials by scattering the atoms out of position in the lattice. Scattered atoms leave groups of vacancies inside the material. This creates many electron-hole pairs and can increase or decrease charge carrier density in the material.
Slow Neutrons with energy below 0, 1 MeV can be easily captured by nuclei and consequently perform transmutation of these atoms. Newly produced atoms have different number of valence electrons, which appears as additional doping in semiconductors.
Transmutation cannot be retrieved by any process. It is only possible to minimise the flux of neutrons by shielding of the equipment by materials with high cross-section for neutron capture, such as cadmium or boron.
Gamma radiation in nuclear devices takes place as well, but it causes particularly internal heating of the material with negligible permanent effect.
Demagnetisation of permanent magnets is a known effect of fast neutron irradiation that also needs to be taken into account [131, 132].
The penetrating effect of neutrons is in fact the phenomenon giving birth to the idea of a large scale spallation source. However, at the same time the necessity to protect equipment from radiation calls for heavy shielding. Especially important is to avoid free line of sight from the neutron source. Therefore the shaft has been designed with a series of steps, serving to trap neutrons from streaming along shaft into surrounding areas.
2.10. Cooling the spallation material
2.10.1. Selection of the main circulator
Based on the requirements for flow, temperatures, operation pressure and total pressure drop in the system, an industrial process gas blower or turbo compressor has been identified as the two preferred machine types. The helium operation pressure is set to 3.5 bar with corresponding volume flow of up to 6 m3 s−1, thus available blowers or compressors on the market is highly limited.
2.10.2. Selection of flow and temperatures of the cooling helium
To remove 3 MW of heat and keep the tungsten temperature well below the limit of 500 °C, a flow of 2–5 kg s−1 is needed. The removed heat power is given by the following equation:

where Q is the mass flow of helium, Cp is the heat capacity for helium, Tout temperature of helium leaving the target and Tin temperature of helium entering the target. If Q is set to 2 kg s−1 and Tin = 40 °C, The outlet temperature is be too high to secure a tungsten temperature below the critical temperature. Whereas, if Q is set to 3 kg s−1 and Tin = 40 °C, The outlet temperature is around 200 °C which is a good compromise. Note also that the inlet temperature cannot be much lower since it would not be cost effective.
2.11. Helium chemical purification
During operation, the target coolant helium gets contaminated by chemical impurities. The most important of these are the radioactive spallation products, which are released from the tungsten in the target wheel. As the system is pressurised with high quality helium, the amounts of air components is very limited in the impurities. Instead some typical examples of species are hydrogen and iodine, which are generated in the spallation reaction. In order to minimise the radiological impact of small anticipated leaks during operation, of possible accidents and of releases during.
A by-pass of a few g s−1 of the circulated target helium coolant flow of 3 kg s−1, is led through the chemical purification system. The purification system consists of parallel ambient and heated getters, operating at the cooling system pressure. The getters are off-the-shelf products, tuned to each remove ranges of species with specific chemical properties. The purification system is scalable, so that modules can be added or removed depending on the requirements in terms of both capacity and removal of specific species. Getters do not remove noble gases. However, detailed calculations of the production, release and dose from active noble gases show that the impact is far from the allowable limits.
A major benefit with getters, compared to alternative methods, such as adsorption or condensation, is that it the impurities are chemically bonded to the getter material. This minimises risks in operation and facilitates the waste transport. As the getters are not regenerated, the whole getter vessels will be transported to waste during normal annual maintenance periods. The solution is based on the fact that the produced amounts of impurities are small.
2.12. Target helium experiments at LTH (ETHEL)
For the purpose of investigating various aspects of helium cooling, an experimental system has been constructed at Lund University (LTH), Department of Energy Sciences. In this facility, a helium flow of about 3 g s−1 is circulated in a closed loop by a booster compressor. The loop comprises an electrical pre-heater, a heat exchanger cooled by water, filters, a range of instruments and a special designed test vessel of stainless steel. The vessel has quartz windows to allow laser measurements and is designed for 10 bar and above 400 °C.
One series of tests has been conducted to investigate the erosion of the oxidised sample surface by the impinging flow under the same conditions as in the ESS target. This experiment simulates the target operation environment, where pre-heated pure helium at about 200 °C impinges on and cools the tungsten that is volumetrically heated by the proton beam. For this, the test vessel is equipped with a flow tube with the internal rectangular cross section 2 mm × 10 mm. The flat and narrow cross section is typical for the cooling flow in the ESS-target. The flow profile is well developed when it leaves the tube and forms a perpendicular jet onto an easily exchangeable material sample. Under the sample there is a ceramic heater, which heats the sample to about 400 °C. The samples are investigated with scanning electron microscopy (SEM) at different stages sequentially, before exposure to the test and after several hours of test in steps. The consecutive SEM pictures at each position of the sample surface are compared visually and with simple image analysis techniques. It is concluded that even with samples with very conservative pre-oxidation before the flow tests, obtained at temperatures of 600 °C and oxygen concentration of 0.5%, conditions that will not be sustained in the ESS target, the erosion is very limited. The helium flow does not cause a significant source of dust particles. There were some visible changes to the surface after the first hours of flow test, but the changes do not increase after more test hours. It appears that the flow removes some lose oxide and after that the changes stagnate.
2.13. Manufacturing tests
The chosen design, a rotating target wheel, implies a number of design challenges. The tight distance to the moderator stresses the flatness tolerances to the wheel, and the high helium pressure of 1.0 MPa, confined in a flat vessel (the wheel), stresses the pressure vessel design.
The wheel is composed of a rim BEW, top and bottom plate and a central piece, as shown in figure 73.

Figure 73. Target wheel.
Download figure:
Standard image High-resolution imageThe wheel is divided into 36 sectors with partition ribs for each sector. Each partition rib is welded to the bottom and top plate enabling a flat vessel design. To minimise the interference of the proton beam, the BEW is just a few millimetres thick and the surface is convex to be able to handle the helium pressure. The central piece distributes the inlet and outlet helium flow and is not complex from a mechanical structure integrity point of view.
The large number of welds during manufacturing of the wheel challenges the flatness tolerances of ±5 mm. High heat-induced stresses can deform the final structure. To secure the manufacturing procedures and later the target system in operation, a number of manufacturing tests are planned.
Preparation for decommissioning of the wheel is a vital aspect during design. To facilitate the decommissioning of the wheel, after five years of operation, the tungsten bricks are placed in cassettes that simplify dismantling of the spallation material during decommissioning. One cassette is placed in each sector. To avoid erosion and dust formation, origin from eventual vibrating tungsten bricks, the top and bottom plate of the cassette has milled cavities with tight tolerances for each tungsten brick. The cassette itself does not contribute to the mechanical integrity. It only secures the placement of the tungsten bricks and the cooling channels between the bricks. A complete manufactured cassette is shown in figure 74.

Figure 74. Cassette.
Download figure:
Standard image High-resolution image3. Neutron source
3.1. Neutronic design
The detailed design of the innovative moderator and reflector system is in many ways groundbreaking, allowing the ESS to deliver an unprecedented level of brightness to the neutron science instruments. This section describes the significant innovations, and how they are implemented and manufactured.
The current ESS neutronics has evolved during the years ending up with an optimised design with an excellent neutronic performance and significantly increased neutron brightness with respect to previous technologies. The expense is to incorporate a complex mechanical design. Thermal and cold neutron moderators are in very close proximity to the target, surrounded by a tightly designed beryllium reflector. The target wheel and moderator plug are shown in figure 75.

Figure 75. Left: target wheel and moderator plug. Right: section view of the moderator and beryllium reflector plug.
Download figure:
Standard image High-resolution imageImplementing complex moderator and reflector shapes with minimal thickness hydrogen and water vessels—to maximise neutron brightness—imposes stringent requirements on the materials used, and the manufacturing process. The components suffer severe irradiation, degrading their strength, their toughness, and their operational lifetime, due to the high beam power and the large flux of spallation neutrons. Highly irradiated components are often replaced, using a handling system that minimises the amount of waste material, and reduces operational risk and operational costs and down time.
The frequent replacement of components provides a future development opportunity, along a path that will result in updated moderator and reflector designs over the lifetime of the facility. The component modularisation allows the possibility to update the designs whenever this is judged necessary.
3.1.1. Low-dimensional moderators
The ESS moderators maximise the neutron brightness—the average flux per unit solid angle at the surface of the moderator—by using the distinctive and novel concept of low-dimensional moderators [129, 133]. Low-dimensional moderators increase the brightness by a factor of two or three by matching neutron cross-sections and mean free path (MFP) lengths in the liquid para-H2 moderator and pre-moderator to the moderator geometry.
Flat moderators are quasi-2D. The height of a flat moderator is reduced with respect to a conventional volume moderator, such as the coupled moderator used at J-PARC, ideally reducing it to a two-dimensional shape. Tube moderators are quasi-1D, removing one more dimension from flat moderators. Physics studies suggest that tube moderators are fundamentally the brightest moderators. Some examples of the application of tube moderators in an ILL-type reactor are discussed in [129]. This flat and tube classification applies to cryogenically cold moderators. However, ESS delivers bi-spectral neutron beams, also implementing a thermal neutron source. It is also advantageous to reduce the dimensions of the thermal moderator, since less beryllium reflector is removed for beam extraction, resulting in a lower brightness penalty.
The brightness distribution from the surface of a volume moderator filled with pure para-H2 is non-uniform [134]. Figure 76 shows the calculated brightness distribution over the emitting surface of a 10 cm tall moderator. Two areas of the moderator have increased brightness—the bottom (target) side of the moderator, and the top (reflector) side—because of the non-uniform source of neutrons, and because of the MFP difference of cold and thermal neutrons in para-H2.

Figure 76. Brightness map of the volume moderator (left), and a 1.5 cm flat moderator (centre), calculated using MCNPX 2.7.0 [135]. The flat moderator has a single brightness hot spot at the centre of the emission surface, resulting in brighter spectra (right). The same colour scale is used for both volume and flat moderators.
Download figure:
Standard image High-resolution imageThe MFP of thermal neutrons in para-H2 is about 1 cm, while the MFP of cold (5 meV) neutrons is about 11 cm. The thermal MFP of 1 cm causes the two hot spots in the volume moderator, at the target and reflector sides: thermal neutrons within about 1 cm of the moderator edges are slowed down to cold energies. The total cross section is reduced by one order of magnitude for cold neutrons in para-H2, making it easier to extract neutrons from the whole volume of the moderator.
A simple model based on this MFP difference reproduces quite well the angular emission of cold neutrons from a pure para-H2 disc-shaped moderator [134]. Thermal neutrons from the water pre-moderator are primarily slowed down to the cold regime by the first collision after entering the para-H2 close to the moderator wall, escaping the moderator volume as cold neutrons with a high probability of no further collision. In practice, the two hot spots become a single hotspot in a flat moderator, with a thickness comparable to the MFP.
3.1.2. Moderator optimisation
Several other design criteria and requirements are incorporated in the flat moderator. The viewed surface of at least 3 cm × 6 cm (height by width) is seen everywhere in the two 120 suites of beam ports. Bi-spectral extraction is possible from all beam ports.
Pre-moderator. Pre-moderators are in wide used at cold neutron sources, plays a crucial role for both cold and thermal moderators by shaping the neutron spectrum from the spallation target and reducing neutron energies from about 1 MeV to thermal values. An extended pre-moderator (water disk) with transverse dimensions practically equal to the beryllium reflector, and a thickness of about 3 cm, gives a substantial gain in both thermal and cold brightness.
Vertical position. Placing the moderators close to the neutron production hot spot is quite important for brightness optimisation, even though many of the neutrons reaching the moderator are scattered by the inner reflector. Proximity is important both vertically (the distance from target to moderator) and horizontally (in the plane parallel to the target), with a brightness slope of as much as 5% per cm in both directions. It is important to take into account that proximity to the neutron source is important but it implies the disadvantage of a larger energy deposition into the moderator that needs to be removed with additional cooling power.
Horizontal position. While the moderator closest to the hot spot is the brightest, bi-spectral extraction is needed for a significant number of instruments. The pancake design incorporates a butterfly thermal moderator above the hot spot, for two reasons:
- (i)the thermal moderator is more compact than the para-H2 moderator, so that both moderators can be placed close enough;
- (ii)the thermal moderator works as a pre-moderator for the cold moderator, compensating for the brightness lost by distancing the cold moderator.
3.1.3. The butterfly moderator
Figure 77 shows the target-moderator-reflector assembly, with thermal layers of water forming X-shaped pre-moderators, placed near the hot spot, viewed by the full  arc of each beam port suite. Two cold moderators are in the shape of a butterfly. The upper cold moderator is 3 cm high, while the lower, which is 6 cm high, is less bright but has a divergence spectrum that is more convenient for some instruments, such as imaging.

Figure 77. MCNPX model of the ESS target-moderator-reflector assembly. Left: side view. Right: top view of the 'butterfly' moderator.
Download figure:
Standard image High-resolution image3.1.4. Brightness and heat load
Figure 78 shows how the cold and thermal brightnesses vary as a function of the moderator height. A 3 cm tall cold moderator is 2.5 times brighter than a 10 cm moderator, viewing  (equivalent to a 12 cm cold moderator viewing
  ). This cold brightness is consistent with the performance of a pancake moderator, while the thermal brightness is a factor of two larger, probably due to the large amount of water on the sides of the tall butterfly moderator.

Figure 78. Integrated brightness as a function of moderator height. Left: cold brightness ( meV). Right: thermal brightness (
 meV).
meV).
Download figure:
Standard image High-resolution imageFigure 79 shows the thermal and cold brightness performance of the butterfly 3 cm top moderator. Spectra are shown for a beam line placed at the maximum cold brightness position, at  with respect to the proton beam. The thermal brightness is maximum at an angle of
  with respect to the proton beam. Calculations are performed with the model of figure 77. Cold and thermal brightnesses for the bottom moderator are factors of 1.60 and 1.45 lower than for the top moderator, respectively. The top moderator has a peak thermal brightness that is, on average, about 10 times brighter than the ILL time average thermal brightness [136]. The cold brightness at 4Å is more than 100 times the ILL brightness. Engineering reality reduces the brightness of the moderators from the MCNPX model values, with a penalty that is independent of the moderator height—both moderators are expected to suffer a loss of about 20%.

Figure 79. Thermal and cold brightness spectra for a 3 cm moderator, compared with ILL [136].
Download figure:
Standard image High-resolution imageThe heat load in the moderator-reflector is critical, in particular for the cryogenic system with liquid hydrogen in the cold moderator vessel and pipes. Calculations with MCNPX generate a total heat load of 7.0 and 10.6 kW in the top and bottom cold moderators, respectively.
3.2. Separating moderated neutrons from undesired radiation
The highly ionising radiation inevitably emitted from the target and moderator components is detrimental to sensitive equipment and materials, and has the potential to severely disturb the scientific instruments and experiments. A bright neutron source is always and inherently associated with the need to shield and attenuate the extremely harsh radiation field. Several layers of different shielding materials attenuate the radiation to acceptable levels.
The innermost of these layers is the monolith, a metal structure several metres thick that embeds the target, moderator and reflector systems, as shown in section in figure 80. It is made of stacked steel blocks supported on a concrete foundation that form a cylindrical unit 8 m high and 11 m in diameter. Outside the monolith radius of 5.5 m, more shielding material of different types, amounts and locations surround both the neutron transport optics and the sample positions for the instrument lines.

Figure 80. Horizontal section cut of the monolith structures, at the level of the upper moderator position above the target wheel. The butterfly shaped moderators is at the very centre of the picture, surrounded by the void cut-outs (white) in the reflector, and the innermost shielding blocks. Neutron transport optics start at 2 m and extend out to 5.5 m in the form of radial inserts (grey) installed in the beam ports (brown). Shutters (green) fill the space from 5.5 to 6 m.
Download figure:
Standard image High-resolution imageModerated neutrons are made usable by guiding them through the open channels of the beam extraction system. Each instrument line has specific and unique requirements, so the extraction system accommodates diverse neutron beam sizes, divergences, directions and points of origin at the surfaces of the moderators. At the same time that the extraction system is versatile, it also has a compact layout that accommodates many instruments, and which maintains a future flexibility to evolve the scientific instrument suite.
Components inside the monolith, including the beam extraction system, are surrounded by an atmosphere that is either high purity helium or a vacuum, which is transparent to neutrons, prevents corrosion, and minimises the generation of a radioactive inventory. For this reason, and to confine radioactive materials, the monolith and its internal parts and components are contained in a vacuum tight vessel.
The first part of the beam extraction system, inside the monolith, is shown in figure 80. Void cut-outs surround the butterfly moderators, reaching out radially 2 m through horizontal slots in the reflector material, and in the steel shielding blocks at the centre of the monolith. These first two metres are essentially a compact common open space that is shared by all instrument lines. The void accommodates the vertical divergence of the neutrons by increasing to a maximum height of 120 mm at a radius of 2 m. While the void design is flexible enough to accommodate the future evolution of the instrument suite during the entire facility lifetime, some special provisions are made in the initial build, for example to enable inclined beam extraction and extra-high beam extraction for a few specific beam lines.
A total of 42 neutron beam ports start at a radius of 2 m, reaching to the outside of the monolith at a radius of 5.5 m. These rectangular and stepped beam ports are fairly narrow (approximately 250 mm), due their small angular average separation of  , but they are tall (about 600 mm), exposing both upper and lower moderators to each instrument line. The inserts that form the beam ports are individually adapted and uniquely designed to include the necessary neutron beam transport and optics equipment for each scientific instrument line. It is possible to use up to about 35 beam ports at any given time.
The beam ports are vacuum tight, inside a thin aluminium window mounted in a plate at a radius of 5.5 m that is nearly transparent to neutrons. Beam shutters half a metre long, outside the beam window, can be closed to shut off the neutron beam, permitting the maintenance of downstream components. Some shutters, when open, contain neutron optics that match the beam guide inside the monolith to the external optics, making a continuous aligned neutron instrument beam line.
3.2.1. Neutron beamport and instrument layout
The average angular separation of the beam ports is  , alternating between the two values of
  and
and  . Ports are divided equally between two
  sectors: one is directed towards experimental hall number 1, and the other towards experimental halls 2 and 3. Ports in both sectors are in turn divided into two groups, in order to optimise the use of the butterfly moderators. The beam ports in each group diverge from one of four focal points that are located where the cold moderator butterfly wings meet the central, X-shaped, thermal pre-moderators, as shown in figure 81. This arrangement allows each instrument line to be fully cold, fully thermal, or bi-spectral.

Figure 81. Vertical section cut through one instrument line position showing both possible neutron extraction paths from the upper and the lower moderators. The central void cut-outs (white) penetrate the reflector material design of the beam extraction system.
Download figure:
Standard image High-resolution image3.3. Moderator simulations
The cold moderator cannot be prototyped, due both to the lack of hydrogen infrastructure (pumps for these operational conditions are not available off the shelf), and also because the enormous neutronic load (thermal and structural) is essentially impossible to reproduce. Thus, fluid dynamic simulations of the temperature and pressure fields are of particular importance, answering questions about heat dissipation, and about how the pulsed heat input affects pressure pulses and local boiling phenomena, et cetera. Inner flow guides are optimised to remove the neutronic heat deposition and to avoid recirculation zones and bubbling [137].
Pure aluminium is almost transparent for cold and thermal neutrons. It is necessary to use a high-strength aluminium alloy (AL6061-T6) because of the high operating pressure of hydrogen, even though the alloy absorbs more neutrons than pure aluminium. Operating at low temperatures of 17–21 K, the cold moderator structural material requires strength analysis according to nuclear code RCC-MRx [138]. Hydrogen properties are used around the operating point in the ranges 10 bar to 20 bar and 15 K to 40 K, to simulate pressure and temperature fluctuations in the beam pulse. Material data are taken as a function of temperature  from [139]. Simple temperature functions are inappropriate for hydrogen, which suffers from abrupt changes in material properties—phase changes—at some boundaries in temperature-pressure space. Instead, temperature and pressure tables
  are used [137, 140].
Many of these considerations also apply to the thermal moderators and reflectors, which are cooled with water instead of cryogenic hydrogen.
3.3.1. Hydrogen fluid parameters
Temperature stability in the cold moderator design avoids changes in neutronic performance. Single phase operation avoids flow instability. Mechanical stresses are sustained under pressure, and during pressure pulses. Heat is removed into the cryogenic cooling system.
The hydrogen phase diagram includes a still undefined area, besides the usual solid, gas and liquid phases [137]. This mixed phase area in  space, called supercritical because it exceeds the critical point defined by
  , contains two sub-areas:
- (i)subcritical pressures with overcritical temperatures
- (ii)overcritical pressures with overcritical temperatures .


Only the second case is truly supercritical, in the sense that no more phase changes are observed as the temperature is increased. Nonetheless, overcritical pressure operation can result in normal phase change phenomena such as blisters and film boiling, which must be avoided. A pseudo-critical (PS) line describes a kind of boiling curve that is interpreted as an extension of the normal boiling curve, leading to a pressure-dependent PS boiling temperature  , with
  K at p = 15 bar.
The high nominal operating pressure of 15 bar avoids pseudo-phase changes, and increases the low temperature range of the clear liquid phase, but increases the structural loads. The nominal temperature range, from 17 K at the inlet to 21 K at the outlet, is well below the PS boiling temperature. The mass flow derived from the total heat input  and the temperature rise
  is
is

including static heat flows in the cooling circuit, pump et cetera.
3.3.2. Neutron heat load
The worst case model time structure of the neutron heat input follows the proton pulse on target, with a rectangular pulse of length of 2.86 ms arriving at a 14 Hz rate, resulting in a transient heat load that is 25 times the time-average load. The local heat load depends strongly on location, decreasing almost quadratically with increasing distance from the spallation centre. In addition, the local heat load depends on the material that acts as shielding between the point of interest and the source. In general higher density materials have increased interaction probabilities, receiving more heat than lower density materials. Figure 82 show the neutron heat load distribution that is used in simulation. Integrated over the volume of the four cold moderators, the total heat load adds up to  kW.
kW.

Figure 82. Analysis of neutron heat. LEFT: Visualisation of the input data. RIGHT: 3D fit for CFD simulation.
Download figure:
Standard image High-resolution image3.3.3. Fluid dynamics and structural mechanics
Figure 83 shows the fluid dynamic behaviour of the cold collimator system, over five beam pulses [137, 141]. The absence of an upward trend in temperature shows that there is sufficient time between beam pulses to remove the neutronic heat. Even the maximum temperature—in the aluminium on the outside of the moderator vessel—does not exceed the allowable critical temperature of 34 K. More important is the hydrogen-aluminium interface temperature, with a maximum temperature of about 30 K, well short of the criticality value. Pressure peaks reach up to a maximum of about 17 bar.

Figure 83. Computational fluid dynamics simulation results, showing temperature and pressure fluctuations during five beam pulses.
Download figure:
Standard image High-resolution imageStrength and fatigue analysis simulations according to RCC-MRx are ongoing at the time of writing, using the computation fluid dynamics simulation results as input, to ensure that the maximum allowable stress of 55 MPa is not exceeded [138]. Preliminary results show that the local stress exceeds this maximum only in small areas. This is mitigated by small changes in geometry, increasing the radius of curvature in these critical areas.
3.4. Manufacturing moderator vessels
Machining, welding and quality assurance tests have been performed on the AL6061-T6 alloy that is used for the volume moderators. Nine vessels with different welding methods were built and tested, with x-ray inspection of the weld seams, helium leak testing, burst tests, and elementary analysis of the weld zone [142]. Manufacturing challenges in constructing the cold moderator halves shown in figure 84 include:
- (i)Machining large (600 mm diameter) thin (3 mm thickness) structures.
- (ii)Machining undercuts with high precision tolerances.
- (iii)Cleaning, pickling and preserving machined parts.
- (iv)Crack free welding.
- (v)Installing sheet filler to achieve the welds, maintain form stability and reduce the installation time (to minimise oxidation).
- (vi)Electron beam through-welding to the flow channels of the AL6061-T6 thermal moderator, as shown in figure 85.
- (vii)Asymmetric warp avoidance, on a single-sided welded structure.

Figure 84. Cold moderator halves milled from two solid AL6061-T6 work pieces. From left to right: lower half; lower half turned; upper half; lower and upper halves together [142].
Download figure:
Standard image High-resolution image
Figure 85. Electron-beam welding parameter test on the thermal moderator through-weld.
Download figure:
Standard image High-resolution image3.4.1. Cold moderators
Manufacturing the flat cold moderator is particularly challenging. Forming the moderator from upper and lower halves, as shown in figure 84, enables the welds to be placed outside high stress areas, at locations that are accessible and testable. The halves are high-speed milled from two solid work pieces. Electron-beam welding filler grooves are 0.5 mm wide and 2 mm deep, with a tolerance of 0.05 mm. An undercut of 5 mm allows the weld seams to be placed out of the high stress area. The maximum clearance between parts is 0.1 mm during the welding process. Stiffness is maintained by following a particular milling sequence, in order to achieve this high precision, particularly during the undercut milling. Work pieces are prepared by face milling to decrease the inner tension equally on all sides, and to make them planar. Alignment holes are drilled, and then the 30 mm deep undercut is made with top down movement to reduce the forces on the remaining wall, only 3 mm wall thick.
Figure 84 shows how the surrounding material is kept for support during milling, and to be able to precisely mate the lower and the upper halves, using the fixture holes. The two pieces are connected after the upper and lower halves have been machined separately. The remaining material is milled down to 3 mm wall thickness, and the welding filler groove is made. The surrounding material is kept to guarantee stiffness during the welding process.
3.4.2. Thermal moderators
The 600 mm diameter thermal pre-moderator disc is shown in figure 85. Both the 30 mm high inner flow channel water cross and the 40 mm high vacuum surround are high-speed milled from a solid AL6061-T6 work piece. The operating pressure is only 5 bar, so the welding is less demanding than for the cold moderator. Through-welding the closing plate to the flow channels eliminates the need for any undercut milling. A sheet filler is used to meet the through-welding challenge, with good dimensional stability and faster installation, avoiding oxidation. An example of the weld quality and the penetration depth, using an AlSi12 filler material, is shown on the right of figure 85. The weld seam is slightly off-centre to the left, indication that the electron beam welding beam power could be higher to increase the weld thickness. Compliance of the tolerances is very important.
3.5. Material lifetime estimates
Radiation induced material degradation has been assessed for the T6 tempered 6061 alloy that is used for the moderator-reflector vessels that contain cryogenic hydrogen, water and beryllium. There are three main interactions that degrade aluminium alloys:
- (i)silicon yield due to thermal neutron capture followed by a beta decay;
- (ii)helium yield generating bubbles at grain boundaries; and
- (iii)displacement damage initiated by primary knock-on atoms.
3.5.1. Silicon yield
Transmutation of aluminium to silicon introduces significant hardening and embrittlement, and introduces additional SiMg2 precipitation hardening, in addition to the displacement damage. Unlike 5-series aluminium alloys, the reduction of ductility of AL6061-T6 alloy saturates at high irradiation doses. Its total elongation is more than 4% at a thermal neutron dose of 1023 neutrons cm−2 that corresponds to about 1.5% of silicon yield in aluminium. This indicates that AL6061-T6 has a longer lifetime than 5-series alloys.
The integrated thermal neutron flux in the cold moderator is  neutrons cm−2 for a year of 5 MW beam operation, leading to a maximum silicon yield rate of about 0.9% per year. The cold moderator should retain more than 5% of total elongation after a year, due to silicon embrittlement. Cold moderator lifetimes would be longer than a year if silicon embrittlement were the only significant mechanism. Unfortunately this is not the case.
3.5.2. Helium bubbles
Helium is mainly produced in aluminium by high energy neutrons and protons with kinetic energies greater than 1 MeV. Helium production may enhance both irradiation hardening and embrittlement effects, although information and experience with AL6061-T6 in this high energy regime is lacking. Instead, PIE data of the aluminium alloy AlMg3 that was used as the material for safety-hulls of the SINQ Target-III is used as a guideline in determining the lifetime of AL6061-T6 due to helium embrittlement [143]. Tensile test results on the SINQ window, which was exposed to 6.8 A h−1 of 570 MeV protons and the resulting spallation neutron irradiation, indicate strong irradiation hardening and embrittlement effects. The total elongation decreased from 22% in non-irradiated condition to about 8% after the maximum dose of 3.6 dpa, with further decreases expected with increasing dose. The reduction of the uniform and total elongations of the AlMg specimens at doses above 2.7 dpa is due to high density helium bubbles at grain boundaries, with a maximum helium yield of 1125 appm for the total proton charge of 6.8 A h−1.
The SINQ Target-9 has been irradiated with a total proton charge of 13.2 A h−1 during 2011 and 2012, without any structural failure in its safety-hulls. Assuming the same beam footprint, the Target-9 window received a dose of 2200 appm helium and 7 dpa radiation damage. The maximum helium yield in the ESS thermal moderator is 310 appm per 5 MW year, far below this value. Thus, helium bubble induced material degradation seems relatively unimportant in determining the moderator-reflector assembly lifetime.
3.5.3. Displacement damage
The pre-moderator, next to the target, suffers a maximum displacement damage rate of 29 dpa per 5 MW year, due to the fast neutron flux ( MeV). Operating experience at the high flux isotope reactor at ORNL shows that AL6061-T6 is able to withstand up to 40 dpa of irradiation, indicating that the pre-moderator is replaced every 7000 h. Displacements and point defects in aluminium self-anneal at a moderately elevated temperature, so there is room for further relaxation of the dpa-based lifetime limit. A long-term materials research programme will identify the displacement damage levels that limit the pre-moderator lifetime.
Current knowledge of 5 and 6 series aluminium alloy material properties suggests that the lifetime of the moderator vessels is limited by the displacement rate of 29 dpa yr−1 at the pre-moderator vessel, which is predominantly exposed to the fast neutron flux. After taking a safety margin, the lifetime of the moderator system is determined to be one 5 MW year, at least for initial operations.
3.5.4. Reflector material—beryllium
Helium bubbles produced in beryllium via (n, 2n) and (n, α) reactions may lead to swelling. Swelling increases monotonically with dose, bounded above by an estimate of 1% for beryllium containing 5000 appm of helium, after irradiation at temperature between room temperature and 350 °C. The maximum helium production rate in the beryllium reflector is 520 appm per 5 MW year, corresponding to a swelling ratio of less than 0.1% per year when the beryllium volume is water-cooled. The beryllium is not expected to swell enough to cause a structural failure of the reflector vessel, during the initially set 5 MW year moderator-reflector lifetime.
Neutron irradiation may lead to a decrease in thermal conductivity of beryllium. The maximum fluence in the beryllium reflector is about  n cm−2 on one 5 MW year. The thermal conductivity of beryllium is conservatively estimated to be about 50% of the unirradiated value after a year of 5 MW beam operation, increasing the operational temperature with time, with an accelerated the swelling rate.
The exothermic beryllium-steam reaction could occur in a LOCA in the reflector. This is a safety concern, as it produces toxic beryllium oxide, flammable hydrogen, and heat. Studies of the chemical reactivity of irradiated beryllium and steam indicate that hydrogen generation is enhanced at a temperature of 700 °C, in a test in which the specimen experienced a temperature excursion above 1000 °C. The temperature in the beryllium reflector must be kept below 350 °C during nominal operations, to avoid a swelling rate larger than 0.1% per 5 MW year. In accidents, the temperature in the reflector must be kept below 600 °C, to avoid accelerating the beryllium-steam reaction.
3.6. The CMS
The CMS provides cryogenic hydrogen at supercritical pressures of 15 bar to the hydrogen moderators, for both cooling and moderation, with a mass flow of approximately 1000 g s−1, at an inlet temperature of 17 K inlet and a maximum outlet temperature of 21 K. The neutronic heat load scales directly with the proton beam power, varying significantly over different time scales, with a maximum of 17 kW. The CMS is part of a larger integrated cryogenic cooling system that also includes a helium TMCP [144]. Neutronic heat deposited into the hydrogen circuit from the moderators is in turn transferred to the TMCP through a heat exchanger with a capacity of 30 kW.
The CMS, shown schematically in figure 86, consists of a vacuum insulated cryostat that houses the main components, and a vacuum jacketed piping circuit between the cryostat and the cold moderators. The main components include two high performance turbo pumps, the TMCP heat exchanger, an expansion vessel maintains pressure in the hydrogen circuit by compensating for the dynamic changes in hydrogen density, and a converter that uses a catalyst to accelerate the conversion rate of ortho-hydrogen to para-hydrogen during initial cool down, and which maintains great than 99.5% para-hydrogen concentration during operation.
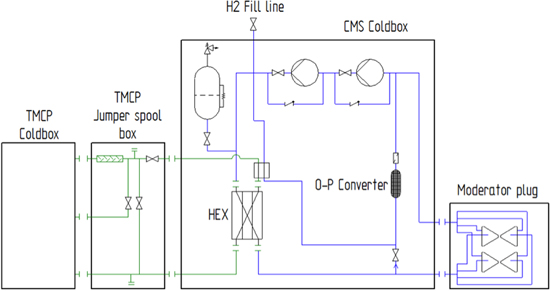
Figure 86. Simplified schematic of the cryogenic moderator system.
Download figure:
Standard image High-resolution imageHydrogen is circulated by two pumps operating in series. Both pumps are capable of the full mass flow, and each pump runs at 50% of the rated head during normal operation. If one pump fails, operation will continue at reduced capacity using the remaining pump, avoiding the need for a warm redundant pump. The pumps will be operated using variable frequency drives, allowing the pumps to operate from 20% to 100% of rated flow.
A unique passive pressure control system uses an expansion vessel and heater to provide expansion volume and pressure relief, and to substitute for the neutronic heat load, enabling operations to handle large changes in heat load during beam trips and short shut downs [145]. It is capable of handling up to 2.5% volume variations in the system.
Cold moderator dimensions are optimised for pure para-hydrogen, so an ortho-to-para converter is installed in the circuit. At 20 K the natural equilibrium of hydrogen is very close to 100% para-hydrogen, while at 300 K the natural para concentration is only 25%. The CMS circuit is initially filled with warm hydrogen gas, which is circulated and cooled to 17 K by the TMCP. Natural conversion takes place as the temperature is reduced, but in a very slow process. The ortho-to-para catalytic converter greatly reduces the required conversion time, releasing a large amount of energy and requiring an additional 12 MJ of cooling to reach 17 K. The converter is installed in a bypass line, since the heat load and irradiation potentially reconverts para-hydrogen to ortho-hydrogen, and providing operational flexibility in terms of the amount of fluid passing through.
The hydrogen circuit inventory of about 22 kg, or about 290 litres of liquid hydrogen at 17 K, requires 250 normal m3 of gaseous hydrogen at each filling. The distance between the CMS cryostat and the cold moderators is approximately 40 m, spanned by a vacuum insulated pipe in a circuit that also includes a valve box where the hydrogen is distributed to the upper and lower moderators. Vacuum insulated bayonet connections enable the hydrogen circuit to be disconnected from the moderators when the monolith is open, for example when the moderators are replaced or repaired.
4. Remote handling systems
The 5 MW neutron spallation process produces a large spectrum of particles and ionising radiation that inflicts radiation damage on the main equipment dealing with the neutron production. Depending on location and function of this equipment, the radiation damage requires maintenance and exchange on intervals from around 6 months to several years. Spent machine components have a contact dose in the Sv h−1–kSv h−1 range, so measures and precautions during handling are crucial. The ALARA principle applies, and the remote handling systems minimise exposure to both workers and public. Remote operations, monolith maintenance, logistics, treatment, interim storage and waste shipment are designed for and provide a safe way of dealing with the radioactive waste path, all the way to the long term off-site repositories.
Table 47 lists the main components and parameters of the remote handling systems that deal with spent equipment from the monolith. The main structures are the in-house shielded transport casks for lifting and safe transport of monolith components, and the active cells facility (ACF), with sub-systems for waste treatment, interim storage and shipment preparation. The ventilation system supports safe operation within all target facilities, including the remote handling aspects, making sure that emissions are controlled and that zone depressurisation functions.
Table 47. List of the main monolith components including their main physical data.
| Component | Mass | Dimension | Value | Materials | Lifetime |
|---|---|---|---|---|---|
| (t) | (m) | (years) | |||
| Target wheel | 10 | Height | 6.3 | Stainless steel, tungsten | 5 |
| Max dia. | 2.6 | ||||
| Moderator and reflector plug | 15 | Height | 6.3 | Stainless steel, aluminium, beryllium | 1 |
| Footprint | 1.5 × 1.5 | ||||
| Proton beam window | 0.2 | 0.4 ×0.4 ×0.4 | Stainless steel, aluminium | 0.5 | |
| Neutron beam guide inserts | 3.4 | Height | 0.6 | Stainless steel, aluminium | 10 |
| Length | 3.5 | ||||
| Width | 0.3 | ||||
| Proton beam instrumentation plug | 4 | Height | 4.4 | Stainless steel, tungsten | 1–5 |
| Depth | 4.5 | ||||
| Width | 0.2 |
4.1. The ACF
The ACF is basically a large hot cell with the main functions of receiving, processing, interim storage and shipping of volume-activated spent components. The ACF treats and takes care of all high-level activation items throughout the lifetime of the ESS, in due course shipping them offsite. The five major areas of the ACF shown in figure 87 are:
- 1Process cell—Waste reception and processing. Pack waste into wastebaskets.
- 2Maintenance cell—Hands on equipment maintenance and access to interim storage.
- 3Storage pits—Interim storage of wastebaskets prior to shipment. Capacity for at least 16 years of storage at full power production of waste components.
- 4Technical galleries—Contain the remote handling interfaces and controls for the active cell operation, spare part storage, PIE activities and personnel access through an air lock to the hot side of the active cells.
- 5Transfer area—For off-site shipment of casks, and for control and decontamination of shipment cask surfaces.

Figure 87. Layout of the main areas of the active cells facility.
Download figure:
Standard image High-resolution imageThe inside of the ACF is around 30 m long, 15 m high, and 12 m wide. The technical galleries are 5.5 m deep. These dimensions accommodate large components from the monolith operations, both for processing and also for interim storage and the logistics of waste transport and shipping. The shielding walls are 1.3 m of high density concrete, with a minimum density of 3.5 t m−3. These walls reduce to 3 μSv h−1 the dose in the technical galleries due to a target wheel that has been irradiated at full power for 5 years, after a 2 week cooldown period.
4.1.1. Design and construction
The most concrete and novel concept in the green field construction is that the cells have no glass windows to look through from the technical galleries. Windows generally are a weakness in the static barrier of the civil construction, both in shielding and also structurally, especially during construction. Windows would require significant maintenance during the 60-year design lifetime of the ACF.
Window removal enhances operational flexibility, centralised operation and cell utilisation. Operational flexibility is improved by removing the constraint that operations must be planned near windows through which operators have limited visibility, with through-wall manipulators placed close by. Operations made via cameras and sensors are instead performed anywhere in the cell, using master-slave arms that are operated by motors instead of by classical manual force, and which are placed where needed. The design and layout of the facility is based on the logistical path for waste treatment, packaging, interim storage and shipment.
4.2. Logistics of spent components
The target station building sketched in figure 88 accommodates the logistics required in handling highly activated components originating from the neutron beam production process in the monolith. There are two access paths to the components inside the monolith: one the high bay through the connection cell; and one from the instrumental hall area. Both paths contain equipment during operation, so some dismantling is necessary in order to access monolith components for exchange. ALARA requirements are met by the ability to change components independently from each other. For example, the twister design of the moderator and reflector plug enables its exchange without removing any target wheel components.

Figure 88. Layout of the main areas of the target building.
Download figure:
Standard image High-resolution image4.2.1. Transport from the monolith to the active cells
Spent monolith components are inserted in shielded casks with floor valves that keep the components encapsulated, before transportation. Figure 89 shows the target wheel cask, as an example. Component are hoisted by an internal lifting device within the cask, and the whole assembly is then transported by the high bay crane. The maximum capacity is 95 tonnes, using two 50 tonne cranes in a single crane mode. Different casks are docked on the roof of the ACF, on top of a floor valve that either has an interface to the process cell or the maintenance cell, or has direct access to a storage pit. This storage pit is deep enough to accommodate the tallest components from the monolith without any cutting operations. The storage pit is used if a component cannot be immediately lowered into the process cell.

Figure 89. Preliminary design of the target wheel cask.
Download figure:
Standard image High-resolution image4.2.2. Active cells logistics
Inside the ACF, a component is moved from the cask to the process cell where it is dismantled and reduced in size. Waste is then packed into wastebaskets that are decontaminated and moved, first to the maintenance cell, and eventually into a storage pit for interim storage until offsite shipment criteria are fulfilled. Wastebaskets are shipped offsite via the transfer hatch, through an arrangement for waste disposal within the Swedish radioactive waste system. The waste is dry and metallic, so the main path is to use a standard tank and shipment container system. Figure 90 illustrates the step-by-step logistics:
- (1)An internal transport cask is docked on top of the ACF.
- (2)A monolith component is loaded from the cask, through a floor valve and into the process cell of the ACF.
- (3)The component is dismantled in accordance with a pre-defined procedure, and the pieces are loaded into a wastebasket.
- (4)The wastebasket is decontaminated in a storage pit to mitigate unnecessary contamination of surfaces in the facility and shipment containers.
- (5)The full wastebasket is stored in a storage pit until further transport is possible, depending on public road transport regulations.
- (6)Wastebaskets are lifted from the storage pit, through the transfer hatch and into a shipping container.
- (7)When full, the shipping container is rolled out from the loading position, through an airlock door and into the transfer hall.
- (8)The high bay crane picks up the container and loads it onto a transport truck that then drives the container to its offsite location.

Figure 90. Wastebaskets loaded into the shipment cask for transport offsite.
Download figure:
Standard image High-resolution image4.3. Active cell operations
All remote operations are performed from an ACF control room on the ground floor of the technical galleries. Window-free operation requires a strong design focus on visualisation, on the human machine interface, and on multiple redundancy in case, for example, a camera stops functioning. Information flow from the cells to the operators is primarily based on sensors rather than cameras. Figure 91 show some of the equipment in the process cell:
- High-efficiency particulate air (HEPA) filters—The first line of ventilation filtration inside the process cell, needing remote maintenance.
- Circular saw—Cuts pieces that are too long for direct waste disposal, typically the wheel shaft and the moderator reflector plug shaft. Dry cutting minimises fluid activated fluid.
- Power manipulator arms—The two arms are mounted on a bridge, crane rail and telescopic arm, ensuring coverage of the whole cell floor, up to a height of 7 m.
- Through-wall manipulators—Motorised with access where needed, enabled by the flexible location of the through wall-tubes.
- Cameras—No windows are installed.
- Electrical and signal cables—All cables are routed in stainless steel conduits installed in the basement slab.
- Anchor plates—All equipment fits into the grid of anchor plates, pre-cast into the basement slab.
- Liner beams—Stainless steel liner is welded to the cast-in liner beams, enabling a tight stainless steel cover on the whole internal structure of the active cells.
- Rotating table—Worktable for all components needing disassembly. The table rotates in order to accommodate the circular saw.
- Work tables—A number of general purpose work tables are available.

Figure 91. Process cell equipment.
Download figure:
Standard image High-resolution imageACF operations use a mode control system to determine which openings can be opened and which operations are possible, based on the status of the system. Permissible operations depend on safety related signals from the facility, such as the negative pressure cascade measurements, the open/closed status of the intra bay shielding door, the ambient dose levels in the cells, etc. All process equipment inside the process and maintenance cells are coupled to the mode control but do not have any safety implications. Remote operations are not possible from the main accelerator control room, although some ACF information is transmitted there for informational purposes. A site-wide waste tracking system for the whole facility keeps track of each individual waste item.
4.4. Heating, ventilation and air conditioning
An active cell must be confined when handling highly activated components, in order to minimise the risk of spreading contamination to other parts of the building, and hence to personnel or the public. Static confinement of the active cell—the building structure including the stainless steel liner—is reinforced by dynamic confinement, mainly the responsibility of the ventilation system. Dynamic confinement maintains the active cell at a lower pressure than the surrounding compartments in the target station, forcing airflow from lower contaminated areas to higher contaminated areas. The ventilation system maintains dynamic confinement during normal and abnormal conditions. It also:
- maintains temperature and humidity, removing sensible heat loads;
- filters the extracted air to minimise airborne contamination and the activation of air released through the stack;
- delivers extracted air to a radiation measuring station;
- prevents the spread of fire between different cells.
The heating, ventilation and air conditioning system of the target station is based on the methodology described in the ISO standard 17873 'Nuclear Facilities—Criteria for the design and operation of ventilation systems for nuclear installations other than nuclear reactors'. Containment areas are classified depending on the expected contamination at normal operation as well as in accident cases, as described in table 48. Accident cases are analysed as a part of the hazard analysis that is systematically performed for each target station system. The classification of the preliminary containment area is C4**, where the asterisks ** refer to the expected normal contamination level. The ISO standard suggests the configuration shown in figure 92.

Figure 92. Ventilation system configuration according to ISO 17873.
Download figure:
Standard image High-resolution imageTable 48. Classification of containment areas, following ISO standard 17873.
| Class | Expected normal and/or occasional contamination |
|---|---|
| C1 | A clean area free from normal radioactive contamination, whether surface or airborne. A low contamination level can be accepted only in exceptional situations. |
| C2 | An area that is substantially clean during normal operation. A medium level of surface or airborne contamination is acceptable only in exceptional circumstances resulting from an incident or accident situation. Appropriate provisions must be made for contamination control. |
| C3 | An area in which some surface contamination could be present, but which is normally free from airborne contamination. There is a potential for surface or airborne contamination at a level higher than in C2 areas, in some cases resulting from an incident or accident situation. Suitable provisions must be made for contamination control. |
| C4 | An area in which permanent and occasional contamination levels are so high that personnel access is normally not permitted, except with appropriate protective equipment. |
4.4.1. Airflow
Airflow parameters are primarily determined by the heat loads present in each room, and by the maximum and minimum allowable temperatures. Differential pressures between rooms ensure the dynamic confinement airborne contamination, taking into account the containment area classification and the guideline pressure values proposed in SS-ISO 17873:2011. In every case a differential of at least 40 Pa is maintained between rooms with different classifications. Further, SS-ISO 17873:2011 sets minimum airflow speeds across openings in a room envelope when they are present. For example, a minimum speed of 1.5 m s−1 is maintained when opening a master slave manipulator port in an active cell, due to the presence of tritium source terms.
The first level of filtration (HEPA) is placed within the active cell, and can be replaced remotely. The use of a self-cleaning filter could reduce the substitutions of the filtration media. The filter can be by-passed in case of clogging, preventing pressure inversion of the active cell with respect to the adjacent premises. Filters and backdraft dampers on the air supply prevent the backflow of contaminated air in case of ventilation system failure. Table 49 lists the airflow parameters for the active cell.
Table 49. Top-level active cell parameters.
| Parameter | Units | Value |
|---|---|---|
| Air supply | m3 h−1 | 6500 |
| Air extraction | m3 h−1 | 7000 |
| Pressure | Pa | −300 to −220 |
4.4.2. Hazard analysis
The hazard analysis of radiological safety in the active cell concerns both abnormal situations and ventilation system failure modes. Air supply into a room stops when air extraction ceases, to prevent over pressurisation. Filters are installed as close as possible to the contamination source, to reduce the spread of radioactive particles along air ducts. Bypasses are installed on the first filtration levels, to ensure air extraction in case of clogging. Fire dampers on the air supply suppress the spread of a fire, while extracting air for as long as possible to maintain dynamic confinement.
5. Target safety
This section describes the rigorous process used to identify the safety functions needed to protect workers and the public from the radioactive hazard present in the target station. The hazards and accident analyses and resulting safety functions, emphasising the safety-related active controls TSS, are described. Mitigation measures taken to fulfil the safety functions, including design features built into systems, active controls needed to shutdown the beam or take other actions, and administrative controls are described.
5.1. Accident analysis
The ESS is a complex facility with the potential to pose a variety of hazards to human beings and the environment. Although ESS is not defined to be a nuclear facility according to the Swedish regulations, ESS emphasises the objective of setting radiation shielding and safety as a main priority for all phases of the project from design, through construction and operation, to decommissioning.
There is no significant radioactive inventory when ESS is commissioned. During operation, penetrating fast neutrons are generated in the target. The main inventory of nuclides are in the target, and it is in the target station where most of the radioactivity is generated. ESS has executed a radiological hazard analysis process for identifying and managing potential risks with accidental release of radiological inventory to workers and reference person, in order to protect the workers and the public from accidents with potential radiological consequences.
ESS has established a systematic process to identify, evaluate, and control potential radiological accidental events, a process that is in general based on DOE-STD-3009-2014 [146].
5.1.1. Hazard analysis
The events included in the hazard analysis are described by defining the postulated initiating events (PIEs) that cause top events to occur. A top event can have one or many initiating events. An initiating event triggers a top event on its own or in combination with other initiating events. A top event is an undesired event that poses a potential radiological risk to workers or to the public. The top event is typically chosen to be the situation or occurrence that is brought up by the analysis group and thus has not got a fixed point along the chain of events from initiating event to final consequence.
For example, one top event is the leak of air from the processing cell to the galleries. Examples of PIE are the removal of a through-wall manipulator, a seal failure, loss of power to the ventilation system, or the erroneous opening of an access point. Multiple top events have been identified for each system during the hazard analysis. Identified top events can have an effect on interfacing systems and thereby becoming PIE for neighbouring systems. The potential effect on a neighbouring systems is included in the consequence description.
The unmitigated consequences of a top event describe its potential impact, it includes local effects as well as the postulated effects on the next system level or neighbouring systems, which could lead to radiological consequences to workers or to a reference person.
The consequences and the probability for an unmitigated hazard scenario are initially estimated using qualitative and/or semi-quantitative techniques. Qualitative estimates are based on expert engineering knowledge from similar systems, whereas quantitative estimations are based on simulations or estimated failure rates from system and equipment suppliers. Top event consequence estimation addresses potential radiological effects (dose) to workers and to the public, consistent with the requirements for consequence levels given by Swedish radiation safety authority (SSM).
5.1.2. Accident analysis
Accident analysis is the process of deriving a set of formalised design-based accidents from the hazard analysis, and quantitatively determining their probability for occurrence, and determining their consequent top events. Accident analysis results identify the need to designate safety class and safety functions.
The selection of an accident scenario for analysis is based on at least one 'bounding event' from each of the major types determined from the hazard analysis that have the potential for an unacceptable risk level. A bounding event is the accident with the most severe consequences among a group of similar accidents. If bounding events are prevented or mitigated, then the group of similar accidents is also addressed and will not require additional safety functions. Scoping calculations performed during hazard analysis are used to show whether accident analysis is needed or not.
The determination of the accident source term—the amount of radioactive material that is released—is based on a formal description of the accident scenario. The radiological consequences (dose) to workers and to the public are calculated, based on technically justified input parameters and underlying assumptions such that the overall consequence calculation is conservative. Conservatism is assured by the selection of bounding accident scenarios, and on the selection of conservative source terms and input parameters.
The functions that can prevent or mitigate a hazard scenario are identified for each unmitigated accident scenario with an unacceptable risk level. Risk reduction measures are selected using a judgement-based process that considers a hierarchy of controls giving preference to passive engineered safety features over active ones; engineered safety features over active controls or specific administrative controls; and preventive over mitigative controls.
A mitigated assessment is performed to determine the effectiveness of safety functions, by estimating the hazard probability with risk reducing measures implemented.
5.1.3. Selected accident scenarios
Hazard analysis has identified some 350 top events from all parts of the target station. A selection and further definition of 21 accident scenarios has been made out of these, for further analysis. They are:
- - Target wheel stop during beam on target
- - Beam event: Focused and non-rastered beam on target
- - Loss of target wheel cooling during beam on target
- - Leakage from target cooling circuit into monolith
- - Clogged wheel channels, local overheating
- - Loss of helium purification function
- - Water leakage from intermediate water system into target helium
- - Loss of confinement in target helium system—release into utility rooms
- - Liquid hydrogen leakage with explosion, or leakage with local fire
- - Water leakage in monolith (highest contamination level)
- - Water leakage into connection cell and utility rooms
- - NBG/chopper—missile effect on monolith system
- - Beam dump—high power beam when target in maintenance mode
- - Earthquake scenario target monolith
- - Active cells: Operator inside maintenance cell when door unintentionally opens
- - Active cells: Operator inside process cell next to worst case inventory
- - Active cells: Operator inside maintenance cell next to worst case inventory
- - Active cells: Loss of dynamic confinement (loss of HVAC)
- - Active cells: Loss of confinement process/maintenance—open doors
- - Active cells: Fire in maintenance or process cell
- - Active cells: Earthquake.
5.2. Mitigation requirements
The results from the accident analyses are used to derive the mitigation requirements that are needed to keep the consequences (radioactive doses) within acceptable limits, depending on the probability of the event, in accordance with SSM's special conditions for ESS. The higher the probability of the event, the lower the acceptable dose.
The mitigation requirements are used to appoint safety functions, as illustrated in figure 93, with three categories (denoted SaF 1, 2 and 3) that depend on the severity of the radiological consequence if that function fails. Safety classification criteria are based on the IAEA safety guidelines and on the dose limits based on SSMs special conditions for ESS. The highest safety function SaF 1 applies for the highest severity.

Figure 93. Mitigation to keep accident consequences within acceptable limits.
Download figure:
Standard image High-resolution imageEquipment—such as structures, systems and components—that perform a safety function are assigned a safety class (denoted SC 1, 2 and 3) according to the safety function it fulfils. Specific quality classes are defined within the equipment disciplines, such as mechanical, ventilation, electrical, and control. For example, the safety function SaF 2 implies mechanical quality class 2 (MQC2) in the mechanical equipment discipline. These quality classes define a set of requirements on the equipment, applying a chosen set of international standards.
The spallation process produces neutrons by colliding accelerated protons with the tungsten wheel inside the target station. Under certain circumstances this process could generate radiological releases above limits specified by Swedish radiation authority. Several passive and active radiation safety systems are included to meet the requirements to receive the SSM permissions needed in order to operate the ESS. One of them is the TSS.
5.3. Target safety system
The TSS is a specific branch of the ESS ICS, with the goal of preventing the release of radioactive material beyond permissible limits' and bringing the target station into a safe state in case of an abnormal event from nuclear radiation safety point of view, as illustrated in figure 94. Since the target is the only source of new radiation releases when the proton beam is present, the whole facility is put into a safe state by turning off the beam. Many of the most important event consequences are efficiently prevented in this way.

Figure 94. Schematic diagram of the target safety system.
Download figure:
Standard image High-resolution imageThe radiation safety functions of the TSS are based on results from quantitative analyses of radiation hazards within the target station. One of the most critical hazards is an increased temperature of the target wheel tungsten, which, if accompanied by oxidation of the tungsten, might cause radiological releases [147]. When the proton beam is stopped, the only source of heat is from the decay of the radioactive material that is a byproduct of spallation reactions. The target is designed so that this decay heat is removed from the target by wholly passive means from the moment that the proton beam is turned off.
Critical process values are monitored and evaluated continuously by the TSS, with any sign of failure bringing the ESS to a safe state. The TSS uses operational mode information from accelerator systems in order to meet operational requirements, and reports the TSS status to the ICS. The TSS follows the lifecycle guidance of international standard IEC 61511 in order to meet the required radiation safety levels [148]. The standard applies to the process sector at the systems-of-systems level and at the subsystem or components level, addressing safety-instrumented systems that use electrical, electronic, and programmable technology. Its complete lifecycle and pragmatic quantification of the risks and architecture provides a valuable framework for safety engineering.
5.4. Requirements and functions
The TSS fulfils requirements from the perspective of its classification (based on SSM requirements and ESS rules for classification) and also from its overall safety function (extracted from radiation accident analysis). Its classification, which depends on radiation levels in case of an identified accident, determines the design principles for a system, such as redundancy with diversity and physical separation of components and systems of components to withstand single failures and common cause failures. The overall safety function covers critical accident scenarios, defining which critical events are prevented and which actions are taken to bring the facility to a safe state. It also includes a level of reliability for the system.
An example of overall safety function is to prevent proton beam from reaching the target wheel if the temperature of the target wheel tungsten reaches a critical limit. The location of the target wheel—inside the target monolith in an area with high radiation levels—makes it hard, or even impossible, to measure the tungsten temperature with standard methods using safety classified instruments. Instead, other process variables are reliably measured, forming a set of safety instrumented functions that fulfil the overall safety function.
Proton beam is prevented from reaching the target wheel if:
- The outlet velocity of the cooling helium is too low
- The outlet pressure of the cooling helium is too low
- The inlet temperature of the cooling helium is too high
- The rotational speed of target wheel is too low.
5.5. Design
The TSS uses a redundant two-train active control system. Each train measures the same process variables, performs the same logical evaluation of the variables, and performs the same actions, with the architecture shown in figure 95. The system is independent of other systems, relying only on its own dedicated equipment. Each process variable (PV) is measured by redundant sensors. The logic solver treats these inputs with a voting function.

Figure 95. Target safety system architecture.
Download figure:
Standard image High-resolution imageThe logic solvers are diverse control equipment located at physically separated areas within the target building. They evaluate the information from the sensors, according to the safety instrumented functions, and send commands to actuators that are diverse and physically separated power contractors. Actuators are located at the far end of the AT from the target, powered by the power circuit that feeds the equipment that generates protons. No proton beam can be generated if the power circuit is broken. Figure 96 shows the physical location of the equipment within the ESS complex. The two trains follow separate cable routes through different areas of the facility, using different kinds of media; one uses fibre cables and the other uses copper cables.

Figure 96. Target safety system layout.
Download figure:
Standard image High-resolution imageThe TSS implements a fail-safe design: any failure forces the system to a safe state. Each logic solver continuously runs diagnostic tests of status on its own hardware, connected cables and actuators. In the case of a power failure, the sensors and the actuators reach a safe-state position.
The ESS Design: Controls
H. Carling, R. Andersson, S. Birch, J. Cereijo, T. Friedrich, T. Korhonen, E. Laface, M. Mansouri-Sharifabad, A. Monera-Martinez, A. Nordt, D. Paulic, D. Piso, S. Regnell, M. Zaera-Sanz
European Spallation Source, Lund, Sweden
E-mail:
1. Introduction
To get started with control system design one has to first understand the mission of the facility, that is, how the facility operates. With this understanding the most fundamental parameters for the control system can be set. For instance, a user facility like ESS with high availability requirements and a multitude of rapidly changing applications is likely to need a design that is different from a discovery facility which primarily serves one purpose. On a more detailed level a pulsed linear accelerator has different requirements compared to a storage ring or to a machine delivering continuous beam. The requirements are not limited to technical implementation but also need to consider aspects of organisation and lifecycle support, all this belonging to the domain of systems engineering.
In terms of technology, modern control systems rely heavily on advances in information technology and electronics. Highly digitalised systems of today both enable and require optimisation of systems in situ, which allows a high flexibility and ultimately a very high performance but sets also requirements for accessibility of the system and data handling capabilities. To enable the optimisation of the subsystems or the whole facility, the control system has to collect a lot of data and make it easily available for facility designers and subsystem engineers for analysis and evaluation.
The control system has to cover various aspects and needs, ranging from enabling the operators to operate the facility at the highest possible efficiency to providing information to the general public interested in how the facility operates.
1.1. Facility requirements
The ESS shall be a leading facility with state of the art performance. First of all, the 5 MW average beam power, one of the top requirements for the ESS accelerator, sets high requirements on how to handle the beam safely. Another key specification is that the accelerator produces long proton pulses at the nominal frequency of 14 Hz. The pulse structure, the beam intensity (protons/second) and the repetition rate (protons/second) define the average beam power delivered by the accelerator. These key parameters have to be controlled by the ICS in a way that fulfils the key specifications and goals of ESS.
ICS scope spans over the whole facility from controlling systems in the conventional systems to accelerator, target and the instruments. This standardised and integrated approach contributes to the whole efficiency but also requires that all the included systems have to be planned to be scalable to a very large system. This concerns not only the technical implementation but also the processes, procedures and organisational structure. For instance, similar systems should be implemented with the same tools and exceptions should be avoided as much as possible.
One specific challenge of the ESS is the distributed development model. Many components are developed and delivered in-kind and have to be integrated on the ESS site to work seamlessly with the rest of the system. As a lot of the integration challenges fall on the control system, it is of prime importance to design our systems and development tools so that they enable a high degree of uniformity already at development stage and also allow for easy integration when the systems are delivered on site. A high degree of standardisation considering aspects of industrialisation and focus on supporting the standards is of essential.
High availability and reliability are two of the most essential requirements for ESS. This has also to be taken into account when designing the ICS since many events and processes can affect the availability of the facility.
Already a fraction of one proton pulse at full power that is unexpectedly lost can do severe harm to accelerator components and cause a long interruption in operation. Another factor affecting the availability is that the accelerator needs to be brought up from the cold state to the full power in a safe and carefully controlled manner. When the characteristics of the accelerator are well understood, the ramping up should be a straightforward operation. Ramping up typically happens several times a day and since it is a process where many system parameters are gradually changed, the likelihood of beam trips is higher than in steady state operation. Beam trips due to some fault or operator intervention are of course affecting availability of the facility.
System components shall have high reliability but also need to be easily maintainable. Care has to be taken to make the hardware components modular so that they can be easily and quickly replaced.
Software components need also to be maintained in a way that the configuration is well managed, the installation is reproducible but not too rigid so that updates and bug fixes can be deployed quickly. Systematic and regular testing of the software is essential.
Different characteristics of various subsystems pose different types of challenges. For instance, it takes two weeks to cool down a cryomodule from room temperature to the operating temperature of 2 K. Should anything go wrong in this period, the cooling process may have to restart from the beginning again. For such reasons, the control system for the process has to be very stable and run for weeks and months without interruption. Even a short interruption can cause a long downtime for the facility.
On the other end of the scale, the control system must interface with systems that measure beam parameters which have to be able to react within a single beam pulse so the data transport and processing capacity must be high. Fast response time and throughput are the key characteristics for these systems.
Some of the target station subcomponents are subject to extreme conditions like the rotating target wheel that has to absorb all the deposited beam power. Its rotation has to be precisely synchronised with the accelerator operation to avoid damage. This, and other needs for synchronisation set high requirements on the stability of the facility-wide timing system.
The highly sensitive neutron instruments that are planned for the ESS set also requirements that are novel for a spallation source. Key beam parameters need to be available for the instruments in real time. All data has also to be precision time stamped globally in sync over the whole facility.
1.2. Design principles
In ESS, many systems are built or deployed for the first time ever. Thus it is obvious that not everything about the systems can be known or even predicted beforehand, even less how the different systems work when operated together. A system that had an outstanding performance in the lab may behave in a surprising way when deployed hundred times, or has to communicate with other systems. The control systems should thus be designed with flexibility in mind. It shall be possible to introduce new features and capabilities without having to extensively replace components. Flexibility can be achieved with a modular design with clearly defined interfaces between system components, both within control system and in interfaces to the components that are controlled. Interfaces shall be properly dimensioned to, for example, transfer the required amount of data at the desired operating frequency.
The control system needs to be cost-effective but at the same time provide the performance that is required to operate the facility efficiently and reliably. Control system cost is only a small fraction of the total facility construction cost but due to its nature, the control system needs constant maintenance and development throughout the facility life and thus the lifecycle cost is significant and may possibly even exceed the initial construction investment. The expected operating life of ESS is 40 years. While it is unlikely that systems built today will be able to survive the whole lifetime of the facility, we still need to think about lifecycle support. Some fundamental structures will be very difficult to change after the facility has been built and thus need to be thoroughly considered at an early stage of the project. Such issues are typically more related to documentation and organisational aspects rather than technical implementation.
A high degree of standardisation is essential for the deployment and maintenance of the control system. With standardised components, staff can concentrate their efforts to maintain a high level of skills whereas a multitude of different components would require a lot more manpower to be efficient. This has also to be taken into account with the design so that the total cost is optimised. Something that may look like a cheaper alternative may turn out to be an expensive solution if it requires more effort or special skills to maintain. For instance if one can use the standards of e.g., process industry, systems are usually designed for compatibility and easy maintainability from the beginning. For more specific areas standards are more difficult to find but the effort can still be worthwhile.
Systems that connect to I/O have first and foremost to fulfil the technical requirements for the operation of the subsystems. Technical requirements can be on features like precision, accuracy and speed of data acquisition, processing and transport. This is achieved by proper selection of technologies that are state of the art in technology where needed. If one does not need to go to the edge of the technology, using technology that is proven in use at similar facilities can reduce risks.
The control system scope comprises more than the I/O systems that are located in the facility. During building and construction, information about the components has to be collected so that the system can be efficiently managed, maintained and kept in operation with a reasonable effort. Support systems are required to manage the data that is to be used in building, configuring, managing and optimising the facility. For example, all components that are involved in beam production need to be named so that they can be referred to during design and also during operation. The control system has to enable controlling the operating parameters of the devices, for example the accelerating phase or power in the RF system or the focusing field in the electromagnets in the accelerator beam line. When the facility runs, the operators need to be able to read, analyse and modify the operating parameters of the devices. The association between the control system and the hardware is achieved with consistent device naming. For operation and maintenance, it must be known how the signals reach the control room, i.e., what components are included in the path from the I/O signals to the display in the control room. A device naming convention, configuration database and a cabling database are tools that can be used to collect, maintain and distribute this information. These services are not as directly involved as the systems directly connected to the I/O systems but are nevertheless essential for the long-term success of the control system.
To enable monitoring, maintenance and improvement of the facility, the data from the control system that relates to machine operation has to be collected and stored. This control system service, known as archiving is one of the most essential and fundamental services of the ICS. The archived data has to be available for the users for observation and analysis in an easy way. The data has to be retained in a way that best serves the users. Some detailed data may be discarded after a short, say, 2–3 weeks time but the key operating parameters shall be stored as long as the facility is in operation.
One important principle to keep in mind is that all systems but in particular the supporting systems have to be built around workflows of the organisation. For example, a database to record how a particular I/O system is built and configured, the corresponding applications to collect this data have to be ready before the building starts and has to simplify work for the developer or operator. Extra effort and cumbersome procedures make development harder and thus in the end reduces user motivation. The end result of this is lower quality of the collected data. On example of this is measurement of the characteristics of the magnets for the accelerator. If the measurement data can be fed directly in the supporting tools as a part of the measurement process, this will save time and work for everybody involved. Otherwise the data has to be fed into the system afterwards in an error-prone process. Entering data after a system has been built and is in operation is very hard, sometimes even impossible. One cannot take apart the system during operation to find out how it has been built. This applies to all systems related to configuration.
Finally, the control system has to serve users and user groups that have different needs. The beam physicist is less interested in technical properties of the subsystems and needs a more abstract view on the facility, whereas a subsystem engineer who wants to optimise the performance of his or her subsystem needs to have access to all the details that might affect the performance. Thus, control system needs to be designed so that it allows the creation of different viewpoints for different user needs.
1.3. Baseline decisions
Based on the principles described above, some design decisions have been made. It was decided to use the EPICS software toolbox as the control system core package [149]. EPICS is a collaborative effort developed by an open-source community where participants often have similar missions to ours and also share many similar requirements. Using an open-source community based approach helps ensure continued development and maintenance of the most crucial part of the system. This core component is one of the most difficult and resource consuming to replace. Community-based development presents many advantages and challenges: the ICS mission is to develop competence and innovative solutions that can be shared in the community through open processes.
EPICS is continuously developed from the core level and through the many layers of infrastructure and applications around the core. The upcoming version 4 of EPICS that has been selected as the baseline of the ESS control system extends the use of EPICS beyond the original scope of control to better support scientific applications. With the new features we can support better the different viewpoints of the users, still providing a control-oriented system for the engineer but at the same time ability to collect and handle data in units of higher abstraction such as beam orbit parameters from one unit instead of collections of individual readings. As this data is transported using EPICS, it can be shared by multiple applications, making applications simpler and lighter.
For other software the first choice of ICS is also to work together with the control system community. Many solutions and software packages that have been developed by the community can be used for ESS as long as they fulfil the requirements. Examples of this kind of systems are the package that we have selected as our data archiving system, the Archiver Appliance [150]. This software has been written with scalability as a goal and it can handle millions of process variables and thus is well suited for ESS purposes. ESS also actively participates in groups that are developing tools for configuration management for scientific facilities such as the DISCS collaboration [151] and tools for user interfaces and data handling like control system studio (CSS) [152]. This not only saves cost for software development but also widens our available pool of knowledge and experience and the openness mitigates some of the risks for maintaining the software.
ESS has decided to use the Micro-Research Finland event system as the facility-wide timing system [153]. This system has been developed together with the experimental physics community and has a long track record of providing good reliability. For the timing system—which is a key backbone component in a control system—a fairly small amount of specific development is needed to fulfil ESS needs. There is a strong collaborative effort behind the system, and even though it is mainly developed by a single company, the design is open and a number of implementations of the protocol exist. Important is also the fact that the supplier invests in the timing system product line, which is continuously being enhanced and developed. This helps mitigate the risk of product obsolescence.
As the issue of MP is critical to ESS, ESS has implemented a strategic collaboration with CERN in the development [154].
The selection of hardware platforms for ESS control system is based primarily on the system performance requirements but also on modularity, flexibility and upgrade paths as outlined above.
The selection consists of three levels, as shown in figure 97. The first level is using industrial automation technology for relatively slow I/O.

Figure 97. Three hardware platform levels: slow industrial automation technology; distributed input/output; and fast applications based on the MicroTCA standard.
Download figure:
Standard image High-resolution imageThe third level at the other end of the performance spectrum is oriented towards the fastest applications that have to cope with signal rates up to megahertz level and data transfer rates of hundreds of megabytes per second in combination with early processing of data to reduce downstream congestion. This layer is based on products implemented in the MicroTCA (MTCA.4) standard [155].
The level between these two extremes is covered with one more layer of distributed I/O based on the EtherCAT standard, a system for distributed I/O based on a real-time capable Ethernet protocol [156].
For reasons of cost efficiency, MTCA.4 systems are used only for applications that require high data rates and fast online processing. This includes BI and LLRF systems. Industrial automation PLCs are applied where performance allows and give benefits in reliability, availability and industrialised approach. EtherCAT is deployed in systems that require tight synchronisation and moderate data rates.
The development and deployment strategies of ICS aim to cover the requirements of distributed development so that it minimises the effort needed when the final integration at Lund site happens. A model is used where all software intended for production will be stored in the ESS central repository from the beginning, tested and compiled centrally and delivered to the collaborators so that ideally all collaborators have the same development environment. This is a pre-requisite for the success of the standardisation effort. The central ICS in Lund has to be able to support the collaborators when they start to work with the ESS hard- and software that may be totally different from what they have been using in their home institutes for other projects.
2. Control systems integration
The ESS heavily relies on the control and computing systems to fulfil its tasks. These systems are utilised for control and monitoring, data acquisition and processing, equipment integration and a variety of information services. System types in this domain include complex SCADA installations5 , safety related protection systems, custom-made software services, equipment controllers, timing systems, data acquisition and processing systems and information management systems. Development and operation of these systems are exposed to challenges resulting from the nature of the ESS facility and its construction approach:
- Novel technical concepts and architectures in various technological areas, resulting in an exploratory style of design and development with significant degree of uncertainties.
- The ESS is to a degree unique, representing the current state-of-the-art in neutron research engineering and is customised for the needs of particular research communities.
- The ESS partially maintains a prototypical character throughout its lifetime. Continuous upgrade activities according to technological progress and changing research demands have to be taken into account, but cannot be fully anticipated over the facilities lifetime.
- The ESS is designed by a mix of highly specialised individuals with heterogeneous professional backgrounds in singular project conditions. This requires significant integration efforts on the technical level as well as on the organisational and information management level.
As a result of these challenges and characteristics, the controls and computing infrastructure of the ESS constitutes a complex of socio-technical systems. Such systems require agreements and information exchange among different stakeholders concerning technical aspects (architecture, integration, et cetera) as well as managerial aspects. Since the socio-technical systems are both evolving and heterogeneous, the application of Systems Engineering becomes essential.
This section outlines the application of systems engineering to the controls and computing systems by the ICS division at the ESS. The key message is:
For the successful deployment and operation of control and computing systems, the ICS implements Systems Engineering to provide views, informational structures, activity patterns, tools and services suitable for the involved engineering disciplines (control system engineering, computer science et cetera) and controls environment. The ICS Systems Engineering efforts further includes the adoption of system integration strategies, the standardisation of technologies and the standardisation of information management tailored to the ESS goals.
In practical terms, this can be achieved by:
- The provision of a database structure for requirements and templates for requirement specification documents.
- Establishing conventions for the description of system designs, for example by promoting suitable diagram types (block diagrams, internal block diagrams, state transition diagrams, sequence diagrams et cetera) and support for the generation of design documents.
- Establishing conventions for the description of interfaces in Interface Control Documents, including signal list template definitions.
- The introduction and tailoring of document types, for example for managing integration activities and integration risks (see below), and promoting suitable documentation conventions for integration concerns, such as integration dependency diagrams or quality trees.
- Establishing conventions with other stakeholders on the specification of parent systems of ICS deliverables. (ICS control systems are typically components that form a higher level system together with the controlled equipment).
In systems engineering literature, the explicit definition of a set of suitable notations, formats, templates, et cetera, that frame a particular kind of stakeholder concern is called viewpoint definition [157].
2.1. Systems integration strategy
The overarching purpose of systems integration is to provide adequate research support service within the project schedule and budget constraints. Integration activity goals include:
- The identification of critical aspects as early as possible, including technical issues (such as interface compatibility, emergent system behaviour, enabling systems) and external dependencies (organisational and other preconditions).
- The identification of dependencies of the system synthesis activities that transform subsystems to the finally delivered system.
- The successful execution of implementation, assembly, verification and validation activities.
For the successful integration of controls and computing systems in the ESS, ICS is elaborating an integration strategy that provides viewpoints (conventions for expressing engineering information), activity patterns and establishes communication channels that support the integration goals.
Generating and tracking the information in practically viable ways is a challenge. ESS has explored the practical introduction of systems integration management plans as a focal point for integration management. Introducing this document type means the introduction of notations, diagram types or table templates into the practical engineering work. These include:
- Comprehensive functional system descriptions (as opposed to work package scope descriptions).
- Quality trees and tables for system quality analysis, supporting the analysis and trade-off decisions in regard to technical performance, maintainability, system life cycle costs, availability, operational effectiveness, et cetera.
- Integration dependency diagrams, which show for a given system integration points based on prerequisites. Such dependencies can concern progress in standardisation, prototype/generic designs, acquisition, provision of enabling systems, provision of organisational services, or progress in installation and commissioning. Integration dependency diagrams are suitable to explain needs to the project management for resource planning and prioritisation.
Typical control systems (such as input/output controllers and PLCs) form a higher level system together with the equipment under control (EUC). A recurring challenge is that these parent systems, and their control components, are not yet clearly defined. This leads back to the earlier introduction of systems thinking, and the need for comprehensive functional system definitions. The introduction of the outlined integration strategy is another driver for further consolidation of the ESS systems engineering application.
2.2. Standardisation of controls technologies
The introduction of new controls technologies must be carefully managed.
The ESS hardware strategy is based on the different types of applications expected in the project. A compromise is needed in order to keep the number of the different used technologies to a minimum, in order to ensure maintainability over the long-term. Accordingly, ESS has standardised three different types of hardware technologies: fast, real-time signal processing; middle-range I/O; and industrial I/O.
Not all the controls hardware is owned by the controls division. However, the controls division provides the majority of the software and code development effort. Also, this division provides the infrastructure for the deployment and maintenance of the whole controls infrastructure. Standardisation is possible because almost all hardware needs to be integrated into the EPICS control system, which provides controls for different parts of the ESS.
2.2.1. Standardisation tactics
The comprehensive standardisation strategy includes more tactics than just selecting a provider or a type of technology. It also makes the selected technology available to the user, provides documentation and support, and achieves a time to deployment that is as short as possible. Only by providing all of these factors together can users be expected to adopt standard technologies.
Vendor selection. This is the first step of the standardisation process. ESS has chosen to standardise PLC technology by procuring a framework agreement with a PLC vendor.
E2H2C. The ESS Electronics Hardware Harmonisation Committee has the mandate of creating and managing a programme-wide electronics hardware recommendation list. A working group regarding PLC was created inside this committee. This working group aims to be a centralised point of information for all the users of PLC technology in the organisation. This will permit to treat other aspect connected to the standardisation like installation, technology choices or know-how sharing.
Documentation. A set of documentation is prepared including three different guidelines: (1) documentation describing the standard interfaces of any PLC to the control system; (2) PLC Programming Guidelines, (3) guidelines for PLC equipment selection.
3. Software
Almost 40% of the scope of the ICS is related to software that is essential for the facility's function. In general, the approach to control system software is open-source oriented towards community collaboration. These principles of openness and community sharing are manifested in the ESS ICS mission statement: the division shall develop competence and innovative solutions that can be shared in the community through open processes. The ICS software team therefore tries to leverage as much as possible from existing open-source software, and also contributes back to the communities in order to engage and secure long-term maintenance and availability of software systems.
The core of the control system software is based on EPICS [149], which is already developed in a vivid, global, open-source community. Other open-source examples include CSS [152] and the archiver appliance [150].
Standards ICS defines and supports the system platforms and infrastructure required for control system development and operation.
- (i)Linux is the operating system for servers and console computers [158].
- (ii)The core control system is built on EPICS—v4 if possible and v3 where needed.
- (iii)PostgreSQL is the default relational database management system [159].
- (iv)
- (v)
- (vi)Jenkins is used for continuous build, integration and testing [165].
- (vii)JIRA is used for issue workflow and tracking [166].
Languages The following programming languages are supported:
- (i)C/C++ through gcc on Linux [167].
- (ii)ELDK on embedded Linux platforms [168].
- (iii)Java.
- (iv)Python, R, and Julia.
3.1. Configuration management
Control system configuration management is built around centralised data repositories containing modelling information, taking inspiration and ideas from the DISCS collaboration community within which ICS is building applications [151]. Characteristic of the implementation is the high degree of modularity in the architecture and design of the applications. Large monolithic constructions are consciously avoided, in favour of small, reduced-scope, flexible components.
3.1.1. Controls configuration and cable databases
The controls configuration database (CCDB) enables the collection, storage, and distribution of the configuration and modelling data that is needed to install, commission and operate the control system [169]. The CCDB manages the information describing the many physical and logical devices such as cameras, PLCs, IOCs, racks, crates, et cetera that will be in operation, defining device properties and the relationships between them.
Similarly, the cable database (CDB) manages information about cables that are the responsibility of the Machine Directorate's Divisions and its collaborators [170]. The CDB supports the tracking, configuration and labelling of large numbers of cables in all phases of the ESS project—design, installation, maintenance and troubleshooting.
Both the CCDB and the CDB are flexible persistent data stores with general, standardised interfaces. Information in the CCDB (or the CDB) can be provided or consumed by end-users and other ICS applications such as the CDB, the CCDB, or the IOC Factory, enabling them to perform their domain specific functions.
3.1.2. IOC factory
The IOC Factory is software responsible for managing the I/O Controllers [171]. It optimises productivity by providing an automated, consistent, formal and centralised approach to configuring, generating, browsing and auditing the large numbers of IOCs.
The Configure IOC function allows the user to select a set of EPICS modules for a certain IOC to use to interface its devices. As the topology of the IOCs evolves (for example when the layout of devices changes) the user can modify or create a new configuration to cope with the evolution.
The Generate IOC function generates an IOC according to a user-selected configuration. The new IOC is stored in the ESS EPICS Environment EEE server (see below), for development or production, depending on the user selection.
The Browse IOC function allows the user to retrieve, organise and display information about IOCs, current and historical. It gives a broad view and understanding of when, how and why certain IOCs were generated in the EEE server, and by whom.
Finally, Audit IOC tracks the changes that an IOC stored in the EEE server may have undergone.
3.2. Development and runtime environments
Various tools are needed for ESS staff, contributors and consultants spread across the world to be able to build software for commissioning and operations, including EPICS applications, scripting environments, physics simulators, configuration and commissioning tools. New releases of software components are supported, guaranteeing that the global development environment is properly updated. Reproducible environments give users the flexibility to own and customise their environments. New virtualisation technology and a new configuration management system provide a cutting edge development environment in which the entire software infrastructure is described as code that is properly stored in a version control system, and which is tagged, tested, versioned and rolled-back if needed [172, 173]. This enables the synergistic management of both physical and virtual machines.
In addition to EPICS, the following software suite components are provided in the Development Environment:
- (i)
- (ii)OpenXAL is an open source development environment for creating accelerator physics applications [175].
- (iii)Jupyter Notebook is an open source interactive data and scientific environment [176].
3.2.1. Development architecture
A development machine is a virtual or physical machine on which development is performed. ESS EPICS Environment (see above) does not reside on the Development Machine but is instead placed on a centralised physical EEE server that is made available to development machines and control boxes through a network file system (NFS) mount which enables them to access the same files on the server without keeping a local copy. The EEE server is also a boot server enabling ICS computers to boot and mount root file systems. Each partner institute has one EEE server.
The development environment is the software and the supporting infrastructure used for development at ESS and at partner institutions, as shown in figure 98. The main constituents are the Development Machine on which all development is performed, and a centralised boot server hosting the EPICS environment accessible by Development Machines and Control Boxes. One Development Machine is assigned per user and one server per partner institution. Both are released in numbered versions to ensure that a standardised environment is available for all users. Servers at partners are synchronised from the ESS, ensuring stable, updated versions of EPICS related software.
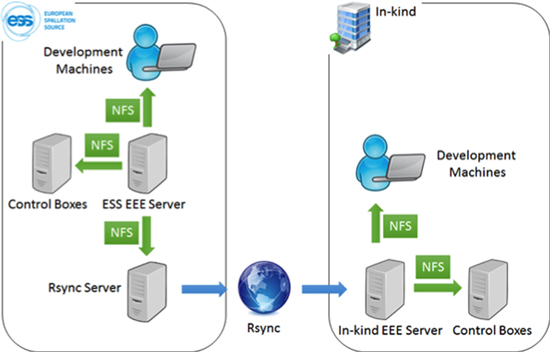
Figure 98. The development architecture, showing components at both the ESS site, and also at in-kind partner institutions.
Download figure:
Standard image High-resolution image3.2.2. Software configuration management
Ansible is an open source configuration management system used to automate the configuration of IT systems, deploy applications and provision software in both new and existing systems [173]. Ansible can also be used for software orchestration, where not only the configuration of the systems is important but also the order in which they are configured. The basic unit of Ansible is the playbook. The main goal of having Ansible is to be able to describe the ICS infrastructure software as code. All the configuration of ICS servers, development machines, and other machines in general is described in Ansible playbooks.
A configuration management system that describes software infrastructure as code enables its configuration to be maintained in a version control system such as Git [163]. Versioning the current configuration enables control of updates, and even allows rollbacks to be performed. ICS uses the Atlassian cloud implementation of Git called Bitbucket [164].
3.2.3. Virtual development environment
Vagrant, a tool for creating virtual environments, lies on top of virtualisation providers such as VirtualBox and VMWare. At ICS, Vagrant is used on top of the VirtualBox. Vagrant enables virtual machines to be described using a configuration file, including references to Ansible playbooks, that installs the appropriate versioned software. This configuration scheme brings a huge benefit when automating the creation and management of virtual machines.
Virtual machines have the key benefit that they can be treated as disposable environments. If for any reason the environment is corrupted the virtual machine can be destroyed and a new one created, within seconds. This gives the user freedom to work with the environment without worrying about breaking it. For this to work, the user's data and code must be kept outside the virtual machine.
Vagrant and VirtualBox provide the concept of shared folders in which the users can maintain source code and important data in their host environment. Code is accessible from the virtual machine, and data can be shared among multiple virtual machines.
3.3. ESS EPICS environment
The ESS EPICS Environment manages the EPICS base, EPICS modules and parts of IOC start-up [177, 178]. Central functions are:
- (i)Build and install EPICS modules for multiple EPICS versions and architectures.
- (ii)Manage all installed EPICS base and module versions within a single environment.
- (iii)Choose EPICS base and module versions against which to build other modules.
- (iv)Choose EPICS base and module versions for a particular IOC.
- (v)Resolve dependencies between EPICS modules at build time and IOC start-up time.
The EEE framework minimises management overhead and provide a fast development cycle. It includes a single standardised structure in which all EPICS base and module versions are installed. An extension of the EPICS build system builds modules for a configurable list of EPICS base versions and architectures, handling all types of resources that a module can provide, handling build dependencies between modules, and installing modules into appropriate locations [179]. An IOC shell command dynamically loads a particular version of an EPICS module, and recursively loads the appropriate versions of all additional dependent modules. The EEE framework also includes a script that adds boilerplate code to an IOC start-up script at runtime, eliminating the need for unnecessary repetition.
Pushing a module with a numbered tag into a Git repository causes a Deployment Server to clone the new module version and install it in the ESS EEE Server, as shown in figure 99. Modules can also be installed locally on an in-kind partners EEE server, tagged with the username that installed them. Such modules do not appear on the ESS EEE server.

Figure 99. EPICS development workflow.
Download figure:
Standard image High-resolution image3.4. EPICS services and supporting applications
ICS engages in the EPICS open-source development and user communities, leveraging from them and contributing software assets in a number of domains.
Archiver The Archiver Appliance is the chosen implementation of a channel access client that automatically records PV values as a function of time and stores them to disk [150, 180]. It can be configured to sample at a periodic rate, or it can post a channel access monitor on a PV. The data can be retrieved for use at a later date using several tools. The Archive Appliance will archive millions of PVs, with the ability to cluster appliances and to scale by adding appliances to the cluster, to reduce the data as it moves into a store, to define system-wide defaults for archiving parameters, and to configure various archiving parameters on a per PV basis. Multiple stages cab be implemented, with an inbuilt process to move data between stages. Support is provided for data retrieval using CS-studio, the archive viewer and Matlab.
Alarms: The EPICS Alarm handler and the CSS BEAST are used to manage ESS alarms [181–184]. All alarms generated by sub-systems are collected by a single dedicated alarm handler, enabling personnel such as operators, engineers and physicists to be notified about abnormal events in the machine, so that faults can be diagnosed or mitigated before restarting normal operations. An efficient alarm system is vital for increasing operator efficiency and reducing downtime. At the same time, alarms information must not overwhelm the operators, especially in complex fault situations. For this reason, it is important that the same design philosophy and rules regarding alarms are applied on all sub-systems.
Save, compare and restore: The save, compare and restore function saves a set of PV values as a snapshot, enabling a comparison to live PV values. It is also possible to restore saved snapshot values. Channel Access Save Restore from the EPICS community will be used during the first part of ESS commissioning, while continuing to evaluate other options including the open-source MASAR and custom development at ESS [185–187].
Channel finder: The name space of the EPICS Channel Access protocol is flat, and does not address the need to configure each application explicitly with all the channel names in which it may be interested. Channel finder, a member of the EPICS software family, is a directory service implemented as a representational state transfer-style web service [188]. It is being integrated with the CCDB, which holds the static information available for all IOCs.
Some other software products are also managed by ICS.
Naming service: The ESS naming convention applies to devices and signals connected to the ICS [189]. Equipment outside of the ICS scope can also be named, if requested. For example, safety valves like pressure relieve valves and manual valves are not connected to the ICS but could nevertheless be named and displayed in the control system operator panels or displays. The naming service includes a web-application to create and manage information about devices names.
User interface tools: CSS, an Eclipse-based collection of tools to monitor and operate large scale control systems, is the standard product for creating user interfaces [152]. It will be used to build most of the engineering screens. ICS will use the following components; CS-studio BOY for display management; CS-studio probe to connect to PVs; CS-studio Data browser as archive viewer; CS-studio BEAST as an alarm server and GUI client; and CS-studio channel viewer for use with channel finder [190].
Role-based access control: RBAC software provides controlled access to parts of the control system, and prevents users from accidentally making unauthorised changes [191]. RBAC does not provide security against deliberate attacks on the control system. Authorisation to write to EPICS IOC PVs is typically determined by the role and/or IP address of the user, and the state of the machine. RBAC protected resources can use an authorisation service to grant access permissions.
Kameleon: Kameleon is a behaviour-rich and time-aware generic simulator at the device level, with a client/server approach [192]. It handles ordinary clients through TCP/IP connections. A client could be an EPICS IOC or a tango device server. Kameleon uses a user-defined file that describes the commands received from a client and, optionally, the reaction to these through statuses sent back to the client. Kameleon will be used for EPICS devices integration, continuous integration and test of IOCs and to model devices with complex behaviour through OpenXAL.
4. MP and personnel safety
The linear accelerator, the tungsten target, and the neutron science systems all require reliable and safe operation.
To be reliable, very high demands are placed on a sophisticated MP strategy, which considers damage in the accelerator and target equipment, as well as direct beam losses due to a mis-steered proton beam. As such, it is treated as a system-of-systems (SoSs) interfacing with equipment systems along the entire linac and target. The concepts, architecture, and systems-of-systems approach in the overall MP strategy is described in detail in section 4.1.
It is essential that the protection and monitoring devices perform as designed, and that the response to any critical failure is appropriate and immediate (on the microsecond timescale). These two high-level requirements are handled by two separate BIS—a powerful programmable logic controller (PLC) based processing BIS, called the slow BIS (SBIS), and a very fast FPGA-based fast BIS (FBIS). The SBIS and FBIS are described in sections 4.2 and 4.3.
Harm to people or to the environment is unacceptable. Tough requirements are placed on the PSS, to reduce these risks to an acceptable level. The PSS follows the IEC61508 standard for functional safety in order to guarantee that appropriate actions are carried out and documented in the design, commissioning, operational, and decommissioning phases. This standard applies to electrical, electronic, and programmable electronic (E/E/PE) safety-related systems, and introduces a set of active safety functions to reduce risk to an acceptable level. These systems are described, together with a few examples, in section 4.5.
4.1. MP overview
In the context of ESS MP the term machine encompasses all elements in the accelerator, target and neutron science system segments—necessary for neutron beam production and further by the neutron science experiments, as seen in figure 100.

Figure 100. Simplified representation of the ESS 'machine'. EUC (equipment under control) from the accelerator segment controls the proton beam state, while the neutron beam state is controlled by the target and neutron science segment EUC, and is influenced by the proton beam state.
Download figure:
Standard image High-resolution imageThe machine is exposed to potential damage from e.g. the proton and neutron beam properties, radiation, electrical power, vacuum, cooling, and RF. The severity of damage is defined with respect to the losses of neutron beam, its duration, and recovery costs [193, 194]. Because of the high operational risk, functional safety standards IEC61508 [195] and IEC61511 [148] are used as development guidelines when addressing the mission-critical PFs.
IEC61508 discerns between EUC and safety-related systems. While the concept of EUC can directly reflect the main components of the ESS machine, the concepts of safety-related system and safety function need to be adapted to reflect the purpose of MP, which relates to operational availability and equipment protection, rather than safety of people or the environment [193].
In practice, this approach is applied to the beam-related PFs addressing high-severity risks, such as long downtimes. Typically, these PFs are addressed by dedicated, hardwired fast interlocks, as described in section 4.3.
4.1.1. Objectives
The basic objectives for MP [193] are: MP shall, in that order, prevent and mitigate damage to the machine, be it beam-induced or from other sources; and MP shall protect the machine from unnecessary beam-induced activation having a potential to cause long-term damage to the machine or increase maintenance times, in any operating condition and lifecycle phase, in accordance with beam and facility related availability requirements.
These goals can be achieved by four major means:
- (i)Designing the EUC with high inherent reliability and overall low damage potential.
- (ii)Minimising the necessity for corrective maintenance and of the mean downtime (MDT) of EUC by introducing dedicated technical systems preventing and mitigating damage.
- (iii)Minimising the MDT of EUC by introducing dedicated maintenance procedures to reduce the probability for unscheduled corrective maintenance.
- (iv)Introducing analysis, management, and recovery tools addressing operational activities related to MP, dedicated to reduce MDT. In an optimal case, potential sources of damage can be completely avoided or effectively mitigated by means of EUC design, for example by EUC system shielding and positioning.
A successful implementation of MP is possible only if a large number of systems, engineered under the responsibility of different groups from different divisions, interact in a well-orchestrated way. Many of the EUC systems do not have MP as their primary goal, which renders the task even more challenging. A systematic and interdisciplinary approach, taking into account the independence of these constituent systems, is crucial for a successful MP implementation and a SoSs engineering approach [196–198] is applied.
4.1.2. SoS architecture
A schematic view of the MP-SoS constituent system classes and their interaction is described below.
Local MP-related systems in the accelerator, target station, and neutron science segments implement the local PFs to keep the EUC protected from non-beam-induced damage and prevent beam from being injected into the linac or sent to the target. These systems implement a LOCAL_PERMIT state, indicating whether the system is functioning correctly, and a BEAM_PERMIT state, which is communicated to the BIS.
The MP-related proton-beam monitoring systems detect any off-nominal states of the proton beam that might cause damage to or radioactive activation of any equipment. The corresponding PFs will stop the proton beam through a BEAM_PERMIT signal transmitted to the BIS. The local MP-related systems for BI detect off-nominal states of the BI systems themselves.
The BIS evaluates the BEAM_PERMIT signals from all local MP-related systems and MP-related proton-beam monitoring systems. If required, the BIS triggers a set of MP-related actuation systems to stop the beam. This sequence needs to be chosen to reach the protection integrity level (PIL) requirements and allow for a quick recovery to normal operation. The BIS will verify the correct reaction of the actuation systems and, in case beam is not stopped, an emergency sequence disregarding any recovery requirements is triggered.
After an interlock, beam production is only allowed to resume once all BEAM_PERMIT input signals are in the expected state and all affected MP-related systems as well as the BIS have been actively reset.
The MP-related beam switch-off actuation systems implement functions to stop the proton beam, i.e. stop proton beam generation and deflect the protons that are already injected into the accelerator to an absorber.
MP Management and support systems consist of e.g. the MP event logging and diagnostics system, which collect logged data from all MP-SoS constituent systems and provides means to perform automated event analysis for diagnostic purposes. As the ESS operating procedures might require an operator to acknowledge the event analysis result before beam operation is allowed, the performance of this system might have a large impact on beam availability. The MP Operating Mode Configuration System sets and reads configuration data to and from all MP-SoS constituent systems. The MP Status and Configuration Monitoring Systems perform online monitoring of the status and configuration of all MP-related systems. Configuration data include the current operating mode, hard-, firm- and software identifiers. This system can request to stop the beam in case it detects a problem.
Identified higher-level safety systems are the TSS and the PSS. Both of those systems need to be in a state allowing for beam, transmitting a BEAM_PERMIT signal to the BIS.
The pulsed operation of the linac relies heavily on the timing system, broadcasting timing events to its client systems. Proton pulse generation is controlled by the Timing System. However, it will also be used to broadcast operational mode information such as pulse length, repetition rate, and beam current.
The different actions that the ESS MP systems can perform related to the beam are listed in table 50.
Table 50. Overview of the MP-related beam switch-off actuation systems.
| Actuation system | Action |
|---|---|
| Timing system beam pulse inhibit | Prevent the timing system from generating the timing system events that lead to a proton beam pulse. This prevents proton beam from being injected and accelerated. |
| Proton source 'soft' off | Prevent the proton source from injecting protons into the linac by inhibiting the proton source control electronics. |
| Proton source 'hard' off | Switch off the HV power to the proton source using redundant contactors. |
| LEBT chopper activation | Activate the low energy beam transport chopper to deflect the beam onto the LEBT dump. |
| MEBT chopper activation | Activate the medium energy beam transport chopper to deflect the beam onto the MEBT dump. |
4.1.3. Challenges
The introduction of standard-based functional safety concepts when designing an accelerator-driven facility implies various challenges. The unfamiliarity with safety standards can result in uncertainty about their suitability for MP purposes. The estimation of potential extra efforts, staff competence needs and the added value can be difficult to anticipate. The practical application of the standard—that is, tailoring the standard to the particular system and project—requires a balance between rigidity and pressing schedules. Building the organisational support for this approach can constitute a significant communicative challenge.
4.2. Slow BIS
The SBIS compiles the different BEAM_PERMIT signals, using AND or OR gates, from the slow local protection systems (LPS), including magnets, interceptive devices, target, vacuum, etc. In case a LPS is not ready for beam operation, the SBIS sets the BEAM_PERMIT to NOK (Not OK) and inhibits beam using the actuator systems, seen in figure 101. The SBIS will is designed with high dependability. In order to achieve the required level, an interlock system based on PLC technology, software programming tools, PROFINET fieldbus networking for distributed I/O, and current loops for hardwired interlock signal exchanges is used.

Figure 101. General functionality of the Slow Beam Interlock System.
Download figure:
Standard image High-resolution image4.2.1. Architecture and hard-wired interfaces
The architecture of the SBIS is based on the typical PLC-based solution with distributed periphery, i.e. a PLC CPU with a fieldbus interface (PROFINET), which connects several distributed I/O cards, powered by redundant power supply modules.
The basic principle of interfacing with the different slow LPS is based on current loops. The exchange of hardware signals is performed using failsafe logic. Nominal operation of the system is represented by an active signal. An active signal corresponds to a flowing current in the loop, whilst a deactivated signal or a loss of the power supply results in a safe state of the system, i.e. BEAM_PERMIT is set to NOK.
Figure 102 illustrates an example of the signal exchange between three LPS and the SBIS. The PLC, which implements the SBIS functionality, generates the current of each current loop. A 2-out-of-3 solution (3 current loops per LPS) is assumed, providing the best balance between safety and availability [196]. Two possible openings of each current loop can take place. One done by the SBIS itself as a consequence of a comparison between the three actual current values, and another one by the corresponding LPS as a consequence of the internal logic (state machine) currently running on it, generating the signals BEAM_PERMIT_MP, BEAM_PERMIT_ID and BEAM_PERMIT_TP. Here, MP stands for Magnet Powering, ID for Interceptive Devices and TP for Target Protection, as in figure 102.

Figure 102. The principle of SBIS current loops.
Download figure:
Standard image High-resolution imageFigure 103 describes how the software and distributed logic works. On the SBIS PLC side, a voting and comparison is done with a minimum and maximum current value and, as a result, the corresponding input to a BEAM_PERMIT AND gate is generated resulting in the current loops being either opened or closed. On the corresponding LPS PLC side, the state machine logic determines the actual value of the second input to a BEAM_PERMIT AND gate. If any of the inputs results in a BEAM_PERMIT NOK, a beam stop is triggered.

Figure 103. The distributed logic of the SBIS.
Download figure:
Standard image High-resolution imageMeasuring the actual current flowing through the current loops allows for detecting short circuits, the main enemy of current loops, by reading an unexpectedly high current value. It is also possible to perform self-checking and control actions (state machine running in the SBIS itself) by opening the corresponding switches.
The use of hardwired interlocks also prevents agains malfunctions or spurious triggers caused by the pulsed nature of the facility due to the higher noise immunity due toe the low impedance.
Diversity can easily be achieved in the SBIS by adding additional PLC CPUs or a PLC module with an integrated FPGA, that are able to evaluate the status of each current loop (closed or open), perform voting using a digital input module, and act over an additional switch located in the corresponding current loop.
4.2.2. Interlock software design
The design of the software implemented on the SBIS PLC follows a formal approach, involving the design of finite state machines described in an oriented graph, and the extraction of a set of logic state and output equations.
Redundant software for current loop control is used as the engineering tool for software dependability improvement. This way, due to the achieved fault tolerance and redundancy, the probability of software errors is reduced and the reliability of the system can be increased. To perform the implementation of this technique we propose to use: redundant and independent programmes running in two SBIS CPUs using different compilers; independent processing units, such as a standard PLC CPU and a PLC FPGA-based CPU (Boolean processor); and independent and diverse sensing and actuating equipment.
For the sensing equipment, the PLC CPU system uses analogue input modules, and the PLC FPGA-based CPU or boolean processor uses hardwires connected to the current loop. For the actuating equipment, the PLC CPU system uses relay output modules, and the boolean processor uses discrete relays.
4.3. Fast beam interlock system
The FBIS collects the BEAM_PERMIT signals from the fast protection devices along the linac, and transmits a BEAM_PERMIT NOK (Not OK) to stop beam operation in case this is required. The fast protection devices consist of BLMs, BCMs, and BPMs, together with LPS LLRF. As a parallel BIS to the SBIS, as described above, the FBIS is instead based on FPGA-technology for very short processing times. Just as the SBIS, the FBIS will transmit a withdrawn beam permit to the actuators for stopping the beam.
The requirements on the FBIS are many, where high reliability and availability demands are combined with a very fast response time, remote monitoring, and the possibility to effectively deal with some 300 input signals. As the FBIS needs to be operational at any given time, while keeping the number of false beam trips and blind failures at a minimum, the development is supported by rigorous FMEDA. These analyses pinpoint weak links in the design, and make sure that blind failures (a missed beam stop) fulfil the stringent integrity requirement (see PIL definition below) at the same time as the false beam trips are kept low. In order to balance protection and beam availability, some system settings are kept flexible enough to be tuned as commissioning proceeds.
4.3.1. Electronics environment
The environment in which the system is located plays an important role when defining the system architecture and distribution. Just as the other electronics for operation, the FBIS will be installed in the klystron gallery. Equipment racks will be grouped in two rows of eighteen racks, housed in a cooled enclosure to fulfil the temperature stability requirements for the RF system. There are 24 enclosures in total along the linac Due to the confinement of these enclosures and requirements for each of them, it can be difficult to distribute cables in and out. It is important to have this factor in mind when defining the location for the different electronics.
Additional non-physical factors like electromagnetic noise impact on the performance level of a system. The FBI system is designed in a way that this noise does not damage the electronics and does not impact on the beam availability of the accelerator. Special attention is given to the selection of cables and connectors, focusing on shielding and good noise immunity but not compromising price and installation cost significantly.
4.3.2. Hardware
To fulfil the requirements of the FBIS in the ESS rack environment, the system is modular, with its distribution and interconnections made of optical fibre. There are four different modules that follow the architecture of rack enclosures along the linac:
Device interface module (FBI_DIF): The LPS and BI devices connect to FBI system through the FBI DIF. This module offerw a wide input range—from 3.3 to 36 V—to simplify the connection from FPGAs to PLC devices. Hence, the main function of this module is to collect all signals from the related input devices and translate into a more robust and standardised FBIS signal.
Master module (FBI_M): The FIB_M is the concentration point in each rack enclosure, collecting all FBI_DIF signals. Based on these, it decides if the BEAM_PERMIT is removed or not.
Master-of-masters module (FBI_MoM): The FIB_MoM is the final concentrator that collects the BEAM_PERMIT from all FBI_M and finally determines if beam is stopped. If beam is stopped, the FBI_MoM synchronises the beam stop. This module is crucial to beam operation and will receive additional features to ensure a fast detection and high reliability.
Actuator module (FBI_A): The FBI_A is an interface module connecting to the actuators. It also connects with other devices, such as the SBIS, to allow for additional actuation when needed. Due to the criticality of this device, the design of this module uses redundancy and active protection elements to avoid blind failures. The design offers diagnostic capabilities to monitor the status of each BEAM_PERMIT signal path.
4.3.3. Distribution
The system is designed to minimise the number of cables going in and out of the distributed rack enclosures, allowing for faster installation and system maintenance. The use of one FBI_M per enclosure ensures a reduced number of cables together with full diagnostic capabilities for the FBI_M and also for the FBI DIF. A schematic overview of the distribution of the four different FBIS modules, as located in the rack enclosure and connected to the LPS and BI monitoring system at one end and the actuators in the other, is shown in figure 104.

Figure 104. The signal path through the FBIS modules, from local protection systems and beam instrumentation to actuators.
Download figure:
Standard image High-resolution image4.3.4. Intermodule connections
The FBIS uses optical fibre cables to connect the modules, while copper cables are used only at the inputs and outputs of the system. That is, the connection with the LPS, beam monitoring, and actuator devices.
In order to achieve a stable and simple optical link, an FPGA with an integrated serialiser is used, reducing the number of elements. Small form-factor pluggable (SFP) modules are used to translate the high-speed serial signals from the electrical to the optical domain, while monitoring the fibre degradation.
The transmission of the beam permit is realised through continuous data packets with timestamps over a gigabit link, creating a fast and dynamic BEAM_PERMIT path, with easy detection of lost data and broken or corrupted links. To extend the lifetime of the optical link and withstand some level of optical degradation, the selected SFP modules have an extended capability of 10 km for the 600 m of connection.
4.3.5. Firmware and software
The firmware and software of the FBIS balance flexibility and protection. While some critical inputs are forced to be considered at all times, others allows masking in case of hardware malfunction, when maintenance cannot be performed immediately.
The system settings are implemented through a register base table where changes are protected against unintentional write. Additionally, changes are logged in the memory and displayed in the expert console. Double write sequences to different address spaces are necessary for any system change. The masking of any input is not be possible without an accompanying timer value. This timer forces the input settings to default values (listening mode) after the timer has expired. The timer is limited to a pre-set time, in order not to hide or forget the error, e.g. after an operator shift change.
4.3.6. Self-testing function
In order to ensure that the FBIS is ready for beam operation, a self-testing feature is introduced from the input of the FBI_DIF to the FBI_M. The self-testing add-on discovers any broken links, including between the input device and the FBIS. Periodic full system tests—from LPS and beam monitoring to the actuators—are executed after each technical stop, ensuring full FBIS and input device functionality.
4.4. Failure modes and PFs
Although the MPS is not obliged to follow any certification process or standard, a clearly defined strategy is in place to reach consensus on the acceptable risks of equipment damage and production losses. These risks are balanced with the high reliability and availability requirements of the facility. In order to reach a quantitative consensus and to prove agreement with the ESS goals, a set of analyses are performed for the MP-SoS in general and the BISs in particular. The approach used for the FBIS, described below, is also applied to the other systems.
4.4.1. Failure modes, effects, and diagnostics analyses
Continuous FMEDA are performed as part of the iterative design of the FBIS, in parallel with the development of the system architecture. These analyses highlight possible failure modes and place them in relation to the overall operation. Each type of failure in each component is associated with an overall failure mode on the system as a whole. There are four failure modes for MP-related systems: negligible; maintenance; false trip; and blind failure [197].
A negligible failure does not have any effect on the system performance and can be temporarily ignored. Maintenance failures require maintenance only after the current 10 d ESS run period. A false trip failure leads to a beam stop, even though this was not needed. Thus, false trips decrease the reliability and their rate needs to be minimised. The most critical blind failure mode does not stop beam, even though a hazard requires a trip. Such a failure can lead to equipment damage, and in severe cases to long downtimes to recover from damage.
Each failure is mapped onto one of four diagnostic capabilities: hidden; inspection; diagnostics; or test. A hidden failure cannot be found without removing a piece of equipment and studying it in the lab, requiring significant labour. Inspection requires manual inspection, for example observing a light emitting diode indicator, to locate a failure. Diagnostics uses the built-in diagnostics mechanism in the circuitry of the FBIS. The Test capability uses the self-testing function described above.
4.4.2. Risk assessment strategy
An overall risk assessment strategy is in place to achieve acceptable operational risk, including a preliminary hazard analysis PHA and a purpose-oriented risk matrix. The risk of each hazard is estimated as a combination of the probability of occurrence and the consequence. The assessment of each hazard, to see if further protection is required, is based on MP goals and system requirements [193]. If further active protection is needed, the hazard receives a PF with an associated PIL, following the concepts of safety function and safety integrity level (SIL) used in the IEC61508 standard [195].
The MP strategy also targets risks related to overall hazards, and maintains a holistic view of the facility, in addition to targeting single hazards. Individual hazards that are acceptable in the risk matrix can add up to an unacceptable overall risk, requiring additional PF to be defined. Design and analysis are iterated until the MP strategy is in place and the requirements are fulfilled. A holistic strategy makes it possible for one PF to protect against several hazards, at the same time that one hazard is addressed by many PF.
4.5. Personnel safety systems
Providing and assuring safe conditions for personnel is essential. ESS is responsible for developing all of the PSS, including design, manufacturing, commissioning and operations, in accordance with the IEC61508 standard, and with regard to functional safety for electrical/electronic and programmable electronic safety-related systems [148, 195].
Hazards: Various radiation and other hazards have to be considered during different phases of the ESS lifecycle. The PSS primarily protects both the public and the workers from the ionising radiation hazards, generated by particle beams and x-rays. But the PSS also identifies and mitigates all other potential hazards, including: cryogenic (burns, ODH); electrical; magnetic fields; lasers; motion; chemicals; and gas (explosion, ODH).
Scope: Ten main PSS systems are required to be commissioned, validated, and operational for first beam: the on-site cryogenic module test stand; the accelerator PSS; the accelerator radiation monitoring system; the accelerator oxygen depletion system; the target PSS; the target radiation monitoring system; the target hot/maintenance cell PSS; the neutron instrument LoKI PSS; the neutron instrument NMX PSS; and the neutron instrument ODIN PSS.
Standards and risk reduction: The international standard IEC61508:2010 [195] provides the best practice for PSSs and safety-instrumented systems, according to the consensus of facilities within the accelerator research field, in which it is widely adopted. The PSS will also meet both chapter 10 (review of control systems) of the Swedish Radiation Authority's standard SSM2014-127-1, (Review of application for licence for activity involving ionising radiation), and also their standard SSMFS2008-27 (Regulations concerning operations at accelerators and with sealed radiation sources) [198, 199]. Three layers of risk reduction ensure that the residual risk—the probability of a hazardous event occurring even with the safety functions in place—is less than or equal to the maximum tolerable risk.
Subsystems: To enable compliance with the standards, each PSS comprises two fail-safe, physically separated, and independent systems—a two-train system. Each PSS consists of four subsystems:
- (i)The access control system ensures safe entry into potentially hazardous areas.
- (ii)The safety interlock system turns off the proton beam very quickly.
- (iii)The radiation monitoring system uses neutron and gamma detectors placed near all radiation areas.
- (iv)The ODH monitoring system monitors oxygen concentration levels in the AT and in other areas with an ODH.
This leads to a rather complex PSS control system, with around 2500 inputs and outputs. Safety functions are isolated from the standard control systems and networks.
Implementation methodology: When a fault occurs a fail-safe (F-PLC) controls processes and immediately switches to a safer state, or maintains the current state. Using PLC technology reduces complexity significantly, compared to an alternative that includes safety relays and programmable relays. Each PLC operates in either standard or fail-safe mode. The latest generation of Siemens F-PLCs are used to implement the PSS safety concepts, satisfying safety integrity level SIL3 in accordance with IEC 61508:2010. Two independent Siemens S7-1518 F-PLCs are used for functional safety implementation, principally through safety functions in the software contained in the safety-related user programme, with fail-safe inputs and outputs. All sensors and actuators for PSSs are connected locally to the Siemens ET200SP distributed I/O stations with fail-safe I/O modules. Safety components remain active even during power outages, since all safety equipment is powered by uninterruptible power supplies.
Fail-safe input/output: Fail-safe input/output (F-I/O) modules ensure the safe processing of information received from sensors and sent to actuators, such as emergency stop pushbuttons, light barriers, and power supply contactors. They contain all the hardware and software components necessary for safe processing, in accordance with the required SIL. Two F-I/O modules are available for the ET200SP distributed I/O system: the fail-safe digital input modules (F-DI) that detect the signal states of safety-related sensors and send the relevant safety frames to the F-CPU; and the fail-safe digital output modules (F-DO) that are suitable for safety-related shutdown procedures with short circuit and cross-circuit protection up to the actuator.
4.6. Software
The automation software for PSS is developed using the latest version of Siemens SIMATIC STEP 7 Professional (TIA Portal v13). Safety checks are automatically performed in the software and additional fail-safe blocks for error detection, and error reactions are inserted automatically when the safety programme is compiled. This ensures that failures and errors are detected and appropriate actions are triggered to either maintain a safe state or move to a safe state.
A general safety function block is mplemented for each type of important safety element, such as beam off stations and ODH scanners. After defining all the safety functions for the 2500 or so F-I/O-s, the safety actions and triggering events (i.e. the conditions under which a specific action must be performed) are performed. After all the triggering events are defined, they are translated to boolean expressions, which can then be used as a basis for developing of the PSS safety control system.
The ESS Design: Conventional Facilities
Malin Aberg, Kajsa Breimer
European Spallation Source, Lund, Sweden
E-mail:
The term CF refers to the spaces required to house the ESS research equipment, machines and instruments and to accommodate the human beings who either make use of the facility directly or support its operation and maintenance, be they ESS staff, guest researchers or visitors. The overall goal of the CF project is to deliver the physical space for a sustainable research facility in a sustainable way, within budget, according to schedule and with the proper function and quality.
The CF team must ensure that the correct input for the design and construction works is given by the internal stakeholders. Therefore comprehensive coordination with stakeholders such as the environment, safety and health, accelerator, target, neutron scattering system and ICS divisions is needed. CF is divided into three organisational units, where design and construction handle the more industrial-like buildings that house the machine, instruments and utilities. The third organisational unit, Campus, focuses on the reception, offices, labs and visitor facilities.
Construction works on the ESS site commenced in the summer 2014. This means that the CF design is developed simultaneously with construction works. Also, the accelerator, target and instruments are being designed in parallel with CF design and construction.
1. Architectural concept
ESS will be one of the most advanced science infrastructures ever built. The scientific and symbolic value of the facility for the university town of Lund, Sweden and for the global science community calls for a work of architectural and functional excellence. The size and location of the facility demand creative and innovative ideas for landscaping and transportation infrastructure. The summer of 2012 saw the launch of the architectural design competition for ESS with 24 participants from all over Europe. In addition to the overall quality of the architectural design, there were five criteria for evaluating entries: flexibility; economic feasibility; functional feasibility; safety; and sustainability and environmental impact.
In February 2013, the ESS Board endorsed the final decision of the board, and selected Henning Larsen Architects A/S in collaboration with COBE ApS, SLA A/S, and NNE Pharmaplan A/S to become the ESS architects. Their proposal excels in many aspects, providing the facility with a clear concept for the overall design of the site as well as suggesting suitable building types and designs for the various functions, as shown in figure 105. The centrepiece target building is characterised and instantly recognisable by its overhanging, oval roof. The unifying roof symbolises the tungsten disk used in the Target Station, and the buildings scattered around it are the neutron spallating from the disk. These visual metaphores gives good flexibility for future expansion as new added buildings will strengthen the concept. The scattering is also reflected in the landscape with trees in clusters.

Figure 105. Conceptual illustration of the ESS facility, with Science Village Scandinavia and MaxIV in the background.
Download figure:
Standard image High-resolution image2. Design and construction
2.1. Licenses
ESS needs permits for construction and operation. Due to the generation of radioactive waste during operations and the need to lower groundwater levels during construction, ESS needs an environmental permit. The permit was granted in June 2014, and the conditions cover areas such as chemical products, hazardous waste, noise wastewater and storm water. The conditions in the permit, together with commitments that ESS has made in the application, affect CF design and construction in various ways. For example, the construction works have to be planned so that noise levels during construction are contained. Furthermore, a system of detention ponds has been designed and constructed, which allows particles in the storm water to sediment and also levels the outgoing flow of water so that the dimensioning flow of the drainage companies can be contained.
ESS also needs a permit from the SSM; this process takes a graded approach, consisting of five different permits. The first permit was granted in July 2014, just after the environmental permit, allowing site preparations and construction works to commence.
The buildings that CF are designing and constructing will house equipment that generates ionising radiation, and some CF components will be activated as they are exposed to radiation. Furthermore, CF structures and components play an important role in the protection of workers and the public from exposure to radiation; CF structures will serve as shielding, systems such as ventilation may serve as safety functions in certain parts of the facility, and CF structures and components may protect other safety functions.
2.2. Layout
The property where ESS is being built is located in Brunnshög, an area northeast of Lund making the facility located close to a densely populated area, as shown in figure 106. The ground level varies between +74 and +81 metres above sea level with the highest part in the south western part of the property. This area is characterised by a flat and open agricultural landscape and extensive archaeological excavations made prior to construction start shows that farmers have been using these grounds from the stone age, 4000 BC to 3300 BC, and onwards. Large-scale agriculture is still the dominating land use in the area to the north, east and south of the ESS site. Today the landscape is criss-crossed by infrastructure in the form of roads and railroads. The ESS site comprises 69 hectares and will be visible both from the motorway E22 that passes on the west side, as well as from the local road Odarslövsvägen on the east side.

Figure 106. The ESS facility with a view towards central Lund and Malmö and further on towards the Öresund bridge and Copenhagen.
Download figure:
Standard image High-resolution imageSouthwest of the ESS site, the light synchrotron facility MaxIV is located. Between MaxIV and ESS, an area called Science Village Scandinavia is being developed, which will offer common infrastructure and service for the two research facilities.
2.3. Buildings
The facilities for ESS consist of 26 separate buildings, most of them technical utility buildings of an industrial nature. All but one (a small pump house) are shown in figure 107. The main parts are the accelerator buildings, the target station and the experimental halls. To support these there are utility buildings, laboratories and buildings for logistical functions. The campus area is also located within the ESS perimeter, housing the offices, laboratories and workshops, for employees as well as for visiting researchers.

Figure 107. Location of the different buildings within ESS.
Download figure:
Standard image High-resolution image2.3.1. Accelerator buildings
Included in the accelerator buildings are the AT, the klystron gallery and the cryo-compressor building, as shown in figure 108.

Figure 108. 3D model view of the accelerator buildings.
Download figure:
Standard image High-resolution imageThe 559 m long tunnel houses the linear accelerator with the ion-source placed in the FED at the far east end. The tunnel itself is of a cut-and-cover in situ cast concrete structure with the internal measures 6 m wide and 3, 5 m high. It is located underground and rests on over-consolidated clay. The tunnel runs on a dividing ridge with the groundwater level approximately at the foundation level, making exterior drainage not necessary. A five metre thick earth berm will cover the tunnel for shielding reasons as well as making it visually disappear into the surrounding landscape. Along the tunnel are four emergency exits and one loading bay for equipment and material.
Parallel to the tunnel, but located over ground is the two floor building, the klystron gallery. Here are power convertors, RF-transmitters, instrumentation and controls placed. The tunnel and the gallery are connected through 27 culverts, so called stubs, where waveguides and electrical cables connect the accelerator equipment in the different buildings. The stubs are built as chicanes in order to stop radiation from escaping the tunnel during operation.
Behind the gallery is the cryo-compressor building. This important building contains the two cryoplants needed during operation of the ESS facility. Through installation galleries from the building to the AT and the target building, cryogenic distribution lines distribute cooling to the accelerator and the target moderators.
2.3.2. Target building
The western end of the AT is connected to the target building which houses the target station systems, shown in an architectural rendering in figure 109. This is where the proton beam hits the monolith with the tungsten wheel and the neutrons are emitted. The monolith and all target systems are highly complicated systems with high demands on servicing systems and safety barriers, hence requiring a building that can interact and meet these needs.

Figure 109. Architectural rendering of the target building with its oval roof.
Download figure:
Standard image High-resolution imageThe main areas of the target building are the A2T area, the monolith area, the active cells where activated material is remote handled and stored, utility areas and above it all, a high bay area with a large overhead crane. In the western end the main control room will be located, where all processes at the entire ESS site will be monitored around the clock.
A number of structural issues are highlighted in the target building, as shown in figure 110. Heavy loads on overhead cranes place emphasis on the right choice of loadbearing structures. The high demands on shielding capacity put high demands on the structural elements. Shielding is also incorporated into the concrete structure, either in form of extra thickness or additional heavy concrete. Safety demands for rigidity and earthquake scenarios add further requirements to the building. The vast roof, giving this building its unique look, is also adding to the loads.

Figure 110. Section of the target building.
Download figure:
Standard image High-resolution imageEven though geotechnical conditions are very good, a piled foundation is necessary to meet the extreme deflection limits and loads. The high safety requirements on the building in the event of an earthquake has resulted in different types of piles; large bored piles as well as steel core piles.
In addition to meeting all the demands placed on the structure, the building must have excellent logistics and provide workspaces that are comfortable and functional.
2.3.3. Experimental halls and laboratories
Directly connected and on either side of the target building are the large experimental halls. This is where the experimental stations, referred to as instruments, will be located. The size of the halls enables both short and long instruments, ranging from distances around 50–150 m to the monolith. Instruments will be built and altered throughout the entire lifetime of ESS, hence requiring flexible and expandable building concepts. The reinforced concrete base slabs have differentiated thickness to meet variable loads and the loads from the instrument shielding. Galleries underneath the slabs are used for efficient system installation distribution to the instruments. Structures must be adjusted not to block areas in the beam port sectors. Steel superstructures will support the high capacity overhead cranes that cover the halls and that are needed to lift and install shielding blocks and instruments. For the same reasons as the target building, the experimental halls require a piled foundation. The types of piles used here is concrete piles.
Connected to the experimental halls, as well as inside the halls, there are laboratories and workshops for different purposes as well as offices and meeting rooms.
2.3.4. Technical systems and utility buildings
To serve and operate the complex buildings, systems are needed to support the ESS site. Some of these systems are so extensive that they require buildings of their own.
For optimisation, both technically and economically, some support systems are centrally located in a single central utility building (CUB). From here all heating and cooling emanates and is distributed around the site to all buildings to provide the ventilation systems and ESS equipment. The CUB plays a major part in achieving the energy goals set up for ESS, described in detail further below in this article. Deionised water and compressed air are also systems that emanate from the CUB and distributed site wide. The CUB is split into different fire compartments and the systems have redundancy and back-up power supplies to ensure high safety, good maintenance level and high reliability.
For other HVAC needs, local systems are provided in each building to suit the specific requirements and building usage.
In buildings where it is required, sprinklers are provided. This system is fed from a central sprinkler building, where domestic water is supplied to storage tanks and then pumped via a ring main to valve chambers within the relevant buildings from where it is distributed to form a full cover of the required areas. The ring main also serves water hydrants for use by the fire brigade around the facility with a total capacity of 850 cubic metres of water for fire extinguishing purposes. To create redundancy in the system, there are both electrical pumps as well as one diesel engine powered in case of an electrical failure.
For electricity, the local power company provides a 20 kV dual supply fed from their 130 kV distribution network station, located at site, which feeds into a primary substation. From here a site wide 20 kV electrical system distributes power to several locations around the site where substations are installed with transformers to reduce and distribute low voltage to both the buildings and the machine. From each substation switchgear, low voltage is distributed to power distribution boards for small power and lighting, power boards for HVAC equipment and extra low voltage (ELV) systems along with switchgear for ESS to connect their equipment.
The ELV systems consist of a communication network, integrated security system (including the CCTV, intruder alarm and access control) and fire alarm including evacuation alarm. Each system is effectively a stand-alone system but is presented in a common software system within the integrated security system. Wi-fi, mobile and radio systems are provided across the facility.
In all areas of the facility the systems described above will be controlled and monitored by the building management system. This system will interface with other ELV systems in particular the fire alarm system where on receipt of signals will control the ventilation. Monitoring will consist of collating information on alarms and power consumption of all systems. The building management system communicates directly with the ICS, which controls and monitors the ESS equipment and the PSS.
2.3.5. Service buildings
The logistic functions needed to operate a facility like ESS are extensive. The buildings and services might as well be affected by the high requirements on radiation safety and security to and from the public.
The main security checkpoint and general services provided for all users will be located at the entrance gate towards Science village, providing a clear point of entry to ESS for all users, staff and visitors. The guardhouse is an active part of the security perimeter and must therefore fulfil the same requirements on all aspects of security.
A waste building is needed to house functions for collecting all types of radioactively contaminated waste produced in supervised and controlled areas of the ESS facility. The need for collection and management of the waste in a dedicated facility relates directly to SSM top requirements for ESS operations. The main features of the system consist of the building with separate sections for treatment of liquid, solid and other waste and the surrounding tarmac area for loading and storage of containers. The waste building is connected to the Target Building and the Experimental Halls with a subterranean culvert with ducting for transport of waste liquids produced in these buildings.
2.3.6. Campus area
The campus area is located just behind the entrance at the guard house, on the path leading up to the target building, as illustrated in figure 111. The office building will provide 450 workplaces and office space for ESS employees and guest researches. Located on the ground floor are common multi-purpose areas, such as a canteen and an auditorium. These areas will also serve as venue for conferences, exhibitions and special events. The workshop building contains almost 3000 sqm of workshop area for the different technical divisions as well as an ESS common machine workshop. The layout is built on open collaborative spaces and here one will find workshops for areas such as metrology, choppers, detectors and cryogenics.

Figure 111. View of the campus concept, with the office building to the left, the workshop building to the right, and the target building in the background.
Download figure:
Standard image High-resolution image2.4. Construction contract
2.4.1. Skanska and collaboration
Because of the complexity and the schedule, it was decided that the construction should be managed with a collaboration contract between CF and a contractor. After an extensive procurement process during 2013, a construction contract was signed with Skanska ESS Construction HB in February 2014. The scope of the contract includes all the industrial buildings (but not the campus), landscape, the infrastructure for the facility, and a design involvement, in order to make sure that the most efficient construction processes and solutions are used. The management organisation for the contract includes staff from both ESS and Skanska, working in one single organisation.
In June 2014, after the necessary permits were granted, construction works at site began. The works started with site preparations, and in September the same year, after a ground breaking ceremony, the earthworks for the AT commenced.
2.4.2. Status at point of writing
Figure 112 shows, at the time of writing, the concrete structure of the AT is finished and internal works such as painting and electrical installations are ongoing. The superstructure of the adjacent klystron gallery is almost completed and the two substations ready and operational. Concrete works at the Experimental Halls are ongoing.

Figure 112. Aerial view of the ESS construction site, July 2016.
Download figure:
Standard image High-resolution image3. Energy and sustainability
ESS will be the world's first sustainable research facility. One of the major challenges to accomplish this will be the facility's energy use and costs related to it, and therefore the energy concept of ESS is one of the primary tools for realising the goal. In addition to the energy concept, other sustainability-related topics of relevance to ESS, e.g. BREEAM certification, biodiversity and sustainable selection of materials are presented.
3.1. Energy concept
ESS is committed to an energy concept that consists of three parts: Responsible Renewable Recyclable.
Responsible means that the facility shall use as little energy as possible. In the site selection process an estimated electrical energy demand had been calculated to an annual 600 GWh, while ESS is committed to stay below 270 GWh per year. In order to reach the targeted energy demand every aspect of the facility needs energy efficient design. Every year, the inventory of energy flows and temperature levels is updated. Thus, future energy-related operations costs can be predicted for the possibility to lower these as much as possible for the benefit of science.
Renewable means that all energy supply must derive from renewable sources. The rationale behind this promise is that when ESS is fully commissioned, the power consumption in Lund will rise by 20%–30%. The extra load on the Nordic power system would require power compensation from marginal electricity production that is currently based on fossil fuels to a substantial extent. The renewable aspect therefore also includes the development of new renewable sources additional to the current energy market to be provided by the electricity supplier.
The facility is committed to recycling the surplus heat from the facility's operations. The surplus energy consists of hot water that is a result of the cooling processes in the facility. The cooling processes operate at different temperature levels, therefore the surplus heat will be delivered at different temperatures. While high-temperature waste heat can be directly transferred and recycled in Lund's existing district heating network, lower temperatures could be used in either district heating networks operating at lower temperatures or in food production systems. Currently, work is ongoing in order to find an optimal solution for the ESS context.
3.2. BREEAM
ESS is committed to certify the buildings and landscape according to the internationally recognised environmental assessment method for buildings, BREEAM. The BREEAM system gives the freedom to choose among different possible credits in order to arrive at a final rating. The credits are distributed among nine different areas:
- Management,
- Health and wellbeing,
- Energy,
- Transport,
- Water,
- Materials,
- Waste,
- Land use and ecology and
- Pollution.
Only buildings that are permanently occupied can be BREEAM certified. Furthermore, each building must be individually certified. For ESS, this means that eight different buildings will be assessed according to BREEAM. However, many credits are common to all the buildings certified, e.g. the credits within land use and ecology, which mainly has to do with the landscape. The targeted overall final score for the buildings is Excellent, which is the second highest possible score on a six-point scale.
3.3. Ecological inventory
An ecological inventory has been carried out at the ESS property Odarslöv 13:5, as part of the BREEAM work. The inventory showed that the ESS site prior to construction was dominated by a monocultural planting strategy, which from a preservation perspective has no real value. There are certainly smaller areas on the site, which could be suitable for preservation; the marlpit, the transition areas between fields and roads, and a pond. However, in general the area does not contain plantings, habitats or ecological systems which cannot be restored or are of high value from an ecological point of view.
During the time ESS borrows the excellent-quality farmland for research purposes, the ecosystem services of the property is changed from food supply to ecosystem support. The productive monoculture is exchanged for increased biodiversity. In order to improve the ecological value of the site the topography will be changed into a more varying terrain and native vegetation will be implemented, with the landscape concept shown in figure 113. The terrain, ponds and vegetation create a broad variation of habitats with different microclimates, hiding places, water and food supply, green corridors and nesting sites. Flowering and fruiting species are chosen to enhance pollinating insects, bees and birds while shallow ponds improve the living conditions for amphibians. The rich fauna also contributes to a recreational environment for visitors, locals and employees at ESS.

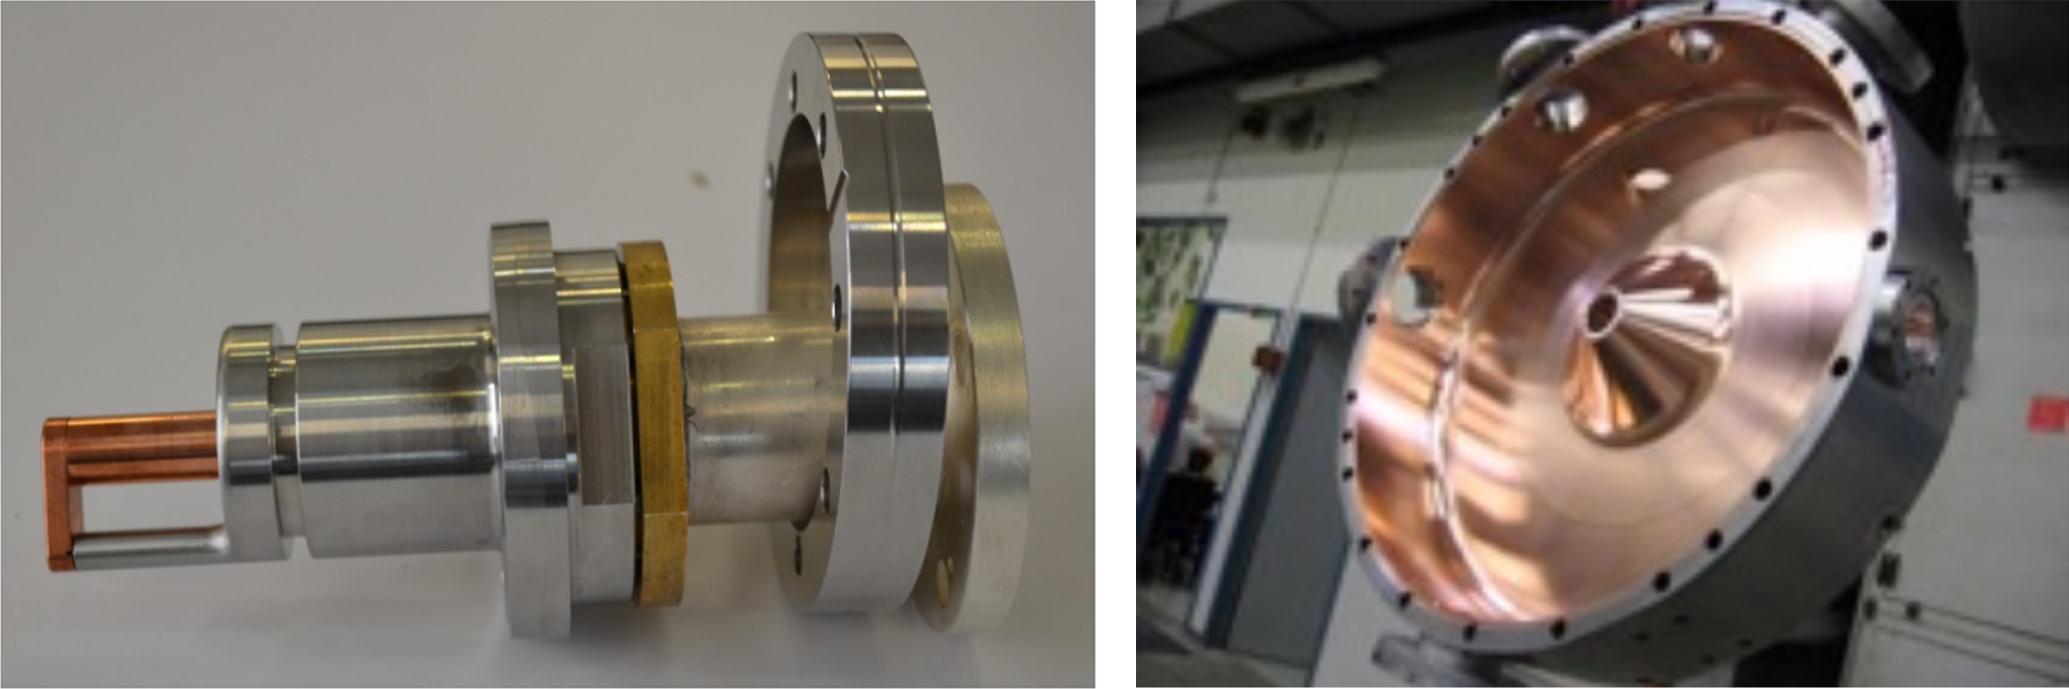
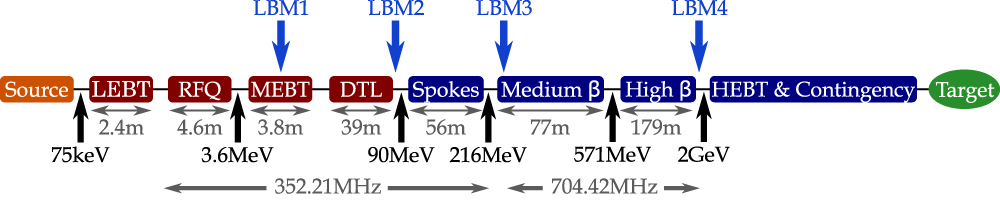
Figure 113. Beam current density distribution on the target for a nominal beam.
Download figure:
Standard image High-resolution image
3.4. Sustainable selection of materials
As part of the sustainability commitment, ESS has developed a procedure for sustainable selection of materials. The aim is to minimise the environmental impact from products through a lifecycle approach. The procedure states four main areas of requirements: 1. Content of hazardous substances, 2. Lifecycle impacts, 3. Responsible sourcing and 4. Documentation of product data.
The requirements apply to certain products and materials that are to be built into the facility. For CF, collaborating with partners in the Swedish construction industry, these types of requirements are well-known, and the large Swedish contractors have procedures in place to be able to handle such requirements efficiently.
Acknowledgments
The authors would like to show their gratitude to the following colleagues for their contributions to this article. S pape Mller, Aarhus University, J Molnr, Atomki P Bosland, B Pottin, J Marroncle, F Ardellier-Desages, CEA Saclay. A Fabris, D Castronovo, C Pasotti, R Visintini, M Ferianis, Elettra I Bustinduy, P Gonzlez, ESS-Bilbao. R Edgecock, University of Huddersfield. D Bocian, IFJ PAN S Gammino, L Celona, A Pisent, P Michelato, INFN S Bousson, G Olry, P Duthil, IPN Orsay W Cichalewski, Lodz University of Technology A Johansson, Lund University S Wronka, J Szewiski, NCBJ E Adli, University of Oslo P McIntosh, A Wheelhouse, P Aden, M Ellis, STFC. D Vinnikov, Tallinn University of Technology, R Ruber, Uppsala University. K Czuba, Warsaw University of Technology, J Polinski, Wroclaw University of Science and Technology.
Footnotes
- 3
The quoted phase resolution was determined at the linac frequency of 352.21 MHz, thus 1o corresponds to ∼8 ps.
- 4
This includes 10% of engineering margin.
- 5
Supervisory control and data acquisition. Commonly used as integrative layer for production plants, processing plants, power plants, et cetera and also large complex research facilities.