

Abstract
During the initial stages of eye development, optic vesicles grow laterally outward from both sides of the forebrain and come into contact with the surrounding surface ectoderm (SE). Within the region of contact, these layers then thicken locally to create placodes and invaginate to form the optic cup (primitive retina) and lens vesicle (LV), respectively. This paper examines the biophysical mechanisms involved in LV formation, which consists of three phases: (1) lens placode formation; (2) invagination to create the lens pit (LP); and (3) closure to form a complete ellipsoidally shaped LV. Previous studies have suggested that extracellular matrix deposited between the SE and optic vesicle causes the lens placode to form by locally constraining expansion of the SE as it grows, while actomyosin contraction causes this structure to invaginate. Here, using computational modeling and experiments on chick embryos, we confirm that these mechanisms for Phases 1 and 2 are physically plausible. Our results also suggest, however, that they are not sufficient to close the LP during Phase 3. We postulate that apoptosis provides an additional mechanism by removing cells near the LP opening, thereby decreasing its circumference and generating tension that closes the LP. This hypothesis is supported by staining that shows a ring of cell death located around the LP opening during closure. Inhibiting apoptosis in cultured embryos using caspase inhibitors significantly reduced LP closure, and results from a finite-element model indicate that closure driven by cell death is plausible. Taken together, our results suggest an important mechanical role for apoptosis in lens development.
Export citation and abstract BibTeX RIS
1. Introduction
During the early stages of eye development, the lens forms from a region of surface ectoderm (SE) after it contacts the optic vesicle (OV), which grows laterally outward from each side of the forebrain. Within the region of contact, the OV and SE become tightly adhered by extracellular matrix (ECM), then thicken to form the retinal placode and lens placode, respectively (figures 1(A) and (B)) (Zwaan and Hendrix 1973). These placodes then invaginate together to form the optic cup (future retina) and lens pit (LP) (figures 1(C) and (D)). Eventually, the nascent lens separates from the optic cup and surrounding SE and becomes the fluid-filled lens vesicle (LV) (figures 1(E) and (F)). Later, the cells in the LV wall elongate and fill the lumen to create the lens (Cvekl and Ashery-Padan 2014). Malformations of the lens can cause birth defects such as congenital cataracts (opaque lens), microphakia (small lens), ectopia lentis (abnormal lens position), and aphakia (absence of the lens) (Khong 2015).
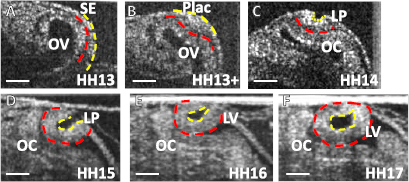
Figure 1. Lens development in the chick embryo: OCT cross sections of developing eye. (A) The optic vesicle (OV) and surface ectoderm (SE) are tightly adhered (HH13) by ECM (red dashed line). (B) Both layers thicken to form the retinal placode (in the OV) and lens placode (Plac). (C) Layers invaginate to form the lens pit (LP) and optic cup (OC). (D)–(F) The LP continues to invaginate and closes to form the lens vesicle (LV) by HH17. Apical side of the primitive lens is outlined in yellow. Scale bar: 100 μm.
Download figure:
Standard image High-resolution imagePublished reports have explored the biophysical mechanisms that create the lens placode and drive its subsequent invagination. These studies suggest that the matrix connecting the SE and OV constrains lateral expansion of the growing SE, causing the membrane to thicken locally to form the circular lens placode (Plageman et al 2010, Huang et al 2011). Then, contraction of actomyosin fibers located on the apical side of the lens placode causes it to invaginate (Medina-Martinez and Jamrich 2007, Plageman et al 2010, Borges et al 2011). Here, we use new data from chick embryos and computational modeling to confirm that these ideas are consistent with physical law. However, our model also reveals that apical constriction alone is not sufficient to close the LP into a complete fluid-filled shell, or vesicle. The main objective of our work, therefore, is to determine the mechanism that closes the opening in the LP to create the LV. To our knowledge, this important aspect of lens morphogenesis has been almost completely overlooked in the literature.
Although there are some differences, the task of closing the LP is similar to closing a circular wound. From a mechanics perspective, wound healing is more complicated than it may appear, and, depending on the circumstances, nature has devised multiple mechanisms to accomplish this task. In the adult, cells near the wound proliferate and crawl into the wound opening to form a temporary patch, create matrix to strengthen the patch, contract to reduce the size of the wound, and remodel to complete the healing process, but often leaving a scar (Martin 1997, Redd et al 2004). In contrast, wounding in an embryonic epithelium typically triggers the formation of an actomyosin cable at the wound margin that contracts and closes the hole by a 'purse string' mechanism. Filopodia-mediated fusion then seals the wound without scarring (Redd et al 2004).
Notably, closing a circular wound with a contractile ring requires the circumference of the hole to shorten from some finite value to zero, causing significant compressive stresses in the circumferential direction that may be partially alleviated by cell remodeling and rearrangement (Wyczalkowski et al 2013). Closing a curved lens also involves some bending, but bending a thin shell requires considerably less energy than stretching or compression. As will be shown, results from a computational model indicate that an actomyosin purse string can close the opening in the LP (see figures S2B and B'), but relatively uniform actin staining around the LP opening does not support the presence of a concentrated ring.
Here, we suggest an alternative mechanism that operates similarly to a contractile ring, but the required circumferential tension is generated by apoptosis, or programmed cell death, which removes cells near the LP opening and shortens its circumference. Researchers have known for decades that apoptosis occurs in the developing lens, especially near the opening in the LP at later stages of invagination, and some have associated it with several morphogenetic processes, including LP invagination, LV shaping, and detaching the vesicle from the SE (Garcia-Porrero et al 1979, Francisco-Morcillo et al 2014). Some investigators have speculated that apoptosis may also play a role in LV closure (Božanić et al 2003, Yan et al 2006), but how this may occur has not been studied.
Results from our model suggest that an apoptosis-driven mechanism for LV closure is feasible from a mechanics viewpoint. Such a mechanism also is supported by experiments showing that inhibiting apoptosis reduces lens closure. These results reveal an important mechanical function for apoptosis in lens development.
2. Experimental methods
2.1. Embryo culture and pharmacological treatment
Fertilized white Leghorn chicken eggs were incubated at 38 °C to reach Hamburger–Hamilton stages 11–17 (HH11–17, 40–64 h) (Hamburger and Hamilton 1951). Embryos were removed from eggs using a ring of filter paper adhered to the vitelline membrane and placed ventral side up into 35 mm Petri dishes, as described previously (Voronov and Taber 2002). To eliminate artifacts due to surface tension, a second filter paper ring and a stainless steel ring were placed on the embryo to keep it submerged under approximately 1 ml of culture media. Embryos were cultured in a plastic bag with supplemented oxygen (Voronov and Taber 2002).
To inhibit apoptosis, the irreversible caspase inhibitor Q-VD-OPh (ApexBio, A1901) or Z-VAD-fmk (ApexBio, A1902) was added to the media at stages HH11 to HH14-, before significant invagination occurred, for a concentration of 100, 150, or 200 μM. Q-VD-OPh is a pan-caspase inhibitor with very little toxicity to cells (Caserta et al 2003), while Z-VAD-fmk preferentially inhibits caspase 3 at low concentrations (Caserta et al 2003). Embryos were cultured overnight (16 to 23 h), then imaged as described below.
2.2. Imaging and analysis of tissue morphology
Brightfield images were captured with a camera (Nikon EOS T3) mounted on a dissecting microscope (Leica DMLB MZ 8). Sections of living embryos were acquired using optical coherence tomography (OCT) with 10 μm resolution (Thorlabs, Newton, NJ).
To analyze lens morphology, stacks of OCT images were imported into ImageJ (National Institutes of Health, Bethesda, MD) and oriented for viewing through the dorsal-ventral plane of the lens and optic cup within the plane oriented through the optic stalk (see figure 1). At selected stages, wall thickness was measured at 3–4 locations near the center of the lens and averaged. Apical arc length, basal arc length, and cross-sectional area of the prospective lens were also measured. The diameter of the gap in the closing LP was also measured within the viewing plane shown in figure 1. After overnight culture, this quantity was compared between control and treated embryos using one-way ANOVA.
2.3. Visualization of cells and matrix
Various staining protocols were used to visualize tissue constituents. Unless stated otherwise, images of stained samples were captured with a Zeiss LSM 710 confocal microscope (Carl Zeiss Microimaging, Inc., Thornwood, NY). Prior to staining, all embryos were fixed for 1–24 h in PBS containing 3.7% formaldehyde and sectioned in agar.
To stain cell nuclei, embryos were incubated at room temperature with DAPI (Sigma, 1:1000) in PBS for 10 min.
Fibronectin stain was used to visualize ECM. Fixed embryos were rinsed in PBS, then soaked in blocking buffer (2% goat serum with 0.1% Triton X-100 in PBS) for 3 h as described previously (Oltean et al 2016). Embryos were incubated in primary antibody (Sigma F3648, 1:100) for 24 h at 4 °C, rinsed with PBS three times, and then incubated with a secondary antibody (Alexa Fluor(R) 488 Goat anti-Rabbit IgG (H + L), Invitrogen A11034, 1:100) overnight at 4 °C. Samples were rinsed with 0.1% Tween 20 (Sigma) in PBS three times.
To observe F-actin, embryos were blocked in 0.1% Triton X-100 (Sigma) and 1% bovine serum albumin (BSA) in PBS and then stained with Alexa Fluor(R) 488 phalloidin (1:100, Molecular Probes) with 0.1% Triton X-100 and 1% BSA (Oltean et al 2016).
2.4. Analysis of apoptosis
To visualize cell death, 2 μl of 2% Nile blue sulfate was added per ml of media. Embryos were incubated at room temperature on a shaker and then imaged using brightfield microscopy. Nile blue sulfate shows approximate regions of cell death, including lysosomal and phagocytotic activity (Elmore 2007). For more specific staining of dying cells, activated caspases associated with apoptosis were visualized with CellEvent(R) Caspase 3/7 Detection Reagent (ThermoFisher Scientific C10423, 1:1000). Live embryos were incubated with CellEvent(R) in media and imaged at multiple time points with a Leica DMLB fluorescence microscope (10x, 20x, and 40x objectives).
The time it takes for apoptotic cells to degrade has not been well characterized (Jacobson et al 1997). To calculate this clearance time, we imaged activated caspases 3 and 7 in real-time using fluorescence microscopy. At each time point, newly fluorescing cells were noted as beginning to die. These cells were tracked across multiple time points until they fragmented and were no longer part of the epithelium. The times from beginning to end were averaged from multiple embryos (n = 4) to estimate the clearance time in or near the developing lens.
2.5. Probing tissue stress
A microsurgical device (Gastromaster, Xenotek Engineering, Belleville, IL; white tip), was used to test for compression or tension in the SE surrounding the lens. The membranes over the eye were removed with a pulled glass capillary, and embryos were submerged in sufficient PBS (Dulbecco's phosphate-buffered saline) to completely cover the cutting tip. Shallow cuts were made in different directions around the LP (perpendicular and tangential). Images were captured within a few minutes after dissection using brightfield microscopy and OCT to observe if the cut opened, indicating tension, or remained closed, indicating compression or negligible tension.
3. Experimental results
The present study covers lens development in the chick embryo during stages HH12 to HH17, an approximately 11 h period with time t = 0 corresponding to HH12. For convenience, although there is some overlap, we divide LV development into three phases (see table 1): (1) placode formation (HH12–14;  h); (2) invagination (HH14-14+ ;
  h); and (3) closure (HH14+ –17;
  h).
h).
Table 1. Approximate developmental times and corresponding Hamburger–Hamilton stages in the chick embryo.
| Time (hours in model) | HH Stage | HH Hours | Phase |
|---|---|---|---|
| 0 | HH12 | 47 | 1 |
| 3 | HH13 | 50 | 1 |
| 4.5 | HH14 | 51.5 | 1–2 |
| 5 | HH14+ | 52 | 2–3 |
| 6 | HH15 | 53 | 3 |
| 11 | HH17 | 58 | 3 |
3.1. Early eye morphogenesis
In the chick embryo, each OV grows outward and contacts the SE by HH10 (approximately 32 h of incubation). The SE is initially thinner than the OV (figure 1(A)). During Phase 1, these layers become adhered in the region of contact via a bilayered ECM (figure 2(A)) and thicken to form the lens and retinal placodes, respectively (figure 1(B)). Recent studies have suggested that these placodes form because the matrix constrains expansion of the SE and OV as they grow by cellular proliferation (Huang et al 2011, Oltean et al 2016).

Figure 2. Staining for ECM, actin, and apoptosis. (A) Confocal section at stage HH14− shows fibronectin (yellow), which marks location of ECM between lens pit (LP) and optic vesicle (OV). (B) and (C) F-actin (red) and cell nuclei (cyan) staining shows actin concentrated on apical sides of LP and OV. Actin staining remains strong on the apical side of the LP at HH14 as it invaginates. (D) and (E) Brightfield image of Nile blue staining shows a ring of cell death surrounding the opening to the LP (red arrows) at stages HH14 and HH15. OC = optic cup. (F) Confocal section with caspase 3 and 7 staining (yellow) confirming apoptosis in the optic cup and near opening in LP at HH15. Large dots show nuclei in early apoptosis, while very small dots show cells in late apoptosis. Image shows combination of multiple slices in a stack using the maximum brightness function in ImageJ. (F') Nuclear staining of same embryo shows morphology, with small dots indicating apoptotic bodies. Scale bars: 100 μm.
Download figure:
Standard image High-resolution imageDuring Phase 2, the lens and retinal placodes invaginate together to form the LP and optic cup, respectively (figure 1(C)). As shown previously (Zwaan and Hendrix 1973, Ettensohn 1985), stained sections reveal abundant actin located on the apical surface of the SE during Phases 1 and 2 (figures 2(B) and (C)). During Phase 1, lesser amounts are indicated on the basal side of the SE, as well as on both sides of the OV (figure 2(B)). By HH14, actin intensity decreased everywhere except the apical side of the SE, especially on the concave surface of the LP (figure 2(C)). These results are consistent with studies suggesting that apical constriction drives SE invagination (Plageman et al 2010, Borges et al 2011), while OV invagination is likely caused by a continuation of the ECM-constrained growth involved in retinal placode formation (Oltean et al 2016).
During Phase 3, ECM density decreases as the SE and OV lose contact (Hendrix and Zwaan 1974) while invagination continues (figures 1(D)–(F)). By HH17, the LP closes to create the LV (figure 1(F)), which separates from the surrounding SE.
3.2. Apoptosis
Cell death has been reported near the opening in the chick LP during stages HH15–17, and apoptosis may be involved in detaching the LV from the SE (Garcia-Porrero et al 1979, Francisco-Morcillo et al 2014). Here, we investigate the possibility that apoptosis also is involved in LV closure.
Nile blue staining indicates regions of cell death in the LP (figures 2(D) and (E)), beginning with strong dorsal staining at HH14 and spreading into a complete ring around the LP opening at HH15. Since Nile blue is not a specific stain for apoptosis (Elmore 2007), we also incubated embryos with CellEvent(R) Caspase 3/7 to visualize signals associated with apoptosis. Fixed embryos were then stained with DAPI, and sectioned eyes were imaged with confocal microscopy. Caspase-positive cells were concentrated near the edge of the LP opening and through the center of the optic cup (figure 2(F)). Apoptotic bodies were also apparent with DAPI staining as small, bright, segmented nuclei in the anterior LP and optic cup (figure 2(F')). These results are consistent with published data.
Once cells begin to die, they can be fragmented and extruded from an epithelium within minutes or hours (Teng and Toyama 2011). For apoptosis to play a significant role in closing the LV, the clearance time for these cells must be relatively short compared to the duration of the closure phase (Phase 3). A value of 40 min has been reported for the neonatal rat retina (Cellerino et al 2000). In the present study, the average clearance time measured in the LP was  min (s.d., n = 4 embryos), which is considerably less than the six-hour duration of Phase 3.
To determine whether cell death is needed for LP closure, we exposed embryos to the caspase inhibitors Q-VD-OPh and Z-VAD-fmk. Caspases are cysteine proteases central to apoptosis that are initially inactive and must be activated by initiator caspases or other proteins (McIlwain et al 2013). Stage HH11 to HH14− embryos were incubated in media containing either inhibitor and cultured overnight (figures 3(A) and (B)). Confocal imaging revealed a dramatic reduction of caspase staining, with only a few dots in the LP or optic cup (figures 3(C) and (C')), and Nile blue staining showed reduced apoptosis in treated embryos relative to controls (figures 3(D) and (E)). Embryos appeared healthy overall (see figure 3(F)), and DAPI staining showed intact nuclei without apoptotic bodies in treated embryos. After incubation, the mean diameter of the LP opening was significantly larger than controls and increased with concentration of both inhibitors (P < 0.001, one-way ANOVA; figure 3(G)). There was no significant difference between embryos exposed to the same concentration (100 μM) of Q-VD-OPh or Z-VAD-fmk (P = 0.2). Thus, inhibiting apoptosis reduced the extent of LV closure.

Figure 3. Effects of inhibiting apoptosis on lens vesicle formation. Stage HH11 to HH14− embryos were cultured overnight in control media or in media containing the caspase inhibitor Q-VD-OPh. (A) Most control embryos had a closed lens vesicle (LV) as shown by OCT imaging. OC = optic cup. (B) The lens pit (LP) in many treated embryos did not close (n = 17/49). (C) Caspase staining (yellow) reveals little to no apoptosis in treated eyes. (C') Nuclear staining of same embryo (cyan) shows tissue morphology. Images show overlay of multiple slices in a stack with the maximum brightness function of ImageJ. Scale bars: 100 μm. (D, E) Brightfield microscopy of Nile blue staining shows considerably less cell death (red arrow; dark blue stain) in treated eye (E) than in control eye (D). Dashed yellow circles indicate LP opening. (F) Brightfield image of representative embryo treated with  M Q-VD-OPh after overnight culture. Inhibiting apoptosis did not cause adverse effects in overall embryo health or heartbeat compared to controls. (G) A second caspase inhibitor (two concentrations of Z-VAD-fmk) was used to confirm these results. Diameter of the LP opening is plotted for each group after overnight culture (mean ± s.d.; 0 indicates a closed LV). One-way ANOVA shows significant differences between each group (P < 0.001) except for the pair indicated by NS (P = 0.2). The size of the opening increased with concentration of the inhibitors. (H) Comparison of Model B cross section (red outline) at end of Phase 3 (t = 11 h) with representative OCT image of lens vesicle from HH17 control embryo. (I) Same model with apoptosis turned off compared to HH17 embryo exposed to apoptosis inhibitor (150 μM Q-VD-OPh, yellow dotted outline). Sizes are scaled to compare overall shapes.
Download figure:
Standard image High-resolution imageTaken together, these results suggest the following biophysical mechanisms for early lens development:
- Phase 1: Regional growth of the SE, constrained by relatively stiff matrix on its basal side, causes the lens placode to form (Huang et al 2011, Oltean et al 2016).
- Phase 2: Actomyosin contraction on the apical side of the lens placode drives invagination to create the LP (Plageman et al 2010, Borges et al 2011).
- Phase 3: A ring of apoptotic cells near the opening in the LP creates circumferential tension that causes the LP to close into a complete vesicle.
4. Computational methods
To examine the plausibility of the proposed mechanisms, we created axisymmetric finite-element models for the developing lens using COMSOL Multiphysics (Version 4.2a, COMSOL AB, Providence, RI, USA). All models are based on nonlinear elasticity theory, modified to include growth and contraction.
4.1. Modeling growth and contraction
With all layers treated as pseudoelastic, growth and contraction are simulated using the theory for finite volumetric growth of Rodriguez et al (1994). Accordingly, the total deformation gradient tensor is decomposed as

where  is the elastic deformation gradient tensor (relative to the zero-stress state) and
  is the growth tensor. In all cases, the growth tensor is taken in the orthotropic form

where  ,
,  , and
, and  are unit vectors in spherical polar coordinates
  defined in the undeformed configuration (figure 4), and GR,
  , and
, and  are specified functions of space and time. The components of this tensor are used to simulate positive growth (Gi > 1), apoptosis (0 < Gi < 1), and contraction (0 < Gi < 1 with increased stiffness).

Figure 4. Finite-element models in initial configuration. Cross sections of spherical models are shown with dashed lines denoting axis of symmetry. Model A consists of four layers: contractile actin layer; inner surface ectoderm (iSE); ECM, and optic vesicle (OV). Model B has same geometry but excludes the OV, includes a region of apoptosis in the iSE, and halves the thickness of the ECM. Model A simulates Phases 1 and 2; Model B simulates Phase 3.
Download figure:
Standard image High-resolution imageThe Cauchy stress tensor depends on elastic deformation through the constitutive relation (Taber 2004)
where W is the strain-energy density function,  is the right Cauchy-Green elastic deformation tensor, and
  is the elastic volume ratio. Details for incorporating growth in COMSOL 4.2a are provided in Hosseini et al (2014).
4.2. Finite-element models
Hereafter, we refer to the lens-forming region of the SE as the inner surface ectoderm (iSE) and the surrounding SE as outer surface ectoderm (oSE). These designations hold throughout development, even as the iSE becomes the lens placode, lens pit, and lens vesicle. Although the iSE and oSE remain attached until Phase 3, our models exclude the oSE unless stated otherwise.
The OV and iSE begin to separate during Phase 2. To deal with this fundamental change during development, we consider two separate models (figure 4). Model A includes both layers and is used to simulate Phases 1 and 2. Model B includes only the iSE and simulates Phase 3. Since Phase 2 ends at HH 14+ (t = 5 h), where Phase 3 begins, the models overlap at this stage. This provides a continuity check.
4.2.1. Model geometry
For both models, the initial geometry is an idealized shallow spherical shell with dimensions based on OCT and confocal images. In the initial configuration, Model A consists of four layers (figure 4). From top to bottom, these layers represent a thin contractile layer ( ), cells of the iSE (
 ), ECM (
 ), and the OV (
 ). Here,
  is the normalized initial layer thickness with Ri being the inner radius of the iSE. The shell spans 80 deg of a sphere. The edge is considered a free boundary, and the apex is fixed to prevent rigid-body motion.
The geometry for Model B is the same as that for Model A, but the OV is omitted (figure 4). In addition, the iSE includes a region of apoptotic cells near its edge (outer 5 deg). Since the matrix consists of two layers that likely separate as the iSE detaches from the OV (Oltean et al 2016), the ECM of Model B is half the thickness of that in Model A.
4.2.2. Material properties
Material properties for the various layers are the same for both models. As in Xu et al (2010), all layers are assumed to be isotropic and slightly compressible with the strain-energy density function taken as
where  is the first strain invariant, μ is the shear modulus, and
  with ν being Poisson's ratio in the limit of small strain.
For all layers, we set  . From published microindentation measurements for the embryonic chick brain, we take
  Pa for the OV (Xu et al 2010) and assume the same value for the iSE (
 ). The ECM is considerably stiffer, however, with the value
  during Phase 1 (figure 5(A)) (Oltean et al 2016). As the iSE detaches from the OV, the matrix begins to degrade (Hendrix and Zwaan 1975). To simulate this process, the matrix modulus is decreased by a factor of five during Phase 2, where it remains thereafter (figure 5(A)). In addition, the shear modulus for the contractile layer is assumed to increase with contraction (decreasing Gi) according to the relation
where  . A previous model for contraction in the embryonic brain used a similar equation with
  (Filas et al 2012); the effects of varying the value of β are shown in Supplemental figure S6 (stacks.iop.org/PB/15/025001/mmedia). Note that contraction is assumed to occur parallel to the surface of an epithelium, and
  if the cells are passive (
 ).
).

Figure 5. Variations in material, growth, and contraction parameters for finite-element models. (A) Shear modulus of ECM versus time. Modulus decreases during Phase 2 and early Phase 3 (t = 4.5–5.5 h) to simulate detachment of iSE from the optic cup. (B) Growth in iSE versus meridional angle Θ at selected times (hours). For t > 5 h, the circumferential growth rate is negative ( decreases) in the apoptotic region (see figure 4). Growth of OV is the same in Model A (
 h). (C) Contraction (negative growth) in actin layer versus Θ at selected times. Contraction begins at t = 3 h (
 and
and  decrease from unity).
Download figure:
Standard image High-resolution image4.2.3. Growth
In both models, the ECM layer does not grow ( ). The other layers grow (or contract) at a constant rate during each phase, but only in the circumferential and meridional directions. Growth distributions at selected time points are shown in figure 5(B). During Phases 1 and 2 (Model A), the iSE and OV grow uniformly at the rate
  h−1 (
h−1 ( h). Uniform growth in the iSE is consistent with measurements of regional cell proliferation (see supplemental figure S1). The growth rates are assumed to be equal and were determined by fitting numerical to experimental measurements of iSE cross-sectional area versus time (see figure 7(B)). (These are the only data used to determine growth rates; other geometric measurements are used to test the model.) In the apoptotic region, however,
  remains positive but
  becomes negative with
  at t = 11 h.
Two other aspects of the specified growth pattern should be noted for Phase 3 (see figure 5(B)). First, to modify overall lens shape, a slight growth gradient is included in the iSE, with growth increasing with distance from the axis of symmetry ( h). We found that uniform growth causes the LV to be too circular (see Supplemental figure S5). Second, in the apoptotic region, the ECM layer begins to distort the basal surface of the iSE. Thus, to more accurately simulate matrix degradation, we stipulate negative circumferential growth in this region to match that in the adjacent iSE.
4.2.4. Contraction
The contractile layer is initially passive ( ), but beginning at t = 3 h it begins to contract uniformly at the rate
  h−1 (figure 5(C)). During Phase 3, we included a contraction gradient that, like the growth gradient, helps create a more circular lens shape (see supplemental figure S5). Contraction in the circumferential direction becomes stronger (
 decreases) with increasing distance from the axis of symmetry (see figure 5(C)).
5. Computational results
To our knowledge, Hendrix et al (1993) presented the only previous mathematical model for lens formation. They conducted a geometric analysis of the forming LV that includes constrained growth and cell wedging, but their model does not account for mechanical forces. The present models are based on the fundamental laws of mechanics.
5.1. Phase 1: placode formation
In Model A, both the iSE and OV grow, but the non-growing matrix that binds them impedes their tangential expansion. As tissue volume increases, this constraint causes the layers to flatten and form placodes (figure 6, t = 0–4.5 h), as observed in the embryo (figures 1(A) and (B)). The relative increase in iSE thickness increases with the extensional stiffness of the ECM relative to that of the cells (results not shown). For the experimentally estimated value  (Oltean et al 2016), the rate of change in iSE (lens placode) thickness is somewhat lower than our measurements (see figure 7(C), t = 0–4.5 h).

Figure 6. Numerical simulation of early lens development. Cross sections of models are shown for selected time points. Model A simulates Phase 1 and 2; Model B simulates Phase 3. Phase 1: Growth of the inner surface ectoderm (iSE) and optic vesicle (OV) is constrained by ECM, causing both cell layers to flatten and thicken to form the lens placode and retinal placode, respectively. Phase 2: Contraction in the actin layer causes invagination. Phase 3: Apoptosis near outer edge of iSE causes the lens vesicle to close by t = 11h. Also shown are 3D representations of Model A at t = 5 h and Model B at t = 11 h (right). Time t = 5 h bridges the two models, with somewhat less bending occurring in Model A because of the additional constraint provided by the OV. Colors indicate circumferential growth ( ).
).
Download figure:
Standard image High-resolution image
Figure 7. Comparison of model and experimental morphological measurements during lens development. (A) Schematic showing measured quantities. (B) Cross-sectional area. (C) Wall thickness at center. (D) Apical and basal arc lengths. (E) Cell wedging (ratio of basal to apical arc length). (F) Gap diameter (opening in lens pit).
Download figure:
Standard image High-resolution image5.2. Phase 2: invagination
Multiple studies support the view that apical contraction drives invagination of the SE during lens development (Plageman et al 2010, Borges et al 2011). For example, exposure of chick embryos to the myosin II inhibitor blebbistatin prevents lens pit formation (Borges et al 2011).
In Model A, when apical contraction is turned on, the two cell layers begin to invaginate together (figure 6, t = 4.5–5 h). At t = 5 h, Model B is slightly more bent since it does not contain the OV with its added stiffness. Before getting to this point, however, the behavior differs considerably between the two models. Rather than flattening during Phase 1, the isolated iSE of Model B evaginates before apical contraction reverses the bending direction (supplemental figure S3). The initial evagination is caused by the ECM, which constrains expansion of the basal side of iSE as it grows. Normally, this behavior is prevented by attachment of the iSE to the OV, illustrating the importance of the initial coupling between these layers.
When the magnitude of contraction in Model B is increased further without including apoptosis, the iSE continues to bend. The open shell does not close, however, because the bending moment generated by apical contraction cannot overcome the large compressive stresses that develop near the LP opening in the circumferential direction (supplemental figure S4A). This result, which does not occur in a cylindrical model (supplemental figures S4B and C), led us to consider the possibility that apoptosis plays a role in closure.
5.3. Phase 3: closure
When cells die in an epithelium, neighboring cells contract and squeeze them out of the membrane, effectively removing tissue volume (Rosenblatt et al 2001). To simulate this process in Model B, we specify  and
and  within the apoptotic region of the iSE (see figures 4 and 5(B)). This anisotropic pattern of cell death generates circumferential shortening and tension that closes the LP (figure 6, t = 5–11 h).
It is important to note that our method for simulating apoptosis does not include the accompanying local contraction that likely diminishes after apoptotic cells are forced out of the tissue. Rather, it represents the decrease in tissue volume after the dead cells are removed and contractility returns to normal.
The stipulated decrease in  , but not
  , is an assumption based on the behavior of our model, which yields realistic morphology only if the growth tensor is anisotropic. A possible rationale is provided in the Discussion section.
5.4. Comparison of numerical and experimental results
As one test of our model, the experiments involving apoptosis inhibitors were simulated by turning off apoptosis in Model B. Outlines of the model geometry at t = 11 h with and without apoptosis are overlaid on representative OCT images of a control embryo and one exposed to the caspase inhibitor Q-VD-OPh (figures 3(H) and (I)). Numerical and experimental shapes show reasonably good agreement.
We also compare temporal changes in several morphological characteristics against experimental measurements in the iSE of control embryos (figure 7). At selected time points, we measured cross-sectional area, wall thickness at the center, apical and basal arc lengths, cell wedging (ratio of basal to apical arc length), and diameter of the LP gap. For each embryo, all quantities were normalized by their values at the time of first measurement (t = 0 for all except the gap size, where t = 4.5 h was used). Except for gap diameter, all plots contain results from both Model A (t = 0–5 h) and Model B (t = 5–11 h).
Both cross-sectional area and wall thickness increased with time (figures 7(B) and (C)). As expected, the models yield good agreement with the change in area, since these data were used to establish growth rates. With the specified growth, the models predict an increase in thickness that is somewhat smaller than measured values, although the trend is correct. Notably, the wall thickness continues to increase after the placode forms.
During Phase 1, the basal arc length remains relatively constant in both model and embryo (figure 7(D)). These results are consistent with previous experimental data showing constant area on the basal side of the lens during placode formation in chick and mouse embryos (Hendrix and Zwaan 1974, Huang et al 2011). The experimental arc length of the apical side decreases during Phase 1, however, contrary to the model prediction. At later times, the basal arc length given by the models increases markedly, but the apical length first deceases and then increases slowly. These trends agree well with the data (figure 7(D)). Cell wedging predicted by the models also agrees remarkably well with the measurements, including the sharp increase near the end of Phase 1, as invagination begins (figure 7(E)).
The models predict a relatively rapid decrease in gap diameter near the beginning of invagination (t = 4.5 h) and near the end of closure (t = 11 h) (figure 7(F)). Although the data appear to indicate a similar initial drop, the experimental closure rate is relatively constant afterwards. Since we assumed that the apoptosis rate is constant, these results suggest that the rate actually drops toward the end of the closure phase. In fact, two groups measured the apoptotic index as 7.5% or 17% at E10.5 in the mouse LP (similar to HH15), but it decreased dramatically at E11.5 and E12.5 (analogous to HH17 and HH18) (Yoshimoto et al 2005, Le et al 2012).
6. Discussion
The results from the present study suggest that matrix-constrained growth, apical contraction, and apoptosis are necessary for placode formation, invagination, and closure, respectively, of the developing lens. Model A shows that the first two mechanisms are feasible, but our experiments and Model B suggest that apical contraction is not sufficient to completely close the LP.
Unless material moves away from the edge, closing a hole in a spherical shell generally requires much larger forces than closing a cylindrical shell such as the neural tube. To illustrate this point, we simulated apical contraction in a cylindrical model. Unlike our spherical lens model, the cylindrical model closes relatively easily (see supplemental figure S4C). The reason is that an open cylindrical surface can bend into a closed cylinder without significant tangential stretching. In contrast, closing a circular hole in a sphere creates large compressive stresses tangent to the edge of the hole, as the circumference of the hole decreases. Since these stresses resist closure, greater loads are needed to close a spherical shell.
We hypothesized that apoptosis near the LP opening generates the required additional force in the form of circumferential tension, and our computational and experimental results suggest that this mechanism is sufficient to close the vesicle. Recently, interest in the force-generating role of apoptosis during morphogenesis has been growing (Suzanne and Steller 2013, Okuda et al 2016, Ambrosini et al 2017).
The diagram in figure 8 summarizes our hypotheses for early eye development. First the ECM constrains growth of the OV and iSE to create the retinal and lens placodes, respectively. Next, apical contraction causes the iSE to invaginate and form the LP, while matrix-constrained growth causes the OV to invaginate and form the optic cup. Finally, apoptosis near the LP opening closes the LV.

Figure 8. Schematic of hypothesis for lens vesicle formation. (A) The optic vesicle (OV, purple) and surface ectoderm (SE, orange) are initially bonded together by relatively stiff extracellular matrix (ECM, dashed green line). (B) The ECM constrains expansion of both layers as they grow, causing the layers to thicken and form the retinal placode (RP) and lens placode (Plac) in the region of contact. (C) and (D) Constrained growth eventually causes the OV to invaginate and form the optic cup (OC), while apical actomyosin contraction (dashed red line) causes the SE to invaginate and form the lens pit (LP). (E) Cell death, or apoptosis (blue dots), occurs in a ring near the opening in the LP and generates circumferential tension that closes the LP to form the lens vesicle (LV), which separates from the optic cup and outer SE.
Download figure:
Standard image High-resolution image6.1. Placode formation and invagination
The possible role of ECM in placode formation was perhaps first suggested by Hendrix and Zwaan, who noticed that the contact area between the iSE and OV remained constant during placode formation, and they speculated that the matrix restricts expansion of the iSE, causing it to thicken (Zwaan and Hendrix 1973, Hendrix and Zwaan 1974). Huang et al (2011) confirmed this result in mice and showed that conditional knockout of fibronectin prevents lens placode formation, as well as subsequent invagination. Although matrix-constrained growth can cause the OV to invaginate (Oltean et al 2016), Model A shows that iSE invagination requires apical constriction (figure 6).
Apical constriction is a common mechanism for epithelial invagination in the embryo (Martin and Goldstein 2014), and results from a number of studies have indicated that actomyosin contraction drives lens invagination (Zwaan and Hendrix 1973, Ettensohn 1985, Plageman et al 2010). For example, exposure to the myosin inhibitor blebbistatin or the Rho-kinase inhibitor Y27632 prevents lens invagination in the chick embryo (Borges et al 2011, Plageman et al 2011). Results from our models also support this mechanism.
6.2. Closing the lens vesicle
To our knowledge, apoptosis has not been previously evaluated as a mechanism to close the LV. However, the possible role of programmed cell death in lens development has not been ignored. Apoptosis has been observed in the early lens primarily with TUNEL staining, caspase staining, or examination of nuclei ultrastructure in mouse, rat, chick, and human embryos (Trousse et al 2001, Mohamed and Amemiya 2003, Božanić et al 2003, Yoshimoto et al 2005, Le et al 2012, Arya et al 2015). Macrophages have also been imaged near lens tissues containing debris from dead cells (Mohamed and Amemiya 2003, Francisco-Morcillo et al 2014). Here, we verified the presence of apoptosis within an annular region surrounding the LP opening with Nile blue sulfate and activated caspase 3 and 7 staining (figure 2).
Results from our model suggest that removing cells through apoptosis generates circumferential tension that completes the closure process. To obtain realistic morphology, the model requires loss of cells only in the circumferential direction ( decreases) with cell number remaining relatively constant in the meridional direction (constant
  ). The precise mechanism warrants further study, but here we offer the following explanation based on findings that the hole left by a dying cell is replaced by neighboring cells to maintain the integrity of the epithelium (Rosenblatt et al 2001). For illustration, suppose 1/3 of the cells in two concentric rings near the LP opening are removed. As the cells in these rings squeeze together and rearrange to fill the gaps, the circumference would shrink by nearly 50% with no change in geometry in the meridional direction (see figure 9).
Figure 9. Schematic diagram of apoptosis and possible cell rearrangement. Two concentric rings of cells surrounding the circular opening in the lens pit are shown. (A) Before apoptosis. (B) After 1/3 of the cells are removed randomly by apoptosis, cells rearrange to fill the gaps left by dead cells. The radius of the opening decreases by nearly half ( ). This corresponds to the circumferential growth ratio
  falling from unity to 0.53, while meridional growth remains at
  .
.
Download figure:
Standard image High-resolution image
Other possible mechanisms for lens closure were considered. For example, similar to closing an epithelial wound (Redd et al 2004), modeling showed that contraction of an actomyosin cable can close the LP (figure S2B and B'). However, we did not find evidence for such a structure (figure S2C and C'). We also considered the possibility that the growing oSE pushes the LP closed, but tissue cutting experiments indicated meridional tension and not compression in the oSE, contradicting this idea (Fig S2 ). Cell wedging driven by basal expansion was also considered but did not have a significant effect in our model (results not shown).
Apoptosis has important mechanical roles in several processes, and prior research has suggested other roles for apoptosis during lens development. Studies have shown, for example, that apoptosis is involved in separating the LV from the oSE (Ozeki et al 2001). Inhibiting apoptosis prevents LV detachment, causing an eye defect called Peters' anomaly (Ozeki et al 2001, Cvekl and Ashery-Padan 2014). In the present study, inhibiting apoptosis also significantly reduced LV closure (figure 3), in agreement with a previous report (Valenciano et al 2002). These results suggest multiple roles for apoptosis in lens development.
Since the oSE is under tension (figure S2 ), it seems that this membrane could impede closure if it remains attached to the iSE, perhaps explaining why inhibiting apoptosis affects closure. However, the LV normally separates from the oSE after closure is completed at HH17 (Garcia-Porrero et al 1979). Nevertheless, forces applied by the oSE can affect lens shape as it closes, and our model yields more realistic LP shape when the effects of the oSE are included (see figure S3, fourth row).
Apoptosis may not be a simple passive process, as it can also induce local actomyosin contraction at the site of extruded cells (Rosenblatt et al 2001, Monier et al 2015). Interestingly, ROCK-I can be activated directly by caspases, and inhibiting myosin II with blebbistatin decreases fragmentation (specifically blebbing) of apoptotic cells (Leverrier and Ridley 2001, Orlando et al 2006). This interplay between contraction and apoptosis may complicate elucidating the effects of contraction alone in lens development.
6.3. Limitations
While capturing the essential features of early eye morphogenesis, our models could be improved by incorporating more realistic geometry, as well as spatial and temporal measurements of material properties, contractility, cell proliferation, and apoptosis. Researchers have shown, for example, that apoptosis in the mouse lens varies greatly between stages E10.5 and E12.5 (Yoshimoto et al 2005, Le et al 2012). The effects of a changing apoptotic rate warrant further investigation.
Some may question the use of continuum modeling for a system containing so few cells. Morphogenesis is ultimately a tissue-level phenomenon, however, and numerous studies have shown that models based on continuum mechanics yield reasonable tissue-level behavior (Conte et al 2008, Shi et al 2014, Oltean et al 2016, Garcia et al 2017). Our analysis also assumes that the tissue is elastic, whereas soft tissues are actually viscoelastic, and some embryonic tissues exhibit fluid-like behavior for long time scales (Wyczalkowski et al 2012). Cells flowing away from the edge of the opening in the lens pit could facilitate closure. Previous studies have found, however, that neuroepithelial cells can sustain significant tension over long time periods, suggesting that they can be treated as elastic to a first approximation (Varner et al 2010).
The real test of any model is how it fares against experimental data. In this regard, the proposed models do quite well. Moreover, the main purpose of the present study is to show proof of principle, leaving more refined analysis to future investigation. Nevertheless, a multiscale model that includes more realistic mechanical properties and bridges scales from the subcellular to the tissue level could provide further mechanistic insight into this problem.
Regional growth can depend on factors besides cell proliferation and death. For example, cells can change size and migrate from one location to another. Studies in mouse indicate, however, that average cell volume in the developing lens remains essentially constant during placode formation (Huang et al 2011). Cells undergo complex patterns of migration during optic cup morphogenesis in zebrafish, but the cell movements are more limited to optic vesicle elongation in chick (Kwan et al 2012).
Other than caspases, we did not investigate genetic or molecular signals. Researchers have studied the signals involved in apical constriction such as Shroom3 and ROCK (Lang et al 2014). Mutations in Shroom3 and p120 prevent separation of the oSE and LV in mice (Lang et al 2014), which may suggest interactions between these signals and apoptosis. The signals Pax6, Six3, and Sox2 have been studied extensively in lens development (Cvekl and Ashery-Padan 2014). Pax6 conditionally deleted in the SE decreases ECM deposition and prevents placode formation in the mouse (Huang et al 2011). Mutations in Pax6, Foxe3 and several other genes are associated with Peters' anomaly where the LV fails to detach from the oSE (Cvekl and Ashery-Padan 2014). Future studies could examine how caspase inhibition in the chick embryo affects these cell signals.
In conclusion, our study supports the hypothesis that mechanical forces generated by regional apoptosis are required to close the lens vesicle. This work suggests a critical role for apoptosis in lens development that also may be important in other morphogenetic processes. The proposed mechanism awaits further exploration.
Acknowledgments
We thank Steven Bassnett, Philip Bayly, Ruth Okamoto, and other members of the Taber laboratory for valuable discussions. We are grateful for the collaboration and mentorship of David Beebe, who passed away in 2015. We thank the Department of Mechanical Engineering and Materials Science at Washington University for use of the confocal microscope. This study was supported by Grant R01 NS070918 (LAT) from the National Institutes of Health (NIH) and a fellowship for AO through the Imaging Sciences Pathway at Washington University (NIH T32 EB014855).