


ABSTRACT
NGC 2655, a nearby bright S0/a galaxy in a loose group, has strongly asymmetric central dust lanes and an extended disk of neutral hydrogen gas. Here we present deep optical images showing tidal arms and regions of diffuse starlight well beyond the main galaxy, suggestive of a recent merger. Our maps in the 21 cm line show a layer of neutral hydrogen extending to at least 7.5' or 40 kpc from the center, with a broken streamer of gas trailing off toward the small neighbor galaxy UGC 4714. The global profile has sloping "shoulders" of extreme-velocity gas, usually a sign of interaction. The diffuse stellar light corresponds generally but not in detail with the distribution of H i. In particular, the stellar light of the main tidal arm extends beyond the H i layer, which is limb-brightened as if it had been compressed from outside. The pattern of gas velocities is generally bisymmetric, but the H i layer is strongly warped; it does not share the kinematics of the stellar disk. The gas orbits twist by at least 90° between 1' and 3' of the center, as the H i layer appears to warp through edge-on. The complex optical tails and H i dynamics suggest that the galaxy has undergone multiple mergers. Both at small and at large radii, the gas layer twists in a trailing sense relative to its orbital motion. If the twist results from differential precession in the galaxy's gravitational potential, this would indicate that the dark halo is prolate, elongated along the rotation axis of the disk.
Export citation and abstract BibTeX RIS
1. INTRODUCTION
NGC 2655 (Arp 225 = UGC 4637) is a bright nearby S0/a galaxy with a low-luminosity Seyfert 2 nucleus. The galaxy is sometimes classified as barred, although the strongly asymmetrical dust pattern illustrated in Figure 1 complicates this interpretation. Infrared images are less affected by dust; Laurikainen & Salo (2002) analyzed images in the H band at 1.6 μm, finding a weak bar with strength intermediate between their SA (unbarred) and SAB (somewhat barred) categories. NGC 2655 has an active nucleus, with a compact flat-spectrum radio source (Keel & Hummel 1988; Nagar et al. 2000; Ho & Ulvestad 2001) and heavily-absorbed hard X-ray emission (Terashima et al. 2000) in addition to a Seyfert spectrum at visible wavelengths (Sil'chenko & Burenkov 1990).
Figure 1. Left: B-band image of NGC 2655 from the WIYN 3.5 m telescope, 18 kpc on a side, showing the bright nucleus and asymmetric dust absorption. North is at the top and east to the left. Right: B–R color map shows red areas as dark and blue areas as bright. Absorption is far more prominent to the right of the nucleus than to the left; a curved dust lane runs eastwest about 70'' south of the center. Download figure:

Erwin & Sparke (2003) obtained images of NGC 2655 with a WIYN 3.5 m telescope; these are shown in Figure 1. In the left panel, we see that the stellar disk is close to face-on, with its right side partially obscured by dust. Dust reddening is prominent in the color image of the right panel. These authors suggested that the gas layer was inclined, lying in front of the stellar disk only on the west side. The galaxy would then be a polar ring system, where a ring of gas, dust, and stars orbits almost over the pole of a central "host" galaxy: see Sparke (2004) for a recent review. It would be unusual for two reasons. Polar rings are most easily identified when both the ring and the central galaxy are seen close to edge-on; few members of the catalog of Whitmore et al. (1990) show the host galaxy face-on. When the host is a disk system, the ring is typically quite large in radius and encircles the stellar disk; a polar ring with an elliptical host galaxy is more often buried inside the host's stellar body (Whitmore 1991; Reshetnikov & Sotnikova 1997).
Sil'chenko & Afanasiev (2004) and Dumas et al. (2007) performed kinematic observations within a few arcseconds of the galaxy center, to find ionized gas in ordered rotation with the largest receding velocities close to the line PA = 180°. Both these authors and Rothberg & Joseph (2006) found the largest receding velocities in the stellar disk along the near-orthogonal direction at PA ≈ −90°, close to the major axis of the stellar light. So the ionized gas does not lie in the plane of the stellar disk, but shares the kinematics expected for the dusty gas. Sil'chenko & Afanasiev (2004) identified NGC 2655 and five other systems as "inner polar rings" (Corsini et al. 2003), in which polar material orbits well within the stellar disk of an S0 or even a spiral host galaxy.
NGC 2655 is the brightest member of a group (NBGG 12-10 in the Nearby Galaxy Groups catalog of Tully 1988) with ten NGC and UGC galaxies lying within 1 Mpc on the sky and 200 km s−1 in redshift. Clearly, it has not led a quiet life. In the outer parts, Arp (1966) noted "very faint diffuse outer arms." Our deep optical images in Figure 2 show ripples and shells suggestive of a recent merger or accretion. Huchtmeier & Richter (1982) found a very large envelope of H i gas extending nearly 30' or 150 kpc in radius around NGC 2655 and its small companion UGC 4701. The group includes other gas-rich galaxies, including the Sc galaxy NGC 2715 with Figure 2. Top left: R-band image of NGC 2655 from the WIYN 0.9 m telescope, roughly 12' across; dashed lines show tidal arms or shells around the galaxy. White circles result from removing regions around bright stars. North is at the top and east to the left. Top right: The light of a best-fitting smoothed elliptical model has been subtracted from the R-band image. The "diffuse dwarf" (D) stands out prominently to the top right, as do the two tidal arms (A) to the north. Below: B–R color map shows red areas as dark (B–R = 2.0 in the darkest regions) and blue areas as bright (B–R = 1.4 is lightest). The "dwarf" and the two tidal arms are bluer than their surroundings. Download figure: of H i. Previous interferometric mapping has shown that the gas of NGC 2655 is in complex motion (Shane & Krumm 1983; Noordermeer et al. 2005); it clearly does not lie in the plane of the stellar disk.
To examine how the gas kinematics within a few arcseconds of the center might be connected with the arcminute-scale dust lane, the outer ripples and shells in the starlight, and the large H i envelope, we undertook both optical imaging and mapping of the neutral gas in the 21 cm line of hydrogen with the Very Large Array (VLA) radio telescope. Section 2 presents our optical images, and Section 3 describes our VLA observations. The distribution of the H i gas is discussed in Section 4 and the gas motions in Section 5. Section 6 presents tilted-ring models for the H i kinematics, and we summarize in Section 7.
Table 1 gives basic information on NGC 2655. Below we derive a systemic velocity of 1380 km s−1; taking H0 = 75 km s−1Mpc−1 yields a distance of 18.4 Mpc, and 1' = 5.35 kpc.
Table 1. Basic Data for NGC 2655
| Reference | ||
|---|---|---|
| Classification | S0/a, Seyfert 2 | SB90 |
| Redshift | 1380 km s−1 | HR82, this work |
| Adopted distance | 18.4 Mpc; 1' = 5.35 kpc | |
| K-Band brightness (Ktot) | mK = 6.95 | 2MASS |
| K-Band luminosity (LK) |  |
|
| B-Band brightness | (B0T) = 10.82 | RC3 |
| B-Band luminosity (LB) |  |
|
| Optical diameter (D25) | 4.9' = 26 kpc | RC3 |
| Inclination of stellar disk | 25° | ES03 |
| Position angle of stellar disk | 85° E of N | 2MASS |
| Stellar rotation Vsin i at PA = 84° | 83 ± 6 km s−1 | RJ06 |
| Stellar central velocity dispersion | 169 ± 11 km s−1 | RJ06 |
Note. SB90: Sil'chenko & Burenkov (1990); HR82: Huchtmeier & Richter (1982); 2MASS: Jarrett et al. (2003); RC3: de Vaucouleurs et al. (1991); ES03: Erwin & Sparke (2003); RJ06: Rothberg & Joseph (2006).
Download table as: ASCIITypeset image
2. DEEP OPTICAL IMAGING OF NGC 2655
In the images of Figure 1, taken in B and R bands with the WIYN 3.5 m telescope by Erwin & Sparke (2003), an asymmetric dust lane obscures the galaxy only to the west of its center. This pattern suggests that within about 50'' radius, a disk of dusty gas is tilted about a north–south axis, so that its west side lies in front of the galaxy's stellar disk and the east side behind. The dust lanes spiral counterclockwise with increasing radius. If they have the expected trailing sense, the angular momentum vector of the gas disk must point away from us, and the receding line of nodes, where the redshift is largest, should lie to the south. This is exactly what Sil'chenko & Afanasiev (2004) found for the central ionized gas; the dusty and ionized material appear to form part of the same structure. The bright "comet" shape 20'' east of the center near the top of the frame appears to lie on a continuation of the dust spiral. It shows blue light both from hot stars and dust reddening. A dust arc elongated eastwest passes roughly 70'' to the south of the center, suggesting that at these radii, there is gas in front of the galaxy to the south.
Figure 2 shows a larger area of the galaxy, from B and R images taken with the WIYN 0.9 m telescope. These were obtained and reduced using the techniques described in Wehner & Gallagher (2005). The low-surface-brightness features in the outer parts are most prominent in the top right panel, where the light of a best-fitting smoothed elliptical model has been subtracted. The diffuse light stretches across 9', corresponding to 50 kpc or twice the optical diameter D25. To the northeast we see a tidal arm, stretching from the "comet" feature of Figure 1 out toward PA = 45°, then bending back toward the center. Outside that is an arm to the northwest which is brightest at its outer edge, like the shells found around some elliptical galaxies (Malin & Carter 1983). Such outer stellar features generally indicate a merger.
There are two patches of diffuse stellar light to the northwest along a line roughly in PA = −45°, and one to the southeast roughly along the same line, at a radius intermediate between the two northern patches. The largest and most distant patch, roughly 5' northwest of the center, may be the diffuse dwarf galaxy identified by Karachentseva et al. (1996). It is reminiscent of the diffuse and very smooth dwarf galaxy NGC 1023A that lies roughly 2.6' from the center of the gas-rich SB0 galaxy NGC 1023 (Capaccioli et al. 1986). The color map in the bottom panel of figure 2 shows that the "dwarf " and the patch of diffuse light to the southeast are bluer than the main galaxy by 0.2–0.3 magnitudes in B–R. This suggests that they may be the disrupted remains of a metal-poor dwarf galaxy, or one that has undergone some star formation ∼1 Gyr in the past.
3. OBSERVATIONS AT 21 CM AND DATA REDUCTION
NGC 2655 was observed with the VLA in the 21 cm neutral hydrogen line on 1997 September 13 in the C-configuration and on 1997 December 30 in the D-configuration. The total length of each observation was 12 h, 82% of which was spent on source, and 18% on overhead, which includes calibrator observations and antenna slewing. Observational details common to both observing runs are listed in Table 2.
Table 2. VLA Observations
| Pointing right ascension (J2000) | 08h 55m 38.5s |
| Pointing declination (J2000) | 78° 14' 00.0'' |
| Observing frequency (band center) | 1413.8 MHz/1400 km s−1 |
| Bandwidth | 6.25 MHz/1280 km s−1 |
| Number of channels | 64 |
| Channel width | 96 kHz/20.8 km s−1 |
| Synthesized beam (C and D array data combined) | 39'' × 38'' |
| Noise per channel (rms for combined C and D data) | 0.26 mJy/beam |
Download table as: ASCIITypeset image
All data reduction was done using the NRAO image processing system AIPS. Data editing (removing "bad" data) and calibration was done completely separately for the C- and D-array data sets. The frequency-independent antenna gains were determined by repeatedly observing the nearby point source 0841+708, and the flux scale and the frequency-dependent antenna gains by observing 0137+331 (3C48) twice and 1331+305 (3C286) once. After applying the calibration, the continuum was subtracted from the visibility data. Since there were many line-free channels at both ends of the bandpass, this caused only a negligible increase in the noise level. This resulted in two separate continuum-free visibility data sets, one for C-, and one for D-array observations.
We created image cubes (with dimensions R.A., decl., and velocity) by Fourier transforming these two data sets and applying the "CLEAN" technique (Clark 1980), which iteratively replaces the dirty beam responses with equivalent Gaussians. Inspection of both cubes showed that whereas clear H i detections were made in the D-array data, detection in the C-array data was marginal at best. In order to find the proper data to use in the subsequent reduction, we performed imaging tests not only on both visibility data sets separately, but also on a combined set. The main free parameter is the robustness factor (Briggs 1995; Briggs et al. 1999), which during the Fourier transform describes to what extent each cell in the uv plane is weighted by the number of visibilities in each cell.
Using D-array data alone, we created maps at 39'' spatial resolution by applying a robustness of −0.6, which led to a 0.40 mJy/beam rms noise level. By using the combined data we achieved this same angular resolution with a robustness of 0.2, and a 0.26 mJy/beam rms noise level—a much better result. This 0.26 mJy/beam noise level is only 6% higher than that using natural weighting, which would have resulted in a 54'' beam with the familiar huge positive sidelobes typical of natural weighting. We used the cubes generated by imaging the combined C- and D-array data with a robustness of 0.2 for all subsequent data reduction. It is interesting to note that whereas the C-array data by themselves were of little use, adding them to D-array data significantly increased the image quality and reduced the noise level as compared to D-array data only.
A side-effect of the continuum subtraction is that the line-free channels of each visibility data set can be combined to obtain a continuum data set. As with the line data, we combined the two continuum data sets and imaged the result, allowing us to determine the position and flux density of the central continuum source in NGC 2655. These and other results derived from the observations are listed in Table 3.
Table 3. Derived Quantities for NGC 2655 and UGC 4701
| NGC 2655 | UGC 4701 | |
|---|---|---|
| Right ascension central continuum source | 08h 55m 38.3s ± 0.1s | |
| Declination central continuum source | 78° 13' 23.4'' ± 0.2'' | |
| Flux central continuum source | 113 ± 5 mJy | |
| Maximum H i absorption against continuum | 0.8% | |
| H i column density in front of continuum | 0.78 × 10¹⁸ Tspin cm−2 | |
| Systemic velocity | 1380 ± 5 km s−1 | 1410 ± 5 km s−1 |
| Profile width at 20% of peak flux (W20) | 449 km s−1 | |
| Profile width at 50% of peak flux (W50) | 256 km s−1 | |
| Total H i Flux (Jy km s−1) | 23.6 | 6.1 |
Total H i Mass ( ) ) |
1.9 | 0.49 |
| M(H i)/LK, M(H i)/LB (solar units) | 0.02, 0.08 | |
HI diameter at  |
11.1' ≈ 59 kpc | 2.7' ≈ 15 kpc |
| Dynamical mass Mdynsin i within 400'' |  |
|
| Mdynsin i/LK (solar units) | >4 | |
| Orbital period at 400'' (Gyr) | 0.95/sin i |
Download table as: ASCIITypeset image
4. CONTINUUM SOURCE AND DISTRIBUTION OF NEUTRAL HYDROGEN
We detect a central continuum source with a flux of 113 ± 5 mJy, consistent with earlier 1.46 GHz maps at higher resolution. Keel & Hummel (1988) found 94 ± 2 mJy in a main central source and 13 ± 0.5 mJy in a secondary component 14'' southeast of the nucleus and within our beam. Ho & Ulvestad (2001) also found a third component about 40'' to the northwest, but at only half the strength of the secondary.
Figure 3 shows absorption roughly 1 mJy (0.8% or 6-σ) deep centered near 1380 km s−1, the systemic velocity derived by fitting a rotation curve to the regular portion of the velocity field: see below. This is what we would expect if the absorbing gas had come between us and the continuum source on a near-circular orbit about the nucleus that we see close to edge-on. The absorption extends across four channels or about 80 km s−1, which is far narrower than typical motions in an active nucleus (e.g., Peterson 1997). It is more naturally explained by small noncircular distortions of the gas orbits. The column density required to produce this absorption depends on the unknown spin temperature Tspin as 0.78 × 10¹⁸ Tspin cm−2. But since we expect Tspin < 100 K, it is considerably less than the column of 4 × 1023 cm−2 in front of the central X-ray source (Terashima et al. 2000).
Figure 3. Intensity at the location of the continuum source as a function of velocity, after continuum subtraction and cleaning of the H i line emission. The spectrum has been Hanning smoothed. The central velocity of the absorption profile (1380 km s−1) agrees with our derived systemic velocity. Download figure:
Figure 4 shows the global profiles of H i emission in NGC 2655 and its neighbor UGC 4701, 20' to the east. The total fluxes were determined using a method which corrects for flux per dirty beam without requiring deep cleaning (Jörsäter & van Moorsel 1995). The flux for NGC 2655 is very close to the 22.3 Jy km s−1 derived by Noordermeer et al. (2005) from mapping at Westerbork. The sum of the two fluxes, 29.7 Jy km s−1, is consistent with the 33.1 ± 3.6 Jy km s−1 found by Huchtmeier & Richter (1982) in their single-dish mapping of a region that includes both galaxies. Thus very little gas is in an extended component that would be missed in our maps. In NGC 2655, we have Figure 4. Global H i profiles of NGC 2655 (solid line) and UGC 4701 (dashed line). Fluxes have been corrected for primary beam attenuation. Download figure: of H i gas, so that M(H i)/LB ≈ 0.08 in solar units. This is in the middle of the range found by Noordermeer et al. (2005) for gas-rich S0 and S0a galaxies, and by Oosterloo et al. (2007) for E and S0 galaxies detected in H i in the HIPASS blind survey.

The global profile for NGC 2655 does not have the characteristic steep-sided double-horned shape of a disk galaxy, but shows gently-sloping "shoulders." Just as Huchtmeier and Richter found, the width W20 at 20% of maximum flux is much larger than the width W50 at 50% of peak flux: we measure W20/W50 = 1.75. Such a shallow-sided profile is often a sign of disturbance or interaction (Gallagher et al. 1981), and it is not common. The sample of Noordermeer et al. (2005) includes 41 S0 and Sa galaxies with linewidths W50>200 km s−1 (objects that are neither face-on nor small), but only two have the ratio W20/W50>1.4. One of these has long H i tails, and the other shows disturbed gas with stellar shells and a ring.
If we assume that the H i gas lies in the stellar disk, we derive an implausibly high circular speed for the galaxy. Around 120'' radius, beyond most of the dust, the disk isophotes have ellipticity 1 − b/a = 0.1 in the R band (Erwin & Sparke 2003). This would correspond to a thin disk at inclination i = 25° from face-on. To estimate the circular speed Vrot, we use the prescription of Tully & Fouqué (1985) to correct the measured linewidth W20 for internal motions of the gas, to obtain the adjusted linewidth WR ≈ 2Vrotsin i. Our WR ≈ 411 km s−1 implies a rotation speed of 486 km s−1, almost as fast as UGC 12591, the most rapidly-rotating disk galaxy known (Giovanelli et al. 1986), which is far more luminous than NGC 2655.
We can estimate the expected maximum circular speed using the Tully–Fisher relation. The K-band luminosity from Table 1 corresponds via Equation (8) of Tully & Pierce (2000) to an adjusted linewidth WR = 437 km s−1, less than our measured W20 of 449 km s−1. However, Bedregal et al. (2006) show that S0 galaxies follow a Tully–Fisher relation offset from the spirals; they are roughly a magnitude fainter for a given rotation speed. Applying this correction would give NGC 2655 an adjusted width WR = 568 km s−1 and hence a rotation speed of 284 km s−1. This is far less than we derived above by assuming the H i to be coplanar with the stellar disk; we conclude that we see the gas orbits at a much higher inclination.
For our illustrative model below, we adopt a constant circular speed intermediate between these two values at 250 km s−1. The fastest-moving gas we observe, at large radii along an east–west line, must then orbit at least 60° away from face-on. These are close to the values Vrot = 230 km s−1 and i = 58° found for ionized gas within 0.4 kpc of the center by Sil'chenko & Burenkov (1990).
Figure 5 shows our channel maps for the H i gas around NGC 2655, and Figure 6 shows the total hydrogen column density. The galaxy's H i diameter at a surface density of Figure 5. Channel maps of the H i emission associated with NGC 2655, spaced 41.6 km s−1 apart. Only every other channel map is shown. Lowest contours are −0.625 mJy/beam (dashed) and 0.625 mJy/beam (solid), which is 2.5 times the rms noise level. Each higher contour is twice the level of the previous contour. Download figure: Figure 6. Total H i emission around NGC 2655 integrated over velocity. The line T1–T2 passes through areas with higher than usual second-moment values, suggesting broad or multiple velocity profiles. The densest gas lies roughly along the dashed ellipse. The long-dashed curve shows the trail of gas toward the companion UGC 4714. The cross marks the center, where we see absorption against the continuum source. The lowest H i contour is at 2.5 × 10¹⁹ atoms cm−2 or Download figure: is roughly 60 kpc, or 2.3 times the optical diameter D25. This is larger than the normal ratio of 1.7 ± 0.5 for spirals (Broeils & Rhee 1997), but is fairly typical of gas-rich S0/a galaxies, where much of the gas often lies outside the main stellar body (Noordermeer et al. 2005). The gas distribution is not centrally peaked, and may have a central hole. The H i distribution is asymmetric, with a strong concentration to the north. Splitting the galaxy along an eastwest line through its center, the northern half of the galaxy contains roughly 30% more gas than the southern portion. Both a central hole and an asymmetric H i distribution are typical in the sample of Noordermeer et al. (2005).
 ; each successive contour is at twice the flux level of the previous contour. The small circle in the lower left corner shows our beam size.

The H i is limb-brightened along a partial arc roughly 2' north of the center. Gas in the arc shows kinematically distinct components, illustrated in Figure 10 as a position–velocity cut along the line T1–T2 in Figure 6. This arc, and the blob of dense gas at the southwestern edge about 5' from the center, appear to form part of a ring of denser gas shown by the dashed ellipse in Figure 6. If this is intrinsically circular, we see it inclined at about 60° to the sky plane. A ridge of emission runs roughly north–south from the arc down through the center. The H i arc and the ridge are the only regions where the H i surface density exceeds the threshold of  normally required for widespread star formation (e.g., Schaye 2004). However, the color maps in Figures 1 and 2 show no young blue stars in these regions. This suggests that the volume density of the gas is lower than is typical in a galactic disk.
Like the reddened region in the right panel of Figure 1, the H i ridge lies mainly to the north of the center. Presumably dust mixed with this gas has caused the absorption and reddening. But the northern arc has an even higher surface density of H i; if this lay in front of the galaxy or within its stellar disk, we would expect to see strong reddening from the dust mixed with it. However, Figure 1 shows no additional reddening at this position. Instead, a reddened arc runs roughly east–west about 70'' south of the galaxy center. This suggests that at these radii the southern gas lies in front of the stellar disk and the northern gas behind it.
In Figure 7, contours of hydrogen column density are superposed on the deep R-band image of Figure 2. Like the H i distribution, the faint diffuse light of the galaxy is elongated almost east–west. The diffuse light and the H i correspond generally but not in detail. The dense limb-brightened H i arc runs parallel to and close to the northeastern tidal arm in the stellar distribution, but the stellar arm extends further from the galaxy center than does the gas. The diffuse patch of light about 5' to the northwest falls just inside the elliptical H i ring shown in Figure 6.
Figure 7. Total H i emission around NGC 2655 integrated over velocity, superposed on the deep R-band optical image of Figure 2. Except at the northwest, the diffuse stellar light and faint tidal arms in the outer galaxy are associated with H i gas. Download figure:

Figure 8 shows the distribution of H i in the area around NGC 2655 and its neighbor UGC 4701. From the northwest corner of NGC 2655, a streamer of gas and blobs of emission appear to connect with the small Sb galaxy UGC 4714, lying 31' or 165 kpc away on the sky at the nearby redshift of 1257 km s−1. This low-velocity gas contributes to the "shoulder" in Figure 4. In the mean velocity field of Figure 9, we see that the connecting gas is also continuous in its motion, as its velocity drops smoothly toward that of UGC 4714. The bright knot of emission to the southwest at 1200 km s−1 may be part of the same structure. However, smoothing the cube in position and velocity does not reveal any continuous streamer of emission connecting the two galaxies. UGC 4714 itself falls close to the null of our primary beam, and we do not detect it. The very gas-rich spiral NGC 2715 to the east is detected even though it is well outside the primary beam.
Figure 8. Total H i emission over the whole VLA primary beam, superposed on an optical image from the Digital Sky Survey. It clearly shows the emission associated with UGC 4701 and the trail of gas pointing in the direction of UGC 4714, a small disk galaxy that lies close to a null in the VLA primary beam. The lowest contour level corresponds to the 3-σ rms noise level. To ensure a uniform noise level over the whole image, this map was not corrected for primary beam attenuation. This correction factor is very small for the emission around NGC 2655, but it would increase the emission associated with UGC 4701 by a factor of 3–5. Download figure: Figure 9. Mean velocity field (first moment map) of the H i emission around NGC 2655, showing radial velocities in km s−1. We found multiply-peaked profiles at the top right where our contours crowd closely together, and along the line T1–T2 in Figure 6. Elsewhere the values in this map are representative of the radial velocity at that position. Contours are spaced at 50 km s−1 about the systemic velocity of 1380 km s−1; two extreme contours are labeled with their radial velocity. Download figure:
5. NEUTRAL HYDROGEN KINEMATICS
The mean velocity field in Figure 9 shows a pattern of orderly rotation over most of the galaxy. The velocity profiles are singly-peaked except near the H i arc of Figure 6, and in the two regions of very crowded velocity contours at the northwestern edge, where there is little gas. We therefore interpret it in terms of the familiar tilted-ring model (Rots 1975; Begeman 1987, 1989) in which gas follows concentric circular orbits with an orientation that varies continuously with radius. We derived the systemic velocity by fitting a tilted-ring model to this velocity field. Allowing the orbits to vary in position angle and inclination, but keeping the central position fixed at the location of the central continuum source, following van Moorsel & Wells (1985), yields Vsys = 1380 ± 5 km s−1. In the outer parts, the gas rotates about an axis close to north–south; the western side is receding, in the same sense as the stellar motions measured by Sil'chenko & Afanasiev (2004). Close to the nucleus we see rotation about a nearly perpendicular axis, with gas receding to the south, sharing the motion that Sil'chenko & Afanasiev (2004) found for the ionized gas. In the southern half of the galaxy where velocity profiles are singly-peaked, the contour at the systemic velocity of 1380 km s−1 lies near PA = 120° at small radii, and twists counterclockwise past PA = 180° (south) before reversing the sense of twist.
Figure 10 shows the pattern of H i velocities along the line T1–T2 in Figure 6, cutting through the region parallel to the tidal arm where velocity profiles are multiply peaked. The stronger ridge of emission closer to the systemic velocity represents the H i arc. In Section 6, we will use a tilted-ring model to interpret this pattern as showing emission from a warped disk that passes multiple times across our line of sight.
Figure 10. A position–velocity plot along the line T1–T2 in Figure 6, through areas with double velocity profiles. Velocities are measured from the systemic velocity; the more intense emission at lower velocities comes from the H i arc. In the tilted-ring model illustrated in the right panel of Figure 13, this strong emission represents gas orbits at about 300'' radius, while the weaker emission corresponds to material closer to the center where we expect the gas density to be low. Contour levels are linearly spaced at (−1, 1, 2, 3, 4, ..., 16) × 0.52 mJy/beam, with negative contours shown by a broken line. Download figure:

In Figure 11, we see H i emission along radial cuts through the center of the galaxy. Gas following any set of tilted circular orbits about the center would give rise to emission symmetric about the central point. The plots at PA = −78°, close to the major axis of the H i distribution, and +12° near the minor axis, clearly display this symmetry. Along PA = −78°, velocities increase almost linearly with radius to reach 230 km s−1 to the east and nearly 300 km s−1 to the west. Gas is present on both sides to at least 7.5' from the center. Taking Vrot = 230 km s−1 at a radius of 400'' and assuming that we see the gas edge-on yields a conservative lower limit for the dynamical mass, Figure 11. Position–velocity plots through the center of NGC 2655 along four different position angles. The first panel (PA = −78°) is close to the apparent major axis of the stellar disk; position angles in subsequent panels are 45° apart, and the third panel (PA = 12°) therefore is along the apparent minor axis of the stellar disk. North is always at the top of the vertical axis, and velocities are measured from the systemic velocity. Contour levels are the same as in Figure 10. Download figure: and hence M/LK>4. An old stellar population typically has M/LK ∼ 1 (Bell et al. 2003) so this system contains substantial dark matter. There is a little gas near the center with high velocities, up to 150 km s−1 away from Vsys. The central pixel of our map includes all the material within roughly 2 kpc of the nucleus, and this gas probably lies off the major axis.

We see a complex pattern along the perpendicular axis at PA = +12°. Speeds are largest close to the center, reaching at least 200 km s−1 on both sides, even though in Figure 9 there are no closed contours to the north of the center below 1330 km s−1, only 50 km s−1 from the systemic velocity. With increasing radius the velocities pass through zero and reverse their sign; they then change back to resume the original sign, reaching at least 100 km s−1 from Vsys at large radii. In the northern (upper) half of this plot, we see strong emission from the prominent H i arc, and the same multiple velocity profiles shown in Figure 10.
The intermediate cut at PA = +57° shows the same "U" pattern as at PA = +12°, but the velocities are almost entirely negative (blueshifted) in the upper (northeast) half of the galaxy and redshifted in the lower half. The cut at PA = −33° passes through the northwestern streamer toward NGC 4714; we see blueshifted gas at the top of the plot. This cut is noticeably less symmetric than the others, suggesting that the gas has been disturbed.
6. TILTED-RING MODELS FOR THE GAS LAYER
Here we present some illustrative tilted-ring models to account for the complex structures of Figure 11. Table 4 summarizes which aspects of those position–velocity cuts are well fit by each model. We begin by showing why we can exclude two simple possibilities: a coplanar disk and a monotonic twist.
Table 4. Tilted Ring Models for NGC 2655
| Model | Fits Well | Fits Poorly |
|---|---|---|
| H i coplanar with stars | H i at PA = −78° only | Most H i, dust; linearly rising rotation |
| Monotonic twist | PA = −78°, PA = −33° | PA = 12°, PA = 57°, dust |
| Complex twist, fixed tilt | H i emission | Dust |
| Complex twist, changing tilt | H i emission, dust |
Note. Position angles refer to the H i position–velocity plots of Figure 11.
Download table as: ASCIITypeset image
The left panel of Figure 12 shows what we would expect if the H i gas shared the plane of the galaxy's stellar disk, with inclination i = 25° and position angle PA = −95° along the receding line of nodes, where the gas orbits cross the plane of the sky. We could reproduce the linear rise in velocity along PA = −78° if the gas was roughly in solid-body rotation. That would be highly unusual in an S0 or Sa galaxy, where the rotation curve more usually rises to its maximum value within a few hundred parsecs of the center (e.g., Noordermeer et al. 2007). However, this model also predicts linearly rising speeds along the other directions, which is not what we see in Figure 11. This reinforces our earlier conclusion that little, if any, of the H i lies in the plane of the stellar disk.
Figure 12. Longitude–velocity plots for two simple tilted-ring models, along directions matching those in Figure 11. The symbols differentiate gas near the center (blue crosses) from that further out (red dots). Orbits at intermediate radii are shown by small dots, and a dotted line in the lower plots. Left: Gas orbits in the plane of the stellar disk, at inclination i = 25° with receding line of nodes at PA = −95°; the rotation curve rises linearly, to match the observed motion in PA = −78°. Lower panels show the position angle of the receding line of nodes, and the circular speed. Right: The rotation speed Vrot = 250 km s−1 and inclination i = 60° are held constant, but the position angle increases linearly (lower panels) to produce a rise in velocity along PA = −78°. Neither of these simple models reproduces the pattern of velocities along PA = 12° and PA = 57°. Download figure:

The right panel of Figure 12 shows that the gas orbits must twist with radius, but that the twist cannot be monotonic. It shows the pattern expected for gas orbits at constant inclination, but with the position angle twisting linearly by 90° between the center and 500'' radius. Since our beam size of 40'' corresponds already to 3.6 kpc, we do not expect to resolve a rising portion of the rotation curve, and simply assume a constant rotation speed Vrot = 250 km s−1. We choose a fairly high inclination of 60°, guided by the appearance of the dust lane in Figure 1. We can now account for both the linear rise along PA = −78° and the observed high central velocities along the other directions. But we do not reproduce the "U" shaped pattern of velocities along PA = +12°, and the "U" at PA = +57° faces in the wrong direction, with velocities highest at intermediate radii.
Figure 13 shows two models in which the position angle of the gas orbits has a more complex twist. In the left panel, the rotation curve is flat at Vrot = 250 km s−1 and the inclination remains constant at 60°. The position angle of the gas orbits follows the pattern suggested by the contour at velocity Vsys = 1380 km s−1 in Figure 9. It twists from close to south (PA = −180°) at small radii past west (PA = −90°) at about 200''; at yet larger radii it swings back toward the south. The twist in the line of nodes ensures that velocities rise only slowly with increasing radius along the major axis (PA = −78°). The observed high-velocity gas that appears right at the center along this direction in Figure 11 is not present in the model; it is likely to be a result of integrating over our 40'' beam.
Figure 13. As Figure 12, but for models with circular velocity Vrot = 250 km s−1 at all radii and a more complex tilted-ring structure. The position angle of the receding line of nodes lies to the south (PA ≈ −180°) at small radii before twisting to the west (PA ≈ −90°) and then reversing its sense of twist. Left: A model with constant inclination; Right: The inclination changes so that the gas passes edge-on to our line of sight. Points are plotted only where the orbits cross each radial line, without accounting for our finite-sized beam. Download figure:

In the perpendicular direction (PA = 12°), the "U" pattern in the ridge of emission is produced as the line of nodes reaches an extremum and swings back toward its inner value. Near the center velocities are high, since the model orbits cross the plane of the sky along this direction. Velocities fall through zero at larger radius, and their sign reverses as the line of nodes swings back to north–south. Velocities at the extreme outer edge of the disk are lower in the model than what we observe, but we cannot push them higher without causing a drop along the major axis at PA = −78°. Along PA = −33° our model reproduces the observed high central velocities, but the "U" peaks are too strongly bent; they would correspond to doubly-peaked velocity profiles, which we do not see. Along PA = 57° the model predicts a "Z" shape, which might be seen as a "U" if there is little gas along the middle segment.
The H i velocities cannot tell us which side of the gas disk lies closest to us; they do not discriminate between gas orbits at inclination i < 90° where the angular momentum vector points toward us, and those at 180° − i with angular momentum pointing away. However, the optical images of Figure 1 tell us that within 1' of the center the gas disk lies in front of the galaxy to the west; the southern gas recedes, so the inclination i>90°. About 70'' south of the center we see an eastwest arc of dust, and in Section 4 we noted that the H i arc, about 2' north of the center, does not redden the galaxy disk. Together these imply that in its outer parts the south side of the gas disk is closer to us while the north side lies behind the stellar disk. The gas recedes to the west, along PA ≈−90°, so its orbital angular momentum points toward us, and we have i < 90°. The gas disk appears continuous, so at intermediate radii i = 90° and the orbits must turn almost edge-on to our line of sight. Gas in those orbits would be moving transverse to the line of sight as it passes in front of the nucleus. It would cause absorption in the global H i profile close to the systemic velocity, just as we see in Figure 3.
The right panel in Figure 13 explores a model in which the rotation curve is unchanged and the gas orbits follow the same run of position angle, but the gas disk warps through edge-on at about 125''. At the inner radii and for the outer orbits, the model differs little from that in the left panel. At intermediate radii (represented by small dots in the upper plots), we now see gas at zero velocity near the center along all the directions: this corresponds to material in edge-on orbits, However, the gas density must be low at these radii, since in Figure 11 it is only at PA + −78° that we see strong emission near the center close to Vsys.
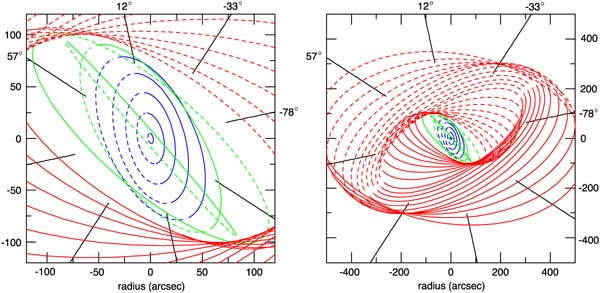
Figure 14 shows the gas orbits in this last model. Dense gas filling the inner orbits within 100'' of the center would correspond to the dusty gas disk in Figure 1 and the north–south H i ridge in Figure 6. A ring of denser gas at 300'' radius would correspond to the dashed ellipse in Figure 6. These orbits pass in front of the galaxy to the south, so that dust mixed with the gas gives rise to the absorption that we see in the lower part of Figure 1. The H i arc north of the center lies in a region where orbits at around 300'' cross orbits at smaller radius in projection. We then expect multiply-peaked velocity profiles as seen in Figure 10, with the dense gas of the arc seen closer to the systemic velocity. These orbits are not close to each other in space, so the gas is not compressed and we do not expect increased star formation. Orbits at intermediate radii would contain relatively little gas.
Figure 14. Tilted-ring display for the model in the right panel of Figure 13. Left: inner portion only; Right: entire model. Line segments indicate the position angles of Figure 11. Orbits lying behind the "sky" plane are shown as dashed lines. Colors and line types for the portion of the orbits in front of the sky plane correspond to the radial zones of Figure 13: solid lines show gas near the center (blue crosses in Figure 13), dotted lines show orbits at intermediate radii (small dots), and solid lines are used for the outermost orbits (closed dots). Download figure:
The model of Figure 14 can represent only features in the gas distribution that are symmetric on both sides of the galaxy. It does not account for the fact that the northern arc, and the strong ridge connecting that arc to the center, are much stronger than the corresponding features to the south, or for the presence of multiply-peaked velocity profiles only in the north. The model fails to reproduce the sloping "shoulders" of the H i global profile in Figure 4. Most of the model orbits are tilted at 60° or 120° to the sky plane, and these should contribute a double-horned profile with two peaks separated by roughly 435 km s−1. The fastest-moving gas is observed at the extreme east and west edges; this material is likely to have been disturbed by the merger that produced the stellar tidal arms and faint debris. The asymmetric extension to the northwest, and the trail of gas toward the companion UGC 7414, presumably result from an interaction.
7. DISCUSSION
In NGC 2655, a nearby bright S0/a galaxy with a strongly asymmetric dust lane, we find a disk with  of neutral hydrogen stretching to 60 kpc in diameter, or 2.3D25. Our deep optical images show tidal arms and regions of diffuse starlight well beyond the main galaxy, slightly bluer than the rest of the galaxy and suggestive of a recent merger. The H i gas does not lie in the plane of the main stellar disk, but instead follows near-circular orbits in a strongly twisted and highly inclined disk. The H i layer appears to be continuous in velocity between its central kiloparsec and the outer material at 30–40 kpc radius. The orbital time in the outer parts of the H i disk is roughly 1 Gyr, so we would expect that the merger took place a few orbits ago; this is consistent with the optical colors. The strong dust absorption suggests that the accreted gas is metal-rich, implying that the captured system was luminous. A trail of H i at slightly lower velocity connects a knot of emission at the southeast with a streamer of gas leading north toward the small companion UGC 4714.
The extent of the H i disk in NGC 2655, its regular rotation but low surface density, its asymmetric distribution, and its central hole are typical of gas-rich early-type galaxies, such as those in the samples of Noordermeer et al. (2005) and the SAURON early-type galaxies studied by Morganti et al. (2006). In two-thirds of the luminous elliptical and S0 galaxies detected in the blind H i survey HIPASS (Oosterloo et al. 2007), the gas forms a large disk or ring up to 200 kpc across, in fairly regular rotation; almost none of it lies in the plane of the stellar disk. But the sloping shoulders to the H i profile of NGC 2655 are quite unusual; only two of 41 comparable galaxies mapped by Noordermeer et al. (2005) show similar kinematics, and both are clearly disturbed.
The densest gas lies in an arc roughly 2' to the north, and in a ridge running north–south connecting that arc to the center. Although the surface density here exceeds the star-formation threshold of Schaye (2004), our optical images show no recent star formation. This suggests that the gas is at lower volume density than expected for material in the midplane of a galaxy disk.
In its central parts, the dusty gas disk is inclined about a north–south axis with the west side in front. Its motion agrees with that of the ionized gas in the inner few arcseconds, and disagrees with that of the stellar disk (Sil'chenko & Afanasiev 2004; Dumas et al. 2007). The line of largest receding velocity then twists counterclockwise through more than 90°, which is reminiscent of the peculiar galaxy NGC 3718 (Schwarz 1985; Sparke 2002; Sparke et al. 2008). The line of nodes, where the gas orbits cross the plane of the sky, thus also twists counterclockwise, in the trailing sense as indicated by the spiral in the inner dusty gas. Since the western half of the gas disk is in front of the stellar body at small radii, a simple counterclockwise twist in the line of nodes would bring the northern gas disk in front. However, there is no sign of dust absorption from the very dense northern H i arc, while we do see a dusty feature to the south. We conclude that the gas orbits have warped through edge-on, at roughly the same radius where the twist in the line of nodes reverses itself. This means that the outer twist is again in a trailing sense relative to the orbital motion.
A disk made up of material following orbits tilted to the symmetry plane of a galaxy that is not spherical will become twisted, because the individual orbits precess under gravity. In an oblate galaxy, vertical oscillations are faster than the orbital frequency, so the line where each orbit crosses the symmetry plane will regress, in the direction opposite to the orbital motion. Orbital periods are shorter toward the center, so if the galaxy's flattening does not vary strongly with radius, the inner orbits regress faster and the gas disk develops a leading twist. Conversely, a disk in a prolate galaxy potential will develop a trailing twist. Thus if the gas disk of NGC 2655 has been twisted by differential precession, the gravitational potential must have a prolate form, with the mass distribution elongated perpendicular to the stellar disk. It is surprising to find evidence for a prolate mass distribution within only 2' or 10 kpc of the galaxy center, where we might expect the flattened stellar body to dominate the gravitational potential. Helmi (2004) used radial velocities measured by Law et al. (2005) for stars torn from the Sagittarius dwarf galaxy to argue that the Milky Way's mass distribution is prolate; but other indicators (see, e.g., Fellhauer et al. 2006) disagree.
The distribution of H i corresponds generally but not in detail with features in the faint stellar light. No increase in gas density is associated with the "diffuse dwarf " of Figure 2, and the northern H i arc appears limb-brightened, with the stars extending beyond the sharp outer edge of the gas distribution. The starburst galaxy NGC 3256 presents the same puzzle; Figure 7.1 of English (1994) shows that the bright stellar arm to the west (most clearly seen in their Figure 5.1) is in an area free of H i gas. The H i disk of the Large Magellanic Cloud is limb-brightened at 2.2 kpc = 2.3° from the center, and beyond a radius of 4° (3.5 kpc) it shows tidal arms that have no counterparts in the outer stellar contours (Staveley-Smith et al. 2003). These authors suggest that "shocks, self-gravity, or possibly external ram pressure" have acted to separate stars and gas. In the starburst NGC 3310, a large stellar loop (Wehner & Gallagher 2005; Wehner et al. 2006) is apparently unrelated to the two tidal tails of H i mapped by Kregel & Sancisi (2001). Wehner and collaborators suggest that multiple discrete events, or multiple passes of a single intruding galaxy which is stripped of its gas before being swallowed, are required to explain this morphology. A similar complexity seems to be required in the case of NGC 2655.
We would like to thank Jay Gallagher for helpful discussion and a critical reading of the manuscript. G.v.M. and L.S.S. would like to thank the MPI for Astrophysics in Garching, Germany, for hospitality while part of this work was carried out; L.S.S. thanks the National Radio Astronomy Observatory (NRAO) for hospitality in Socorro, NM. P.E. was supported by DFG Priority Program 1177; L.S.S. acknowledges support from the National Science Foundation through grant AST-00-98419; E.M.H.W. was supported through AST-98-03018. E.M.H.W. would also like to thank the Natural Sciences and Engineering Research Council of Canada for their financial support. The NRAO is a facility of the National Science Foundation operated under cooperative agreement by Associated Universities, Inc. The NASA/IPAC Extragalactic Database (NED) is operated by the Jet Propulsion Laboratory, California Institute of Technology, under contract with the National Aeronautics and Space Administration (NASA). This research has made use of NASA's Astrophysics Data System (ADS). The WIYN Observatory is a joint facility of the University of Wisconsin–Madison, Indiana University, Yale University, and the National Optical Astronomy Observatories.