


ABSTRACT
IM Per is a detached A7 eccentric eclipsing binary star. We have obtained extensive measurements of the light curve (28,225 differential magnitude observations) and radial velocity curve (81 spectroscopic observations) which allow us to fit orbits and determine the absolute properties of the components very accurately: masses of 1.7831 ± 0.0094 and 1.7741 ± 0.0097 solar masses, and radii of 2.409 ± 0.018 and 2.366 ± 0.017 solar radii. The orbital period is 2.25422694(15) days and the eccentricity is 0.0473(26). A faint third component was detected in the analysis of the light curves, and also directly observed in the spectra. The observed rate of apsidal motion is consistent with theory (U = 151.4 ± 8.4 year). We determine a distance to the system of 566 ± 46 pc.
Export citation and abstract BibTeX RIS
1. INTRODUCTION
IM Per first shows up in the 5th Supplement to the 2nd edition of the General Catalogue of Variable Stars (GCVS) (Efremov 1969), also known as SVS 952, attributed to Meshkova (1944), who gives coordinates, a magnitude range, and a finder chart. Meshkova (1951) gave a photographic light curve and eclipse ephemeris. It was suspected to be a member of the cluster CR 39 (α Per cluster) by Sahade & Davilla (1963), Popova & Kraichev (1984), and Zakirov & Shaidullin (1985). The distance we determine below (566 ± 46 pc) does not seem to be compatible with the known cluster distance (166 ± 30 pc, Crawford & Barnes 1974), however. Other than these few works, the star had only a few times of minimum light reported until now.
2. EPHEMERIS AND APSIDAL MOTION
Numerous measurements of the times of eclipse of IM Per have been made in the last 20 years using photoelectric/CCD techniques. Nine additional determinations were obtained from our own photometric measurements described below. Table 1 collects all of these observations (60 minima for the primary and 41 for the secondary), along with their published uncertainties. To these we have added a much older photographic time of primary eclipse from the GCVS (Kholopov 1987) that is likely much less precise, but extends the baseline significantly. We are unable to trace the original source of that determination in the literature.
Table 1. Times of Eclipse for IM Per
| Year | HJD 2,400,000 | Error Estimate (days) | Epoch | Ecl Type |
 (days) (days) |
Source | |
|---|---|---|---|---|---|---|---|
| 1 | 1950.7087 | 33541.35 | ⋯ | −9371 | 1 | −0.00065 | 1 |
| 2 | 1994.8922 | 49679.3692 | ⋯ | −2212 | 1 | 0.00097 | 2 |
| 3 | 1994.9169 | 49688.3858 | ⋯ | −2208 | 1 | 0.00064 | 2 |
| 4 | 1996.0093 | 50087.3845 | 0.0003 | −2031 | 1 | −0.00014 | 2 |
| 5 | 1996.8116 | 50380.4335 | 0.0008 | −1901 | 1 | −0.00163 | 3 |
| 6 | 1999.6012 | 51399.3520 | ⋯ | −1449 | 1 | 0.00277 | 4 |
| 7 | 2000.1135 | 51586.4521 | 0.0005 | −1366 | 1 | 0.00137 | 5 |
| 8 | 2003.7178 | 52902.9245 | 0.0006 | −782 | 1 | 0.00046 | 6 |
| 9 | 2003.7394 | 52910.8277 | 0.0007 | −779 | 2 | 0.00155 | 6 |
| 10 | 2003.9091 | 52972.8038 | 0.0004 | −751 | 1 | −0.00153 | 6 |
| 11 | 2003.9308 | 52980.7065 | 0.0006 | −748 | 2 | −0.00041 | 6 |
| 12 | 2003.9338 | 52981.8219 | 0.0004 | −747 | 1 | −0.00037 | 6 |
| 13 | 2004.0758 | 53033.6699 | 0.0003 | −724 | 1 | 0.00022 | 7 |
| 14 | 2004.6806 | 53254.5845 | 0.0003 | −626 | 1 | −0.00024 | 8 |
| 15 | 2004.9491 | 53352.6518 | 0.0002 | −583 | 2 | −0.00107 | 9 |
| 16 | 2005.0447 | 53387.5848 | 0.00019 | −567 | 1 | 0.00026 | 10 |
| 17 | 2005.0478 | 53388.7205 | 0.0003 | −567 | 2 | 0.00014 | 10 |
| 18 | 2005.0941 | 53405.6176 | 0.0003 | −559 | 1 | −0.00090 | 10 |
| 19 | 2005.0941 | 53405.6184 | 0.00019 | −559 | 1 | −0.00009 | 10 |
| 20 | 2005.2145 | 53449.5832 | 0.0005 | −540 | 2 | −0.00105 | 10 |
| 21 | 2005.7236 | 53635.5494 | 0.0005 | −457 | 1 | −0.00111 | 11 |
| 22 | 2005.7823 | 53656.9719 | 0.0019 | −448 | 2 | −0.00039 | 10 |
| 23 | 2005.8502 | 53681.7703 | 0.0004 | −437 | 2 | 0.00161 | 10 |
| 24 | 2005.8779 | 53691.9074 | 0.0005 | −432 | 1 | 0.00101 | 10 |
| 25 | 2005.9952 | 53734.7368 | 0.0005 | −413 | 1 | −0.00006 | 12 |
| 26 | 2005.9952 | 53734.7371 | 0.0004 | −413 | 1 | 0.00024 | 12 |
| 27 | 2006.0662 | 53760.6667 | 0.0003 | −402 | 2 | 0.00038 | 12 |
| 28 | 2006.7512 | 54010.8849 | 0.0006 | −291 | 2 | 0.00039 | 12 |
| 29 | 2006.7913 | 54025.5320 | 0.0023 | −284 | 1 | −0.00122 | 13 |
| 30 | 2006.8006 | 54028.9216 | 0.0008 | −283 | 2 | 0.00335 | 12 |
| 31 | 2006.8253 | 54037.9354 | 0.0002 | −279 | 2 | 0.00028 | 12 |
| 32 | 2006.8253 | 54037.9356 | 0.0005 | −279 | 2 | 0.00048 | 12 |
| 33 | 2006.8685 | 54053.7154 | 0.0005 | −272 | 2 | 0.00075 | 12 |
| 34 | 2006.8901 | 54061.6011 | 0.0003 | −268 | 1 | 0.00011 | 12 |
| 35 | 2007.0166 | 54107.8150 | 0.0003 | −248 | 2 | −0.00088 | 12 |
| 36 | 2007.0629 | 54124.7191 | 0.0002 | −240 | 1 | −0.00048 | 12 |
| 37 | 2007.2048 | 54176.5689 | 0.0004 | −217 | 1 | 0.00191 | 12 |
| 38 | 2007.7202 | 54364.7974 | 0.0004 | −134 | 2 | 0.00069 | 14 |
| 39 | 2007.7449 | 54373.8136 | 0.0002 | −130 | 2 | 0.00001 | 14 |
| 40 | 2007.7973 | 54392.9735 | 0.0002 | −121 | 1 | −0.00009 | 14 |
| 41 | 2007.8189 | 54400.8635 | 0.0004 | −118 | 2 | −0.00070 | 14 |
| 42 | 2007.8405 | 54408.7535 | 0.0002 | −114 | 1 | 0.00026 | 14 |
| 43 | 2007.8436 | 54409.8810 | 0.0005 | −114 | 2 | −0.00007 | 14 |
| 44 | 2007.8436 | 54409.8827 | 0.0004 | −114 | 2 | 0.00163 | 14 |
| 45 | 2007.8621 | 54416.6436 | 0.0004 | −111 | 2 | −0.00013 | 14 |
| 46 | 2008.0565 | 54487.6514 | 0.0003 | −79 | 1 | −0.00007 | 14 |
| 47 | 2008.1059 | 54505.6866 | 0.0003 | −71 | 1 | 0.00115 | 14 |
| 48 | 2008.9946 | 54830.2946 | 0.0004 | 73 | 1 | −0.00074 | 15 |
| 49 | 2009.0039 | 54833.6742 | 0.0007 | 74 | 2 | 0.00026 | 16 |
| 50 | 2009.7600 | 55109.8221 | 0.0007 | 197 | 1 | 0.00157 | 14 |
| 51 | 2010.1210 | 55241.6872 | 0.0006 | 255 | 2 | −0.00018 | 17 |
| 52 | 2010.7567 | 55473.8723 | 0.0003 | 358 | 2 | 0.00047 | 17 |
| 53 | 2010.8030 | 55490.7857 | 0.0003 | 366 | 1 | −0.00060 | 17 |
| 54 | 2010.8030 | 55490.7865 | 0.0003 | 366 | 1 | 0.00020 | 17 |
| 55 | 2010.8492 | 55507.6854 | 0.0004 | 373 | 2 | 0.00030 | 17 |
| 56 | 2010.8492 | 55507.6862 | 0.0005 | 373 | 2 | 0.00110 | 17 |
| 57 | 2010.8524 | 55508.8225 | 0.0021 | 374 | 1 | 0.00232 | 18 |
| 58 | 2010.8986 | 55525.7190 | 0.0007 | 381 | 2 | 0.00016 | 17 |
| 59 | 2010.9141 | 55531.3608 | 0.0008 | 384 | 1 | −0.00171 | 19 |
| 60 | 2010.9141 | 55531.3613 | 0.0005 | 384 | 1 | −0.00121 | 19 |
| 61 | 2010.9141 | 55531.3620 | 0.0004 | 384 | 1 | −0.00051 | 19 |
| 62 | 2010.9202 | 55533.6170 | 0.0004 | 385 | 1 | 0.00023 | 17 |
| 63 | 2010.9511 | 55544.8885 | 0.0004 | 390 | 1 | 0.00055 | 17 |
| 64 | 2010.9943 | 55560.6675 | 0.0005 | 397 | 1 | −0.00009 | 20 |
| 65 | 2011.0159 | 55568.5474 | 0.0007 | 400 | 2 | −0.00158 | 17 |
| 66 | 2011.0190 | 55569.6845 | 0.0003 | 401 | 1 | −0.00003 | 17 |
| 67 | 2011.0684 | 55587.7179 | 0.0009 | 409 | 1 | −0.00052 | 17 |
| 68 | 2011.7966 | 55853.7152 | 0.0008 | 527 | 1 | −0.00298 | 21 |
| 69 | 2011.7997 | 55854.8319 | 0.0011 | 527 | 2 | −0.00276 | 22 |
| 70 | 2011.7997 | 55854.8329 | 0.0006 | 527 | 2 | −0.00176 | 21 |
| 71 | 2011.8028 | 55855.9707 | 0.0006 | 528 | 1 | −0.00172 | 21 |
| 72 | 2011.8028 | 55855.9733 | 0.0004 | 528 | 1 | 0.00088 | 21 |
| 73 | 2011.8213 | 55862.7355 | 0.0003 | 531 | 1 | 0.00038 | 21 |
| 74 | 2011.8398 | 55869.4983 | ⋯ | 534 | 1 | 0.00047 | 23 |
| 75 | 2011.8429 | 55870.6150 | ⋯ | 534 | 2 | 0.00081 | 23 |
| 76 | 2011.8583 | 55876.2613 | ⋯ | 537 | 1 | 0.00077 | 23 |
| 77 | 2011.8584 | 55876.2630 | ⋯ | 537 | 1 | 0.00247 | 23 |
| 78 | 2011.9108 | 55895.4090 | ⋯ | 545 | 2 | −0.00159 | 23 |
| 79 | 2011.9108 | 55895.4090 | ⋯ | 545 | 2 | −0.00159 | 23 |
| 80 | 2011.9108 | 55895.4091 | ⋯ | 545 | 2 | −0.00149 | 23 |
| 81 | 2012.0126 | 55932.6164 | 0.0009 | 562 | 1 | −0.00002 | 22 |
| 82 | 2012.0126 | 55932.6170 | 0.0003 | 562 | 1 | 0.00058 | 21 |
| 83 | 2012.0157 | 55933.7326 | 0.0005 | 562 | 2 | 0.00031 | 21 |
| 84 | 2012.0373 | 55941.6331 | 0.0003 | 566 | 1 | −0.00026 | 21 |
| 85 | 2012.0620 | 55950.6503 | 0.0002 | 570 | 1 | 0.00000 | 21 |
| 86 | 2012.7933 | 56217.7647 | 0.0005 | 688 | 2 | 0.00093 | 24 |
| 87 | 2012.8211 | 56227.9232 | 0.0006 | 693 | 1 | 0.00197 | 25 |
| 88 | 2012.8335 | 56232.4271 | ⋯ | 695 | 1 | −0.00260 | 23 |
| 89 | 2012.8335 | 56232.4279 | ⋯ | 695 | 1 | −0.00180 | 23 |
| 90 | 2012.8335 | 56232.4285 | ⋯ | 695 | 1 | −0.00120 | 23 |
| 91 | 2012.9353 | 56269.6109 | 0.0006 | 711 | 2 | 0.00012 | 24 |
| 92 | 2013.0587 | 56314.6955 | 0.0004 | 731 | 2 | 0.00036 | 24 |
| 93 | 2013.6111 | 56516.4675 | ⋯ | 821 | 1 | 0.00416 | 23 |
| 94 | 2013.7407 | 56563.8022 | 0.0005 | 842 | 1 | −0.00008 | 26 |
| 95 | 2013.7654 | 56572.8197 | 0.0004 | 846 | 1 | 0.00048 | 26 |
| 96 | 2013.7932 | 56582.9487 | 0.0005 | 850 | 2 | 0.00160 | 26 |
| 97 | 2013.8117 | 56589.7089 | 0.0004 | 853 | 2 | −0.00085 | 26 |
| 98 | 2013.8425 | 56600.9805 | 0.0005 | 858 | 2 | −0.00035 | 26 |
| 99 | 2013.8580 | 56606.6337 | 0.0005 | 861 | 1 | 0.00096 | 26 |
| 100 | 2013.8642 | 56608.8869 | 0.0003 | 862 | 1 | −0.00008 | 26 |
| 101 | 2014.0277 | 56668.6047 | 0.0006 | 888 | 2 | −0.00269 | 26 |
| 102 | 2014.0555 | 56678.7672 | 0.0004 | 893 | 1 | −0.00107 | 26 |
Note. "Ecl Type" is 1 for primary minima and 2 for secondary minima. The current eclipse ephemeris is HJD MinI = 2,454,665.736068(85) + 2.25423576(26) E. Uncertainties for the photoelectric/CCD timings are listed as published. For those with no published errors we assigned an uncertainty of 0.0019 days, and 0.008 days for the single GCVS measurement (see Section 4). Our analysis indicates that published internal errors for the photoelectric/CCD timings are underestimated by factors of 1.9 and 2.2 for the primary and secondary, respectively.
References (1) GCVS, (2) Agerer & Hubscher (1996), (3) Agerer & Hubscher (1998), (4) http://var.astro.cz/ocgate/ocgate.php?star=IM%20Per, (5) Agerer & Hubscher (2002), (6) Lacy (2003), (7) Lacy (2004), (8) Hubscher et al. (2005), (9) Nelson (2005), (10) Lacy (2006), (11) Hubscher et al. (2006), (12) Lacy (2007), (13) Hubscher & Walter (2007), (14) Lacy (2009), (15) Hubscher et al. (2010), (16) Diethelm (2009), (17) Lacy (2011), (18) Diethelm (2011), (19) Brat et al. (2013), (20) Nelson (2011), (21) Lacy (2012), (22) Diethelm (2012), (23) Honkova et al. (2011), (24) Lacy (2013), (25) Diethelm (2013), (26) this paper.
The timings display clear signs of apsidal motion, and an initial ephemeris-curve fit (see Lacy 1992) suggested an apsidal period near U = 170 years and a small but significant eccentricity around e = 0.05. However, the very strong correlations between U, e, and the longitude of periastron ω (correlation coefficients all greater than 0.99) indicate that external information is required to better constrain the solution. A natural way to achieve this is by making use of the eccentricity that can be derived from our radial-velocity measurements presented below, or alternatively from the analysis of the light curves. However, either option must in turn take into account the motion of the apsides in deriving an eccentricity. We defer a description of our approach to this problem until Section 4, where we combine the eclipse times with our radial velocity measurements into a simultaneous fit for the spectroscopic orbital elements and the apsidal motion, and we further constrain this adjustment by also using the eccentricity from the light-curve fits.
3. SPECTROSCOPIC OBSERVATIONS
IM Per was observed spectroscopically with three different instruments. Monitoring began in 2004 January at the Harvard-Smithsonian Center for Astrophysics (CfA) with an echelle spectrograph ("Digital Speedometer," DS, Latham 1992) mounted on the 1.5 m Tillinghast reflector at the F. L. Whipple Observatory (Mount Hopkins, AZ). A total of 10 spectra were recorded through 2007 December with an intensified photon-counting Reticon detector providing 45 Å of coverage centered at 5187 Å, and including the Mg i b triplet. The resolving power of this instrument was approximately R = 35,000, and the signal-to-noise ratios (S/Ns) of the spectra range from 14 to 39 per resolution element of 8.5 km s−1. Observations of the dusk and dawn sky were obtained every night for the purpose of monitoring the velocity zero point; small run-to-run corrections based on those observations were applied to the velocities reported below, as described by Latham (1992).
An additional 22 spectra were obtained with the bench-mounted Tillinghast Reflector Echelle Spectrograph (TRES; Furesz 2008) and its CCD detector on the same telescope from 2010 January to 2014 February. These observations cover the entire optical range (3860–9100 Å) in 51 orders, at a resolving power of about R = 44,000. The S/Ns near the Mg i b region range from 32 to 89 per resolution element of 6.8 km s−1. Instrumental drifts for TRES are below 10 m s−1 in velocity, and are negligible for our purposes.
From 2011 October through 2014 February we acquired 49 usable spectra of IM Per with the Tennessee State University 2 m Automatic Spectroscopic Telescope (AST) and a fiber-fed echelle spectrograph (Eaton & Williamson 2007) at Fairborn Observatory in southeast Arizona. The detector for these observations was a Fairchild 486 CCD, having 4096 × 4096 15 micron pixels. Although the spectrograms have 48 orders ranging from 3800–8260 Å, we have analyzed just the orders that cover the wavelength region from 4920–7100 Å. Because of the faintness and rapid rotation of IM Per, we used a fiber that produced a spectral resolution of 0.4 Å, corresponding to a resolving power of 15000 at 6000 A. See Fekel et al. (2013) for additional information about the AST facility. Our spectra have typical S/Ns of 40 at 6000 Å.
Radial velocities from the CfA spectra were derived using the two-dimensional cross-correlation algorithm TODCOR (Zucker & Mazeh 1994), along with templates for the primary and secondary taken from a large library of synthetic spectra based on model atmospheres by R. L. Kurucz (see Nordstrom et al. 1994; Latham et al. 2002). The procedures we followed are identical to those described in our recent studies of the eclipsing systems AP And (Sandberg Lacy et al. 2014) and AQ Ser (Torres et al. 2014), to which we refer the reader for further details. The optimal effective temperatures and projected rotational velocities for the stars were derived by running grids of cross-correlations over wide ranges in the template parameters, seeking the best match between the templates and the observed spectra as measured by the mean cross-correlation coefficient averaged over all exposures (see Torres et al. 2002). Surface gravities were held fixed at values near our final determinations below, and we assumed solar metallicity. Based on indications from our light-curve analysis described later that the temperatures of the two stars are very similar, we enforced equality and obtained 7580 ± 150 K, corresponding to a spectral type of A6 or A7. The  values were 58 ± 3 km s−1 for the primary (star A, the marginally more massive star eclipsed at the deeper minimum) and 57 ±3 km s−1 for the secondary. Templates in our library nearest to these values were used for determining the radial velocities (7500 K and 60 km s−1 for both stars). The heliocentric velocities from the CfA spectra (both instruments) are given in Table 2, along with their uncertainties.
Table 2. Heliocentric Radial Velocities of IM Per from the CfA Spectra
| HJD 2,400,000 | RVA(km s−1) | σA(km s−1) | RVB (km s−1) | σB(km s−1) | Phase | RVC (km s−1) | Instr |
|---|---|---|---|---|---|---|---|
| 53011.6453 | −157.75 | 5.58 | 94.19 | 3.59 | 0.2270 | −46.5 | DS |
| 53271.9519 | 76.21 | 3.63 | −146.30 | 2.33 | 0.7019 | ⋯ | DS |
| 53278.8896 | 88.54 | 4.01 | −154.97 | 2.58 | 0.7796 | −19.0 | DS |
| 53339.7785 | 90.88 | 5.30 | −155.07 | 3.40 | 0.7906 | −14.9 | DS |
| 53340.7695 | −157.55 | 4.07 | 91.35 | 2.62 | 0.2302 | −41.5 | DS |
| 53694.7804 | −151.46 | 5.41 | 87.70 | 3.48 | 0.2733 | −27.0 | DS |
| 53748.7242 | −149.67 | 4.28 | 92.65 | 2.75 | 0.2034 | −20.8 | DS |
| 54077.7801 | −140.86 | 10.24 | 74.25 | 6.58 | 0.1762 | −25.4 | DS |
| 54138.6881 | −147.24 | 5.02 | 81.30 | 3.23 | 0.1957 | −34.1 | DS |
| 54457.7045 | 90.89 | 6.58 | −147.12 | 4.23 | 0.7149 | −45.4 | DS |
| 55201.6684 | 89.24 | 1.57 | −153.52 | 1.55 | 0.7455 | −23.4 | TRES |
| 55237.6377 | 80.73 | 2.32 | −146.32 | 2.29 | 0.7019 | −37.0 | TRES |
| 55513.8319 | −155.85 | 1.34 | 91.67 | 1.32 | 0.2247 | −27.3 | TRES |
| 55521.7910 | 89.68 | 1.55 | −155.57 | 1.53 | 0.7554 | −22.1 | TRES |
| 55824.9739 | −153.99 | 1.04 | 91.48 | 1.03 | 0.2507 | −35.6 | TRES |
| 55876.9349 | −147.98 | 1.51 | 81.31 | 1.49 | 0.3012 | ⋯ | TRES |
| 55884.8046 | 85.28 | 2.48 | −151.07 | 2.45 | 0.7923 | −17.3 | TRES |
| 55901.7892 | −138.77 | 2.93 | 70.70 | 2.89 | 0.3268 | −33.0 | TRES |
| 55910.7604 | −141.57 | 1.72 | 81.00 | 1.70 | 0.3066 | −27.4 | TRES |
| 55936.6737 | 86.45 | 2.25 | −151.69 | 2.22 | 0.8020 | −19.8 | TRES |
| 55963.5980 | 88.79 | 2.57 | −154.19 | 2.54 | 0.7459 | −27.3 | TRES |
| 55988.6073 | 76.30 | 2.19 | −141.56 | 2.16 | 0.8403 | −30.5 | TRES |
| 56206.8550 | 62.67 | 1.69 | −133.23 | 1.67 | 0.6574 | −23.1 | TRES |
| 56257.6117 | −148.70 | 1.69 | 83.89 | 1.67 | 0.1736 | −42.8 | TRES |
| 56284.6440 | −145.54 | 2.03 | 79.62 | 2.00 | 0.1655 | −39.3 | TRES |
| 56558.8501 | 85.86 | 2.25 | −152.37 | 2.22 | 0.8063 | −36.5 | TRES |
| 56577.8910 | −154.88 | 2.57 | 90.41 | 2.54 | 0.2531 | −33.7 | TRES |
| 56621.8148 | 83.45 | 1.82 | −152.88 | 1.80 | 0.7382 | −25.0 | TRES |
| 56646.5749 | 84.91 | 1.89 | −149.14 | 1.87 | 0.7220 | −24.6 | TRES |
| 56671.5862 | 80.63 | 2.03 | −150.81 | 2.00 | 0.8173 | −33.0 | TRES |
| 56698.6127 | 85.89 | 1.79 | −150.83 | 1.76 | 0.8066 | −30.5 | TRES |
| 56706.5927 | −128.71 | 2.13 | 61.00 | 2.10 | 0.3466 | −35.1 | TRES |
Notes. Phases are computed from the ephemeris in the last column of Table 4, with phase 0.0 indicating the deeper eclipse of the marginally more massive star (primary). The last column indicates the instrument used. Typical uncertainties for the tertiary velocities are 11 km s−1 for DS and 7 km s−1 for TRES.
Download table as: ASCIITypeset image
We also computed the light ratio directly from the DS and TRES spectra following Zucker & Mazeh (1994), and we obtained consistent values that we averaged to LB/LA = 0.95 ± 0.03 at a mean wavelength of 5187 Å, which is not far from the standard visual band.
Fekel et al. (2009) gave a general explanation of the velocity measurement of our Fairborn echelle spectra. For IM Per we measured radial velocities with both our A-type star line list, which primarily consists of singly ionized lines, and our solar-type star line list, which includes mostly neutral lines. Even though the average summed profile of the two stars with the solar-type line list is weaker than that of the A-type star line list, the more extensive number of lines in the solar list resulted in more consistent velocities. Those velocities were determined by fitting the individual lines with rotational broadening functions (Lacy & Fekel 2011) that allowed both the depth and width of the line fits to vary. Our unpublished measurements of several IAU solar-type velocity standards show that these Fairborn Observatory velocities have a zero-point offset of −0.6 km s−1 when compared to the results of Scarfe (2010). So, 0.6 km s−1 has been added to each velocity. From the solar-type line list for the AST spectra, the average projected rotational velocities of components A and B (as identified in the adopted orbital solution) are 57 and 56 km s−1 with an estimated uncertainty of 3 km s−1 for both components. The equivalent width ratio of the averaged summed profiles of the solar-type star line list produces the light ratio LB/LA = 0.97 ±0.04 at 6000 Å.
The Fairborn velocity measurements are listed in Table 3, and have typical uncertainties of 2.9 km s−1 for the primary and 3.0 km s−1 for the secondary.
Table 3. Heliocentric Radial Velocities of IM Per from the Fairborn Observatory
| HJD 2,400,000 | RVA (km s−1) | RVB (km s−1) | Phase |
|---|---|---|---|
| 55865.5976 | −151.9 | 85.2 | 0.2718 |
| 55894.6273 | −139.4 | 76.4 | 0.1497 |
| 55927.8430 | 56.8 | −119.1 | 0.8846 |
| 55930.6621 | −130.7 | 69.8 | 0.1352 |
| 55944.8026 | −98.7 | 28.2 | 0.4081 |
| 55981.6671 | 94.2 | −153.5 | 0.7616 |
| 56188.9536 | 84.0 | −147.2 | 0.7161 |
| 56203.7323 | −156.0 | 91.7 | 0.2721 |
| 56214.7276 | −136.4 | 76.3 | 0.1498 |
| 56215.7074 | 24.8 | −98.2 | 0.5844 |
| 56220.7699 | 76.8 | −141.8 | 0.8302 |
| 56221.6802 | −156.7 | 94.3 | 0.2340 |
| 56229.6580 | 90.5 | −153.7 | 0.7731 |
| 56230.6722 | −156.3 | 94.2 | 0.2230 |
| 56235.0311 | −140.9 | 74.7 | 0.1566 |
| 56238.6486 | 88.2 | −150.8 | 0.7614 |
| 56245.6434 | 65.8 | −129.9 | 0.8644 |
| 56246.6138 | −143.6 | 81.1 | 0.2948 |
| 56248.6072 | −148.2 | 83.6 | 0.1791 |
| 56253.6417 | −94.5 | 24.4 | 0.4125 |
| 56254.5897 | 78.6 | −141.4 | 0.8330 |
| 56255.5900 | −153.5 | 88.7 | 0.2768 |
| 56256.5964 | 86.3 | −153.5 | 0.7232 |
| 56257.5882 | −140.6 | 81.0 | 0.1632 |
| 56265.6079 | 88.4 | −151.8 | 0.7208 |
| 56266.6083 | −141.3 | 79.0 | 0.1646 |
| 56267.6074 | 41.8 | −106.9 | 0.6078 |
| 56271.5916 | −115.0 | 53.3 | 0.3753 |
| 56272.5916 | 83.6 | −146.0 | 0.8189 |
| 56273.6125 | −149.1 | 91.5 | 0.2718 |
| 56274.5912 | 79.4 | −146.4 | 0.7059 |
| 56282.5958 | −153.2 | 91.0 | 0.2569 |
| 56290.6902 | 74.6 | −139.9 | 0.8476 |
| 56304.8036 | −119.1 | 55.3 | 0.1085 |
| 56310.8339 | 91.0 | −150.1 | 0.7836 |
| 56354.6655 | −157.4 | 94.5 | 0.2278 |
| 56356.6610 | −120.3 | 58.1 | 0.1130 |
| 56363.6941 | −157.1 | 90.4 | 0.2330 |
| 56540.8213 | 90.9 | −146.6 | 0.8085 |
| 56540.8213 | 88.6 | −146.9 | 0.8085 |
| 56552.9596 | −153.4 | 90.3 | 0.1932 |
| 56563.9999 | −108.1 | 43.1 | 0.0908 |
| 56568.9770 | −145.5 | 85.0 | 0.2987 |
| 56569.7534 | 56.3 | −123.1 | 0.6431 |
| 56570.7480 | −102.4 | 41.3 | 0.0844 |
| 56583.7534 | 74.1 | −133.8 | 0.8537 |
| 56585.7471 | 89.9 | −154.3 | 0.7381 |
| 56676.7176 | −109.4 | 48.2 | 0.0936 |
| 56706.7364 | −94.9 | 30.8 | 0.4103 |
Notes. Phases are computed from the ephemeris in the last column of Table 4, with phase 0.0 indicating the deeper eclipse of the marginally more massive star (primary). Typical uncertainties are 2.9 km s−1 for the primary and 3.0 km s−1 for the secondary.
Download table as: ASCIITypeset image
Our analysis of the light curves for IM Per described later suggests the presence of another star contributing "third light" to the photometry, which may or may not be physically associated with the eclipsing binary. Prompted by this suggestion, we reexamined our CfA spectra more closely with the three-dimensional cross-correlation algorithm TRICOR (Zucker et al. 1995), which is an extension of TODCOR to three dimensions. In almost all of our DS and TRES spectra we did indeed see a correlation peak located between those of the main stars, and we were able to measure its velocity, although at much lower precision, confirming the presence of an additional body in the system. With an educated guess at the temperature for the tertiary template of 5500 K, we determined the brightness of the third star (star C) to be  from our DS spectra and 0.020 ± 0.010 from our TRES spectra, both at the mean wavelength of 5187 Å, and near the limit of detectability. The mean velocities measured for the third star are −30.5 ± 3.5 km s−1 and −30.1 ± 1.4 km s−1 for the DS and TRES spectra, respectively, which are not far from the center-of-mass velocity reported for the system in Section 4. This suggests that the third star may well be physically associated. We list the individual velocities in Table 2. They have typical uncertainties of about 11 km s−1 for the DS spectra and 7 km s−1 for TRES.
The temperatures and rotational velocities of the two stars suggest that the components could have Am star peculiarities (Abt & Morrell 1995). To search for evidence of such peculiarities, the best Fairborn spectra were velocity shifted and added together to improve the S/N, so that first the primary lines and then the secondary lines were aligned. In the resulting two spectra the region around 6430 Å, which contains several strong Ca i lines, was examined for Am star characteristics. We compared the Ca i line strengths to Fe i line strengths in that region and also compared the two spectra with those of known Am stars of similar temperature. No evidence of significantly weakened Ca i lines, which would be expected for classical Am stars (Abt & Morrell 1995), was found. The two stars might still be mild or marginal Am stars, but in the spectra of such stars line strength changes between the overabundant and underabundant elements that are hallmarks of the Am peculiarity are much more difficult to detect.
4. JOINT SPECTROSCOPIC/EPHEMERIS-CURVE ANALYSIS
Our radial-velocity observations of IM Per span slightly more than a decade, and over that interval apsidal motion will have caused a change in the longitude of periastron of roughly 20°. This is significant compared to the formal uncertainties in ω derived from separate purely Keplerian orbital fits to the CfA and Fairborn velocities, which are 3 3 and 22, respectively. Consequently, we developed a custom program to use the 102 eclipse timings reported in Section 2 together with the radial velocities in a simultaneous fit to solve for both the rate of apsidal motion and the spectroscopic orbital elements. This approach properly accounts for the effects of apsidal motion on the velocities, and strengthens the determination of the apsidal motion by using the velocities to constrain the orbital eccentricity. As in Section 2, we used the ephemeris curve formulation of Lacy (1992) for the timing measurements, with the inclination angle held fixed at the value adopted in our final analysis below. We applied this joint fit separately to the two velocity data sets.
A few of the eclipse timings listed in Table 1 have no published uncertainties, so we assigned the same initial value to all of them and adjusted it by iterations to achieve a reduced chi-squared value of unity for those 14 measurements. The final error was 0.0019 days. Similarly, previous experience has shown that published eclipse timing errors are often underestimated. We therefore adjusted the published values iteratively by scaling them up to achieve reduced chi-squared values of unity, separately for the primary and secondary measurements. The final scale factors were 1.9 for the primary and 2.2 for the secondary. We assigned an uncertainty of 0.008 days to the single GCVS timing.
The separate spectroscopic/ephemeris-curve fits for the CfA and Fairborn velocities are shown in the second and third columns of Table 4. An additional free parameter was included to account for a possible offset between the primary and secondary velocities, but the result in both cases is not significantly different from zero. The two solutions yield very similar elements, the only exception being the semiamplitude of the primary star, KA, which shows a difference of 1.3 km s−1 2.3σ. We attribute this to the difficulty in measuring velocities for stars with significant rotational broadening such as these ( near 60 km s−1 for both components). The discrepancy translates to differences in the minimum masses of about 1.2% and 2.2% for the primary and secondary.
Table 4. Spectroscopic/Ephemeris-curve Solutions for IM Per
| CfA | Fairborn | Combined | Adopted | |
|---|---|---|---|---|
| Psid (days) | 2.25422694(16) | 2.25422693(16) | 2.25422692(15) | 2.25422694(15) |
| Panom (days) | 2.2543130(50) | 2.2543139(47) | 2.2543121(34) | 2.2543189(49) |
| gamma (km s−1) | −32.76(35) | −32.10(37) | −32.77(37) | −32.74(38) |
| KA (km s−1) | 122.58(37) | 123.88(43) | 123.15(29) | 123.17(30) |
| KB (km s−1) | 123.75(35) | 123.86(48) | 123.79(28) | 123.80(28) |
| e | 0.0507(29) | 0.0501(26) | 0.0512(21) | 0.0473(26) (fixed) |
| ω at TminI (degree) | 91.07(14) | 91.08(14) | 91.06(13) | 91.14(15) |
| TminI (HJD 2,400,000) | 54665.736085(88) | 54665.736074(89) | 54665.736078(85) | 54665.736068(85) |
| Tperi (HJD 2,400,000) | 54665.74214(87) | 54665.74218(87) | 54665.74205(80) | 54665.742553(80) |
| dω/dt (degree/cycle) | 0.01375(80) | 0.01389(75) | 0.01361(54) | 0.01468(81) |
| dω/dt (degree/day) | 0.00610(35) | 0.00616(33) | 0.00604(24) | 0.00651(35) |
| U (year) | 161.6(94) | 159.9(87) | 163.3(64) | 151.4(84) |
| i (degree) | 84.40 (fixed) | 84.40 (fixed) | 84.40 (fixed) | 84.40(20) (fixed) |
| MA sin3i (MSun) | 1.747(11) | 1.769(15) | 1.7562(90) | 1.7577(91) |
| MB sin3i (MSun) | 1.731(12) | 1.769(14) | 1.7471(91) | 1.7488(94) |
| aA sini (Gm) | 3.795(11) | 3.835(14) | 3.8124(90) | 3.8137(92) |
| aB sini (Gm) | 3.831(11) | 3.835(15) | 3.8321(87) | 3.8331(88) |
| asini (RSun) | 10.962(23) | 11.025(29) | 10.989(18) | 10.992(18) |
| q = MB/MA | 0.9905(41) | 1.0001(52) | 0.9948(33) | 0.9949(33) |
| Prim-sec (km s−1) | −0.26(49) | −0.88(56) | −0.27(50)/−0.94(55) | −0.23(51)/−1.00(56) |
| CfA–Fairb (km s−1) | ⋯ | ⋯ | −0.61(53) | −0.56(54) |
| rmsA (km s−1) | 1.78 | 2.46 | 1.84/2.52 | 1.91/2.57 |
| rmsB (km s−1) | 1.69 | 2.71 | 1.68/2.71 | 1.70/2.72 |
| N(RV) | 32 | 49 | 32/49 | 32/49 |
| N(ecl) | 102 | 102 | 102 | 102 |
Note. The gamma velocities are on the reference system of the CfA velocities. "Prim-sec" is an offset between the primary and secondary velocities in each data set. "CfA–Fairb" is a zero point offset between the CfA and Fairborn velocities. TminI is a date of deeper minimum (primary eclipse) and Tperi is a date of periastron passage.
Download table as: ASCIITypeset image
Column 4 of Table 4 reports the results of a fit where we used the two RV data sets with the eclipse timings simultaneously. As before, the primary/secondary offsets are not very different from zero, and an additional free parameter included to account for a possible shift between the CfA and Fairborn zero points also came out very small.
The last column of Table 4 reports the results of our final adopted spectroscopic/ephemeris-curve fit, in which we further constrained the eccentricity using a largely independent (and formally more precise) estimate of e obtained from our light-curve analysis below. Specifically, we adopted the weighted average (e = 0.0473 ± 0.0026) between the eccentricity in column 4 of the table and the value of e = 0.0462 ± 0.0011 derived from the light curves, and held it fixed in the solution. Similarly, the inclination angle we used for all solutions in Table 4 (8440 ± 020) is the average resulting from light-curve fits in which the eccentricity was left unconstrained or held fixed at the value in column 4. To account for the uncertainties of the two parameters (e and i) that were not varied in our adopted fit of column 4, we performed 10,000 Monte Carlo simulations in which those two quantities were perturbed by drawing from appropriate Gaussian distributions, and were held fixed in refitting all elements. We then computed the scatter for all elements and all derived quantities from the 10,000 solutions. The uncertainties reported in the last column of Table 4 include contributions from the scatter of these simulations and the internal errors of the fits, added in quadrature.
The rate of apsidal motion from the adopted fit is  degree/day, corresponding to a relatively short apsidal period of 151.4 ± 8.4 years. A graphical representation of the CfA and Fairborn radial velocity measurements along with the computed velocity curves from the fit can be seen in Figure 1, with the
  residuals shown at the bottom. The velocities plotted here are the measured values after removal of the effect from apsidal motion calculated from the final fit. The residuals of the eclipse timings from a linear ephemeris (ephemeris deviation) and the corresponding ephemeris curve from our final model are shown in Figure 2.
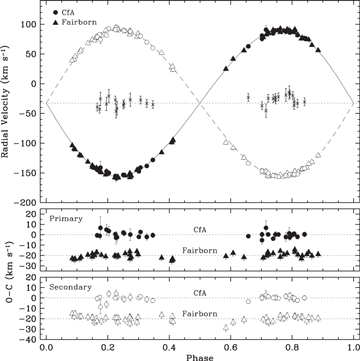
Figure 1. (Top) Radial-velocity curves from our adopted model along with our CfA and Fairborn measurements. Primary RVs are shown with filled symbols, secondary ones with open symbols, and tertiary ones with crosses. The dotted line represents the center-of-mass velocity of the system, and phase 0.0 corresponds to the (deeper) eclipse of the marginally hotter and more massive primary component (star A). (Bottom)  residuals, with the ones from Fairborn Observatory displaced vertically for clarity.
Download figure:
Standard image High-resolution image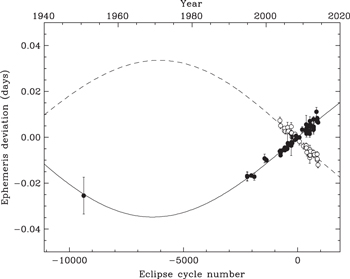
Figure 2. Ephemeris curve for IM Per from our adopted model, with the eclipse timings from Table 1. Primary timings are shown with filled symbols.
Download figure:
Standard image High-resolution image5. PHOTOMETRIC OBSERVATIONS AND ANALYSIS
V-band differential photometry was obtained by using the URSA WebScope at the University of Arkansas at Fayetteville from 2003 September 20 to 2012 March 1 (11,212 usable observations) and the NFO WebScope near Silver City, NM from 2005 January 18 to 2014 February 17 (17,013 usable observations). Descriptions of the telescopes are given by Lacy et al. (2014) and Grauer et al. (2008). Two comparison stars near the eclipsing binary were used: GSC 03323 01163 (mag 9.8) and GSC 03323 01366 (mag 9.9); both stars are closer than 8 arcmin from the variable star. 60 s exposures were taken at a cadence of about 105 s for the URSA WebScope and 123 s for the NFO WebScope. The sum of the fluxes of both of the two comparison stars was converted into a comparison star magnitude called "comps," and the differential magnitude ΔV = var-comps was formed from these magnitudes. The results are given in Tables 5 and 6, and an indication of the file format is given in Tables 5 and 6 below.
Table 5. Differential V magnitudes of IM Per from the URSA WebScope
| HJD 2,400,000 |
 (mag) (mag) |
|---|---|
| 52902.75327 | 1.889 |
| 52902.75518 | 1.891 |
| 52902.75709 | 1.876 |
| 52902.75896 | 1.888 |
| 52902.76085 | 1.881 |
Only a portion of this table is shown here to demonstrate its form and content. Machine-readable and Virtual Observatory (VOT) versions of the full table are available.
Download table as: Machine-readable (MRT)Virtual Observatory (VOT)Typeset image
Table 6. Differential V Magnitudes of IM Per from the NFO WebScope
| HJD 2,400,000 | ΔV (mag) |
|---|---|
| 53388.66577 | 2.239 |
| 53388.66714 | 2.250 |
| 53388.66855 | 2.260 |
| 53388.66996 | 2.252 |
| 53388.67142 | 2.267 |
Only a portion of this table is shown here to demonstrate its form and content. Machine-readable and Virtual Observatory (VOT) versions of the full table are available.
Download table as: Machine-readable (MRT)Virtual Observatory (VOT)Typeset image
The light curves were fitted by the Nelson–Davis–Etzel model by using the JKTEBOP program of Nelson & Davis (1972), Popper & Etzel (1981), and Southworth et al. (2004). This is a good light curve model for well-separated eclipsing binaries (North & Zahn 2004) such as IM Per, i.e., mean relative radii less than 0.25 and oblateness less than 0.04. Over the decade of photometric observations, significant apsidal motion of the phase of secondary eclipse was evident in the data. We have modified the JKTEBOP program to include the change of periastron angle due to apsidal motion as a parameter that could vary, allowing this motion to be fitted. Because of the particular orientation of the orbits at the current time (see Figure 2) several of the orbital parameters of the radial velocity curve, ephemeris curve, and light curve solutions are very highly correlated, so are difficult to pin down with only one of these curves. Therefore, average values were determined for parameters in common from the three different sources of information about the orbit. In particular, the eccentricity was fixed by averaging the values from the spectroscopic-ephemeris curve solution and the light-curve solution. Also, the light ratio LB/LA was poorly determined from the light curves alone, so the mean spectroscopic light ratio, as measured from the spectrograms, was used to fix this value and, of course, the mass ratio q was also fixed from the radial velocity solution. With these values fixed, the orbital inclination could be reliably determined as i = 8440, which was then fixed in the spectroscopic-ephemeris curve solution. After some iteration, the final results for the light curve parameters are given in Table 7. Parameter  is the ratio of radii, where rA and rB are the radii relative to the semi-major axis of the orbit, JB is the central surface brightness of the slightly smaller and cooler star, i is the orbital inclination, e is the orbital eccentricity, ω is the longitude of periastron, dω/dt is the rate of apsidal motion, uA = uB is the linear limb-darkening parameter (the stars have essentially the same temperature), the gravity darkening exponent was taken from theory for the temperature of the stars as 0.97 (Claret 1998), q is the spectroscopic mass ratio mB/mA, L3 is the flux due to the faint third component (also seen in the spectra), where LA+LB+L3 = 1, LA and LB being the normalized flux of the binary stars, σ is the residual standard deviation from the fit, and N is the number of observations being fitted. Adopted errors for the fitted parameters in Table 7 include both the internal error estimates of the fits and half the difference between the results for the two telescopes, both added in quadrature. The fitted model is shown in Figures 3–5.
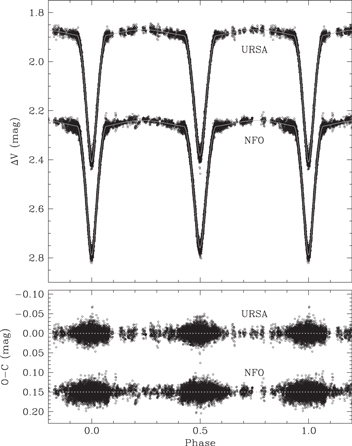
Figure 3. V-band differential light curves of IM Per and fitted models. The primary eclipse ephemeris is currently HJD Min I = 2,454,665.736068(85) + 2.25423576(26) E.
Download figure:
Standard image High-resolution image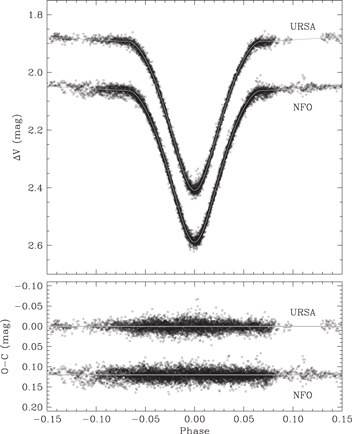
Figure 4. Deeper eclipse of IM Per and the fitted model.
Download figure:
Standard image High-resolution image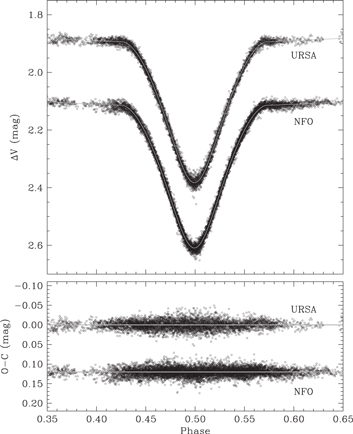
Figure 5. Shallower eclipse of IM Per and the fitted model.
Download figure:
Standard image High-resolution imageTable 7. Fitted Parameters of the Light Curves
| URSA | NFO | Adopted | |
| k | 0.981 | 0.982 | 0.982(12) |
| JB | 0.9969 | 0.9944 | 0.9951(32) |
| rA+rB | 0.4317 | 0.4325 | 0.4323(16) |
| rA | 0.2179 | 0.2182 | 0.2181(18) |
| rB | 0.2138 | 0.2143 | 0.2141(18) |
| i | 84.40 fix | 84.40 fix | 84.40(20) |
| e | 0.0473 fix | 0.0473 fix | 0.0473(26) |
| ω (degree) | 91.146 | 91.189 | 91.170(72) |
| dω/dt (degree/day) | 0.00684 | 0.00689 | 0.00687(36) |
| uA = uB | 0.633 | 0.642 | 0.639(39) |
| q | 0.9949 fix | 0.9949 fix | 0.9949(33) |
| L3 | 0.039 | 0.029 | 0.033(12) |
| LA | 0.4909 | 0.4958 | 0.4935(82) |
| LB | 0.4699 | 0.4745 | 0.4725(76) |
| LB/LA | 0.957 fix | 0.957 fix | 0.957(24) |
| σ (mmag) | 10.9136 | 10.6191 | |
| N | 11212 | 17013 | |
| P (days) | 2.25423576(26) | ||
| HJD Min I | 2,454,665.736068(85) | ||
Download table as: ASCIITypeset image
6. ABSOLUTE DIMENSIONS
Absolute masses and radii for IM Per were determined from our spectroscopic and photometric analyses with very high relative precisions of about 0.5% and 0.7%, respectively. No detailed chemical abundance analysis is available for the system. The central surface brightness parameter JB is very near unity and is an indication that the temperatures of the components are very similar. Adopting for the primary star our spectroscopic temperature estimate from Section 3 (7580 ± 150 K) and using the visual absolute flux calibration of Popper (1980), we find a temperature difference of only 10 ± 45 K, the secondary being very marginally cooler (7570  160 K). As is usually the case, the temperature difference is better determined than the absolute temperatures. These and other properties of the system are listed in Table 8. For the distance to the system we relied on the apparent brightness V = 11.111 ± 0.010 from the AAVSO Photometric All-Sky Survey (Henden et al. 2012), which is likely affected significantly by interstellar extinction due to the low Galactic latitude of IM Per (−49). Since extinction is difficult to estimate so near the Galactic plane, we proceeded as follows. We used the measured
  color index of 0.683 ± 0.014 from the same source above (assuming it corresponds to either star as they are so similar), along with the color/temperature calibration of Casagrande et al. (2010), and adjusted the reddening until the temperature from the calibration equaled our spectroscopic value of 7580 K. In this way we obtained
  = 0.49 ± 0.05, to which we assigned a conservative uncertainty. Visual extinction was then computed with
  , and the resulting distance is 566 ± 46 pc.
Table 8. Absolute Dimensions of IM Per
| Property | Primary | Secondary |
|---|---|---|
| Mass (MSun) | 1.7831(94) | 1.7741(97) |
| Radius (RSun) | 2.409(18) | 2.366(17) |
| Teff (K) | 7580(150) | 7570(160) |
 Teff prim-sec (K) Teff prim-sec (K) |
10(45) | |
| log g (cgs) | 3.9258(67) | 3.9394(68) |
| log L/LSun | 1.235(35) | 1.217(36) |
| F_Va | 3.8789(85) | 3.8784(88) |
| M_V (mag)a | 1.557(86) | 1.602(90) |
| Mbol (mag)b | 1.663(88) | 1.708(91) |
| m-M (mag)a | 8.76(18) | |
| Dist (pc)a | 566(46) | |
Measured  (km s−1) (km s−1) |
57.5(30) | 56.5(30) |
 ( ( ) (km s−1) ) (km s−1) |
53.8(4) | 52.8(4) |
 (peri) (km s−1) (peri) (km s−1) |
59.2(5) | 58.1(5) |
 (psync) (km s−1) (psync) (km s−1) |
54.5(4) | 53.5(4) |
aRelies on the visual absolute flux (FV) calibration of Popper (1980). bRelies on Mbol(Sun) = 4.732 and bolometric corrections from Flower (1996) (see Torres 2010).
Download table as: ASCIITypeset image
The average  values from the CfA and Fairborn measurements are 57.5 and 56.5 km s−1 for the primary and secondary, with estimated uncertainties of 3 km s−1. These are closest to the predicted values at periastron (see Table 8), but are also consistent with the expected velocities assuming pseudo-synchronous rotation (Hut 1981).
A weighted average of our two spectroscopic estimates of the relative brightness of the third star, from the DS and TRES spectra described earlier, is LC/LA = 0.025 ± 0.008 at 5187 Å. We re-normalized this for comparison with the L3 value from JKTEBOP, which is defined so that the sum of the fluxes of the three stars is unity, and obtained L3 = 0.013 ± 0.004. This is somewhat smaller than the photometric value of L3 = 0.033 ± 0.012 (Table 7), though only at the 1.6 sigma level.
7. COMPARISON WITH THEORY
With Roche lobe relative radii of 0.38 and measured relative radii of 0.22, the stars in IM Per are clearly well-detached, so can be compared with evolutionary models of single stars. Our accurate measurements for IM Per are shown against the stellar evolution models from the Yonsei-Yale series (Yi et al. 2001) in Figure 6. We find that a metallicity of [Fe/H] = −0.22 (corresponding to  in these models) provides an excellent match, and shows the stars to be slightly past the midpoint of their main-sequence evolution. An isochrone corresponding to the best-fit age of 1.2 Gyr is also shown. The agreement between theory and observation in this diagram illustrates the consistency between our mass ratio measurement (which determines the separation of the tracks in the horizontal direction) and the measured temperature difference (which sets the separation of the points in the horizontal direction).

Figure 6. Stellar evolution models from the Yonsei-Yale series for [Fe/H] = −0.22, compared against the measurements for IM Per. The two parallel solid lines surrounded by the shaded area are evolutionary tracks for the exact measured masses of the components. The shaded area represents the uncertainty in the location of the tracks that comes from the mass errors. The thick solid line is an isochrone for 1.2 Gyr that provides a good match to the observations. Dashed lines are isochrones for 1.0 Gyr (left) and 1.4 Gyr (right).
Download figure:
Standard image High-resolution image
Stellar evolution models by Claret (2004) predict a classical apsidal motion rate for IM Per from tidal and rotational distortions of dω/dt = 0.00666 ± 0.00017 degree/day. General Relativistic precession (see, e.g., Gimenez 1985) adds only a minor contribution (less than 5%) equal to 0.0003284 ± 0.0000008 degree/day. The total rate is 0.00699 ± 0.00017 degree/day, corresponding to an apsidal motion period of U = 141.0 ± 3.4 years. This value is consistent with our measurement of U in Table 4 within about  , indicating that the internal structure of the stars as predicted by the models is a good representation of their true structure. The presence of a third star in the system raises the possibility that the measured apsidal motion rate may be affected by it, but the good agreement just stated suggests that the effect is likely to be small.
8. CONCLUSIONS
In IM Per we find an eccentric eclipsing binary star caught at a time when the eclipse phases are changing at nearly their maximum rates, which complicates the analysis of the plentiful observational data. The system consists of a very similar pair of late A stars, plus a very faint third component, barely detectable with our data sets. The masses of 1.7831 and 1.7741 solar masses are known to 0.5% accuracy, and the radii of 2.409 and 2.366 solar radii are known to 0.7% accuracy, among the best known absolute masses and radii. The eclipsing stars are well-fit in theory, both in their external properties, but also in their internal mass distributions.
Thanks to Dr. A. William Neely for operation and maintenance of the NFO WebScope and for preliminary processing and distribution of the images. We thank P. Berlind, W. Brown, M. Calkins, G. Esquerdo, D. W. Latham, S. Quinn, R. P. Stefanik, and S. Tang for help with the spectroscopic observations of IM Per on Mount Hopkins, as well as R. J. Davis and J. Mink for maintaining the echelle databases at the CfA. G.T. acknowledges partial support through NSF grant AST-1007992. This research has made use of NASAʼs Astrophysics Data System Abstract Service, and of the SIMBAD and VizieR databases, operated at the CDS, Strasbourg, France. The research at Tennessee State University was made possible by NSF support through grant 1039522 of the Major Research Instrumentation Program. In addition, astronomy at Tennessee State University is supported by the state of Tennessee through its Centers of Excellence programs.