


ABSTRACT
We have completed an optical spectroscopic survey of a sample of candidate young stars in the Serpens Main star-forming region selected from deep B, V, and R band images. While infrared, X-ray, and optical surveys of the cloud have identified many young stellar objects (YSOs), these surveys have been biased toward particular stages of pre-main sequence evolution. We have obtained over 700 moderate resolution optical spectra that, when combined with published data, have led to the identification of 63 association members based on the presence of Hα in emission, lithium absorption, X-ray emission, a mid-infrared excess, and/or reflection nebulosity. Twelve YSOs are identified based on the presence of lithium absorption alone. An additional 16 objects are classified as possible association members and their pre-main sequence nature is in need of confirmation. Spectral types along with V and R band photometry were used to derive effective temperatures and bolometric luminosities for association members to compare with theoretical tracks and isochrones for pre-main sequence stars. An average age of 2 Myr is derived for this population. When compared to simulations, there is no obvious evidence for an age spread when considering the major sources of uncertainties in the derived luminosities. However when compared to the young cluster in Ophiuchus, the association members in Serpens appear to have a larger spread in luminosities and hence ages which could be intrinsic to the region or the result of a foreground population of YSOs associated with the Aquila Rift. Modeling of the spectral energy distributions from optical through mid-infrared wavelengths has revealed three new transition disk objects, making a total of six in the cluster. Echelle spectra for a subset of these sources enabled estimates of v sin i for seven association members. Analysis of gravity-sensitive lines in the echelle and moderate resolution spectra of the association members indicate surface gravities consistent with dwarf or sub-giant stars.
Export citation and abstract BibTeX RIS
1. INTRODUCTION
Young clusters provide a valuable test bed of star formation theories since large numbers of stars have formed out of the same molecular cloud under the same physical conditions. For example, the age distribution within a cluster can place limits on star formation time scales. To understand more clearly the star formation process, measurement of characteristics such as age distribution, mass function, and disk frequency are necessary. These characteristics can be most fully studied by unbiased spectroscopic surveys (Bastian et al. 2010). The Serpens Molecular cloud is an ideal region for studies of young clusters as it contains objects in all stages of evolution from protostars to pre-main sequence stars (see Eiroa et al. 2008 for review). The young stellar objects (YSOs) in Serpens have been observed at mid- and far-infrared wavelengths with the Spitzer Space Telescope (SST) as part of the c2d and Gould's Belt Surveys. About 235 objects were identified as YSOs due to infrared excesses in two main concentrations (Harvey et al. 2007; Winston et al. 2007, 2009). The best-studied concentration is the Serpens Main region which contains two dense cores hosting an infrared cluster centered on the embedded YSO SVS 20 along with numerous submillimeter sources (Eiroa & Casali 1992; Casali et al. 1993; Testi & Sargent 1998; Davis et al. 1999). X-ray studies have also been conducted of this region with XMM-Newton and Chandra (Preibisch 2003; Giardino et al. 2007; Winston et al. 2007, 2009). These surveys have targeted more evolved pre-main sequence stars with magnetic surface activity and trace a more distributed population surrounding the core of embedded infrared sources (Kaas et al. 2004). The second concentration, dubbed Serpens South, is located about 3° south of Serpens Main. While less well-studied, it is a cluster rich in protostars embedded in a dense filamentary cloud (Harvey et al. 2007; Gutermuth et al. 2008).
Estimates for the distance to the Serpens Main cloud have varied considerably over the years and they are complicated by its location toward the Aquila Rift (Dzib et al. 2010). Initial estimates of 440 pc were based on the spectroscopic parallax of the B star HD 170634 (BD+01 3694) which lies about 6' east of the dense molecular core and illuminates S 68 (Racine 1968; Strom et al. 1974). Later estimates using a Wolf diagram technique that measured extinction versus distance to background stars yielded distances of 200–260 pc (Straiz̆ys et al. 1996, 2003; Knude 2011). However most recently, Dzib et al. (2010, 2011) used the VLBA to measure parallaxes for both components of EC 95, a YSO binary system embedded in the Serpens Main molecular core. Their estimate of 429 ± 2 pc suggests that Wolf diagram techniques are encountering foreground clouds associated with the Aquila Rift. We adopt 429 pc as the distance to the Serpens Main cloud which is consistent with distance estimates to S 68. We note that the presence of foreground clouds raises the possibility that there could be YSOs in our sample foreground to the Serpens cloud for which we would be overestimating their luminosities and underestimating their ages.
The age distribution of a young cluster can in principle reveal details of the star formation process. Assuming observational errors are minimal, apparent age spreads in young clusters could be due to binarity, variability, episodic accretion, a large spread in distance to its members, or an extended period of star formation (e.g., Hartmann 2001; Jeffries 2012). In the latter case, a large age spread could imply that molecular clouds form stars in a quasi-static state with support, for example, from magnetic fields (Tassis & Mouschovias 2004). Alternatively, an age spread could be produced by individual stars forming over a short timescale due to large-scale flows but extended by cloud evolution (Hartmann et al. 2012). Based on modeling of the luminosity function of the Serpens Main cluster, Kaas et al. (2004) found that the ages of sources with class II spectral energy distributions were consistent with a coeval population of 2 Myr. More recently, Winston et al. (2009) determined the isochronal age distribution from spectroscopic observations of YSOs with class II and III spectral energy distributions identified through observations with the Chandra and Spitzer Space Observatories. Winston et al. observed an apparent age spread of 3–10 Myr, with YSOs with ages >3 Myr forming a more spatially extended population.
To gain a complete picture of the star-forming history of a region, all phases of pre-main-sequence (PMS) evolution must be studied. But due to the highly variable nature of X-ray emission, YSOs which have little or no circumstellar dust have been undersampled in the Serpens Main cluster. Optical spectroscopic surveys have been conducted of this region, however these studies have been biased toward objects with X-ray emission (Wilking et al. 2008) or toward stars with infrared excesses (Oliveira et al. 2009). Winston et al. (2009) studied sources with both IR-excess and X-ray emission, however due to the variability of X-ray emission their sample may be incomplete. We present the results of a new optical spectroscopic survey of 345 candidate YSOs over a 0.25 square degree region centered on Serpens Main which provides a representative sample of optically visible YSOs in the Serpens Main cloud not biassed by the presence of X-ray or IR-excess emission. Section 2 describes B, V, and R band imaging plus both intermediate and high resolution spectroscopic observations. Data reduction techniques including analysis of spectra to derive spectral types and surface gravities are also described. Section 3 discusses the results of our analysis including the identification of association members, their spatial distribution, and placement in a Hertzsprung–Russell (H–R) diagram relative to several theoretical models. We also derive the age distribution and disk frequency for the members as well as accretion and rotation rates for selected sources. Analysis of their spectral energy distributions from optical through mid-infrared wavelengths is described. Section 4 compares the Serpens cluster to our recent study of the Rho Ophiuchi molecular cloud core which was conducted in the same manner.
2. OBSERVATIONS AND DATA REDUCTION
Over 700 moderate resolution spectra were obtained for 345 stars selected from a (V–R) versus V versus color–magnitude diagram as candidate YSOs. Echelle spectra were obtained for 18 of these candidates. These observations and the data reduction are described in detail in the following sections.
2.1. B, V, and R Photometry and Sample Selection
B, V, and R band images were obtained on 2007 May 25 through light cirrus with the 90prime wide-field camera on the 2.3 m Bok Telescope (Williams et al. 2004). Using one of the four CCDs (selected to give the highest quality for photometry), the images covered a 30 7 × 307 area with a scale of 0
 45 pixel−1 centered on the Serpens Main cluster, R.A.(2000) = 18h 29m 56
 7, decl.(2000) = +01
 12'24''. In order to sample the brightest and faintest sources, four dithered exposures with integration times of 4 and 80 s were obtained plus several 0.2 s exposures. As 90prime is designed to provide highly uniform exposure times across the field of view, no shutter corrections were required. Each frame was dark subtracted and flat-fielded using twilight flats. Image distortion due to the wide field of view was corrected via re-sampling of the data using astrometric standards from the USNO survey.
Aperture photometry was performed using the phot task in IRAF.6
An aperture radius of r = 5 pixels (225) was used for the 4 and 80 s exposures that matched the full width at half maximum of the point-spread function (Howell 1989). Local sky background was measured in an annulus of radius 15–25 pixels. An aperture radius of r = 7 pixels (315) was used for the brightest stars in 0.2 s exposures to capture most of the point-spread function. Statistical errors were calculated in IRAF which assumes a Poisson detection model.
The primary photometric calibration was established from seven bright stars in the field (SCB 41, 43, 47, 60, 67, 70, 72; Straiz̆ys et al. 1996). Magnitudes were kindly provided by Richard D. Schwartz from observations in 2009 June and July at the Galaxy View Observatory in Sequim, WA. A number of Landolt standards in the Johnson-Cousins system covering a wide range of colors and airmasses were observed throughout the night to obtain coefficients for extinction, instrumental transformations, and zero points. Considering all sources of photometric errors, the B, V, and R magnitudes have 1% uncertainties. These seven sources were used to calibrate the brightest stars in the 0.2 s exposures (R < 9.6) and the 4 s exposure frames (R < 12.6). Considering calibration and statistical errors, minimum uncertainties in the B, V, and R band photometry were (0.03, 0.05, and 0.05 mag) at 0.2 s and (0.03, 0.04, and 0.01 mag) at 4 s. A group of bright, unsaturated sources with R = 12.6–16.0 mag were used as secondary standards in the 80 s images, yielding uncertainties dominated by those from the calibration (0.11, 0.07, and 0.03 mag). The final magnitudes were averages of those from the dithered images weighted by the statistical errors. Photometric uncertainties for sources fainter than B ∼ 21, V ∼ 20, R ∼ 18.5 mag are dominated by sky noise. Completeness limits at V and R of 20.25 and 18.75 mag, respectively, were estimated from the turnover in a plot of the number of stars versus magnitude.
2.2. Spectroscopy
Candidate YSOs were selected for spectroscopic observations from a V versus ( ) color–magnitude diagram (Figure 1). Targets were located on or above the ZAMS with V magnitudes brighter than 20.0. The sample includes objects with masses ≥0.5
  and AV < 3.4 mag assuming an age of 2 Myr using the D'Antona & Mazzitelli (1997, hereafter DM) models. Optical spectra were obtained using several instruments; Hydra, Hectospec, a Boller and Chivens (B&C) spectrograph, and the Magellan Inamori Kyocera Echelle (MIKE) spectrograph, on the WIYN, MMT, Bok, and Magellan Clay telescopes, respectively. For multi-fiber instruments (Hydra and Hectospec), fiber configurations were designed to observe the maximum number of candidate YSOs; crowding at the edges of our field restricted the number of sources that could be observed. Observing parameters are detailed in Table 1. For all spectral observations, scattered light corrections were not made and no flux calibration was performed. All spectral images were bias and dark corrected using the ccdproc routine in IRAF unless otherwise specified. The typical signal-to-noise ratio (S/N) was 20–100 as measured by line-free regions of the continuum.

Figure 1. V vs. ( ) color–magnitude diagram from our V- and R-band images. The roughly horizontal black line shows our completeness limit. Objects observed spectroscopically are shown by triangles (association members), "x's" (possible association members), open squares (giants), or diamonds (unclassified). Black dots represent sources that were not observed spectroscopically. The ZAMS and isochrones for 1 Myr (dotted–dashed, red) and 5 Myr (dashed, blue) were derived from the DM models, using colors and bolometric corrections from Kenyon & Hartmann (1995) given the effective temperature, bolometric luminosity, and distance modulus.
Download figure:
Standard image High-resolution imageTable 1. Spectroscopic Observation Details
| Start Date | Telescope | Spectrograph | Grating | Slit/fiber width | λ range | λ cent. | Disp. | Res.b | Int. time |
|---|---|---|---|---|---|---|---|---|---|
| (YYYYMMDD) | (gpmm)a | (arcsec) | (Å) | (Å) | (Å pix−1) | (Å) | (minutes) | ||
| 2006 Jun 16 | WIYN 3.5 m | Hydra | 1200 | 2.0 | 6249–7657 | 6960 | 0.68 | 1.4 | 120 |
| 2008 Jun 28 | Bok 2.3 m | B&C | 1200 | 1.5 | 5954–7115 | 6535 | 0.99 | 1.2 | 5–25 |
| 2008 Sep 16 | Bok 2.3 m | B&C | 400 | 1.5 | 3850–5566 | 4700 | 1.43 | 2.3 | 5–15 |
| 2009 Jun 27 | WIYN 3.5 m | Hydra | 600 | 3.0 | 3966–5386 | 4684 | 0.70 | 1.4 | 34–155 |
| ... | ... | ... | 1200 | 2.0 | 6300–7669 | 6990 | 0.69 | 1.4 | 70-90 |
| 2010 Jun 29 | WIYN 3.5 m | Hydra | 600 | 3.0 | 3900–5315 | 4591 | 0.70 | 1.4 | 30–110 |
| ... | ... | ... | 1200 | 2.0 | 6286–7662 | 6961 | 0.69 | 1.4 | 39–245 |
| 2010 Jul 03 | MMT 6.5 m | Hectospec | 600 | 1.5 | 5462–8070 | 6775 | 0.57 | 1.2 | 45 |
| 2011 Sep 19 | MMT 6.5 m | Hectospec | 270 | 1.5 | 3703–9146c | 6425 | 1.20 | 2.4 | 24 |
| 2009 Jun 13 | Magellan Clay 6.5 m | MIKE | 52.7 | 0.7 | 3360–4991 | 4175 | 0.02 | 0.11 | 25-30 |
| ... | ... | ... | 52.6 | 0.7 | 4830–8928 | 7200 | 0.05 | 0.24 | 25–30 |
| 2009 Aug 10 | Magellan Clay 6.5 m | MIKE | 52.7 | 0.7 | 3360–4991 | 4175 | 0.02 | 0.11 | 10–24 |
| ... | ... | ... | 52.6 | 0.7 | 4830–8928 | 7200 | 0.05 | 0.24 | 10–24 |
| 2010 Jul 09 | Magellan Clay 6.5 m | MIKE | 52.7 | 0.7 | 3360–4991 | 4175 | 0.02 | 0.11 | 3–75 |
| ... | ... | ... | 52.6 | 0.7 | 4830–8928 | 7200 | 0.05 | 0.24 | 3–75 |
aGroves per millimeter. bSpectral resolution at central wavelength. cFor spectral classification, only the wavelengths from 5650–9100 Å were used.
Download table as: ASCIITypeset image
In 2008 June and September, the brightest objects in our sample were observed on the Bok 2.3 m telescope using the B&C spectrograph. In June, objects were observed at red wavelengths (5954–7115 Å) in first order. In September, objects were observed at blue wavelengths (3850–5566 Å) in second order with a copper sulfate filter used to block first order light. All spectra taken on the Bok telescope were extracted using the apall routine in IRAF. This routine also performs sky subtraction of the data. Dome flats were used to correct for pixel-to-pixel variations in responsivity of the CCD. A HeArNe lamp was used to wavelength calibrate the data.
Spectra were obtained on the WIYN7 3.5 m telescope using Hydra in 2006, 2009, and 2010. Spectra were extracted with IRAF's dohydra package using dome flats obtained for each fiber configuration. Sky spectra were taken by placing fibers on random positions distributed across each field. Sky subtraction was accomplished using the median of 10–15 sky spectra. A CuAr lamp was used for wavelength calibration.
In 2010 July and 2011 September, objects were observed on the MMT 6.5 m telescope using Hectospec. Spectra observed in 2010 were reduced using E-SPECROAD created by Juan Cabanela. Dome flats were acquired for flat-field corrections. The E-SPECROAD pipeline extracts spectra, applies bias, dark, and flat-field corrections and performs the wavelength calibration. Sky subtraction was achieved using sky spectra taken by offsetting the telescope. For spectra where this was unsuccessful, sky spectra taken by placing fibers on random positions distributed across each field were used. Spectra obtained in 2011 were reduced at the SAO Telescope Data Center using the SPECROAD pipeline, supported by the Smithsonian Astrophysical Observatory (Fabricant et al. 2005; Mink et al. 2007). Spectra in 2011 were corrected to remove atmospheric water vapor absorption bands at 6870–6955 Å and 7680–7730 Å. All the spectra were wavelength calibrated using exposures from a HeNeAr lamp.
A subset of the brighter YSO candidates were observed in single object mode using the red and blue paths of MIKE on the Magellan Clay 6.5 m telescope yielding 33 and 32 orders, respectively. All data taken with MIKE were reduced using the IRAF mtools package created by Jack Baldwin, along with standard IRAF routines. mtools extracts "tilted" spectra, performs sky subtraction, and removes cosmic rays. Dome flats were used to correct for pixel-to-pixel variations in responsivity of the CCD. These spectra were wavelength calibrated using exposures of a ThAr lamp.
2.3. Spectral Classification
Spectral classifications were derived for each spectrum. Table 2 presents the results using the moderate resolution spectra from the B&C, Hydra, and Hectospec spectrographs. As shown in the last column of Table 2, many sources were observed multiple times in blue and red wavelength bands. When spectral classifications for a given source did not agree between observations, all spectra were compared and a final spectral type and range determined with the highest weight given to spectra with the highest S/N. In general, there was very good agreement in spectral classifications between observations. Errors in spectral types are typically ±2 subclasses, including uncertainties due to the range of spectral types and use of dwarf surface gravities (see Section 3.4 for more details). More accurate spectral classifications were possible for M stars using the TiO bands resulting in uncertainties of ±1 subclass or better. Table 3 presents the results from the echelle spectra obtained with MIKE. The spectral typing procedures are described below.
Table 2. Optical Properties of Candidate Young Stellar Objects with Moderate Resolution Spectra
| Namea | Yrs. obs.b & Tel.c | R.A.(J2000) | Decl.(J2000) | Sp. Ty. | Adopt | Li?d | EW(Hα) | V | ( ) ) |
( ) ) |
No. Obs.e |
|---|---|---|---|---|---|---|---|---|---|---|---|
| (hhmmss.s) | ( ' '' ) ' '' ) |
Range | Sp. Ty. | (Å) | (mag) | (mag) | (mag) | ||||
| Photometric Standards | |||||||||||
| SCB 41 | 08 B,09 W,10W | 18:28:58.4 | 01:10:59.7 | A9-F2 | F1 | no | 5.5 | 11.16 | 0.81 | 0.50 | 3 B, 3R |
| SCB 43 | 08 B,09 W,10W | 18:29:08.0 | 01:05:25.4 | F5-F9 | F6 | no | 2.8 | 11.62 | 0.79 | 0.45 | 3 B, 3R |
| BD+01 3686/SCB 47 | 08 B,09 W,10W | 18:29:27.6 | 01:12:56.8 | F2-F6 | F4 | no | 4.0 | 11.03 | 0.68 | 0.39 | 3 B, 3R |
| BD+1 3693/SCB 60 | 08 B,09 W,10W | 18:30:10.4 | 01:19:33.7 | A5-A8 | A7 | poss | 8.0 | 10.53 | 0.53 | 0.33 | 3 B, 3R |
| SCB 67 | 08 B,09 W,10W | 18:30:35.0 | 01:20:21.9 | A9-F2 | F0 | no | 4.8 | 12.19 | 0.74 | 0.44 | 1 B, 3R |
| SCB 70 | 08 B,09 W,10W | 18:30:54.5 | 01:12:52.7 | F3-F6 | F4.5 | no | 3.7 | 11.99 | 0.86 | 0.52 | 2 B, 4R |
| SCB 72 | 08 B,09 W,10W | 18:30:56.2 | 01:14:15.8 | F6-F8 | F7 | no | 3.0 | 12.45 | 0.88 | 0.54 | 2 B, 3R |
| Candidate YSOs | |||||||||||
| ... | 09 W,10W | 18:28:55.5 | 01:12:18.4 | K1-K3 | K2 | no | 1.0 | 14.26 | 1.16 | 0.70 | 1 B, 2R |
| ... | 10 W,11M | 18:28:55.6 | 01:27:03.5 | G5-K0 | G7 | no | 1.9 | 17.93 | 1.79 | 1.11 | 2R |
| ... | 11M | 18:28:56.0 | 01:10:34.0 | K0-K2 | K1 | no | 1.3 | 19.26 | 2.43 | 1.99 | 1R |
| ... | 11M | 18:28:56.1 | 01:19:53.7 | G5-K0 | G9 | no | 1.5 | 19.61 | 1.68 | 1.37 | 1R |
| SCB 40 | 08 B,09 W,10W | 18:28:56.2 | 01:06:27.6 | F7-G0 | F9 | yes | 2.6 | 11.32 | 0.89 | 0.48 | 2 B, 2R |
| ... | 09 W,10 W,11M | 18:28:56.3 | 01:20:41.3 | A3-A6 | A5 | no | 5.2 | 16.30 | 1.57 | 1.02 | 1 B, 3R |
Notes.
aSources names from X-ray, optical, or infrared studies by: (SCB) Straiz̆ys et al. (1996), (XMM) XMM-Newton survey by Preibisch (2003), (WMW) Spitzer survey by Winston et al. (2007), (CDF88) reflection nebulae study by Chavarria-K. et al. (1988), (GFM) Chandra survey by Giardino et al. (2007), (EC) Eiroa & Casali (1992), (SVS) Strom et al. (1976), (KOB) ISO survey by Kaas et al. (2004), 2MASS.
bYears that sources were observed: 2006, 2008–2011.
cTelescopes used for observation: M for the MMT, W for the WIYN telescope, and B for the Bok telescope.
d"poss" stands for possibly.
eSpectral region observed and number of observations in each wavelength range: B stands for blue and R for red (see text for exact wavelength range for each telescope/set of observations).
fSource has a known companion, not resolved in our photometry.
gSpectral types from Winston et al. (2009) and Oliveira et al. (2009).
hPhotometry from 2MASS: J replaces V and ( ) replaces (
 ).
).
Only a portion of this table is shown here to demonstrate its form and content. Machine-readable and Virtual Observatory (VO) versions of the full table are available.
Download table as: Machine-readable (MRT)Virtual Observatory (VOT)Typeset image
Table 3. Optical Properties of Candidate Young Stellar Objects with Echelle Spectra
| Objecta | R.A.(2000) | Decl.(2000) | Date | Sp. Ty. Range | Sp. Ty.b | Surface | v sini c | YSO?d |
|---|---|---|---|---|---|---|---|---|
| (hh mm ss.s) | ( ''') ''') |
(YYMMDD) | Gravity | (km s ) ) |
||||
| SCB 40 | 18:28:56.2 | 01:06:27.6 | 2009 Aug 11 | F7-G0 | G0 | V-IV | 16 ± 2—25 ± 2 | ... |
| SCB 41 | 18:28:58.4 | 01:10:59.7 | 2009 Aug 11 | A9-F2 | F4 | ⋯ | 34 ± 8 | ... |
| SCB 43 | 18:29:08.0 | 01:05:25.4 | 2009 Aug 11 | F6-F9 | F7 | V-III | ⋯ | ... |
| WMW 124 | 18:29:08.2 | 01:05:43.1 | 2009 Jun 09 | A1-A3 | A1 | V-III | 40 ± 12 | IRX, TD |
| ... | ... | ... | 2010 Jul 10 | ... | ... | ... | ... | ... |
| BD+01 3686 | 18:29:27.6 | 01:12:56.8 | 2009 Aug 11 | F2-F6 | F6 | V-III | 24 ± 4 | X |
| BD+01 3687 | 18:29:31.7 | 01:08:19.1 | 2009 Jun 09 | F3-F9 | F6 | V-IV | 16 ± 3 | ref. neb. |
| ... | ... | ... | 2010 Jul 10 | ... | ... | ... | ... | ... |
| WMW 82/KOB 173 | 18:29:33.4 | 01:08:22.8 | 2009 Jun 09 | A3-A4 | A3.5 | V | ⋯ | IRX, ref. neb. |
![$[CDF88]\;7$](https://content.cld.iop.org/journals/1538-3881/149/3/103/revision1/aj508881ieqn12.gif) /XMM /XMM |
18:29:56.1 | 01:00:21.7 | 2010 Jul 10 | B3-B6 | B6 | III | ⋯ | X, ref |
| WMW 193/BD+01 3689B | 18:29:57.5 | 01:10:46.4 | 2010 Jul 10 | A1-A8 | A5 | V-III | 140 ± 16 | X |
| WMW 192/HD 170545 | 18:29:57.6 | 01:10:52.9 | 2010 Jul 10 | A1-A3 | A2.5 | V | 31 ± 4 | X |
| ... | 18:30:07.4 | 01:01:01.5 | 2009 Aug 11 | G6-K2 | G9 | IV | ⋯ | ... |
| KOB 370 | 18:30:08.7 | 00:58:46.5 | 2010 Jul 11 | G9-K4 | K1 | IV | ⋯ | Li,Hα,IRXe |
| BD+1 3693 | 18:30:10.4 | 01:19:33.7 | 2009 Aug 11 | A5-A8 | A7 | III | ⋯ | ... |
| WMW 220 | 18:30:24.5 | 01:19:50.7 | 2009 Aug 11 | K0-K2 | K1 | ⋯ | 14 ± 1 | X |
| HD 170634 | 18:30:24.9 | 01:13:23.0 | 2010 Jul 10 | B6-B9 | B9 | III | ⋯ | ref. neb. |
| XMM | 18:30:37.4 | 01:17:58.3 | 2010 Jul11 | F8-K5 | K0 | V-IV | 41 ± 3 | X |
| ... | 18:30:42.3 | 00:58:48.9 | 2010 Jul 11 | F4-F6 | F5 | III | 42 ± 3 | ... |
| SCB 70 | 18:30:54.5 | 01:12:52.7 | 2009 Aug 11 | F4-F7 | F7 | V-IV | 16 ± 2—24 ± 2 |
aSource names from X-ray, optical or infrared studies by: (SCB) Straiz̆ys et al. (1996), (XMM) XMM-Newton survey by Preibisch (2003), (WMW) Spitzer survey by Winston et al. (2007), (CDF88) reflection nebulae survey by Chavarria-K. et al. (1988) , (KOB) ISO survey by Kaas et al. (2004). bSpectral types derived from Magellan spectra only; See Table 4 for adopted spectral type. cIn most cases, the value of v sin i was not sensitive to surface gravity and is represented by a single value. A range is given only for SCB 40 and SCB 70. When the surface gravity was indeterminate, a dwarf surface gravity was assumed. Errors are the standard deviation of the mean. dYSO criteria include an infrared excess (IRX) including transition disk objects (TD), X-ray emission (X), association with reflection nebulosity (ref. neb.), Hα emission with EW >10 Å (Hα), or lithium absorption (Li). eHα emission is variable and not detected in the echelle spectrum.
Download table as: ASCIITypeset image
2.3.1. Moderate Resolution Spectra
Spectral types were first derived from visual pattern matching of absorption features in our program star spectra with those of dwarf standard stars. In order to match spectral features between standard stars and target objects, all of our spectra were smoothed using a Gaussian filter to the resolution of the standard stars. Normalized spectra were smoothed to a resolution of 5.7, 4.5, or 3 Å for comparison with spectral standards of Allen & Strom (1995), Jacoby et al. (1984), or LeBorgne et al. (2003), respectively. Spectra at red wavelengths were pattern matched using the Na i doublet at 5893 Å, Ca i at 6122 Å and 6162 Å for G, K, and M stars, as well as the TiO bands for stars later than K5 (Torres-Dodgen & Weaver 1993). For stars with no indicator of youth, the relative depth of Hα to the blend of Ba ii, Fe i, and Ca i at 6497 Å was also used. Spectra at blue wavelengths were pattern matched using the Ca ii H and K lines at 3969 Å and 3934 Å, the Ca i line at 4226 Å, and the Fe i line at 4271 Å. For stars cooler than F5, the G-band around 4300 Å was used and for stars cooler than K5, the Mg i b band around 5200 Å and MgH band around 4750 Å were also employed (Gray & Corbally 2009).
As a check, classifications were also made using the program SPTCLASS written by (Hernandez et al. 2005). The program was written to determine spectral classifications for stars from B2 to M9.5 using numerous spectral features and is optimized for spectra obtained with Hectospec with the 270 g mm−1 grating. As our 2011 data were the only data with this observing setup, it is the only set of data confirmed using this program. The SPTCLASS spectral types agreed with our visual classifications within 2 subclasses for late type stars.
A rough estimate of the surface gravity of an object is important in distinguishing PMS stars from background giants or field dwarfs. The primary gravity-sensitive absorption feature available for analysis for stars later than K5 was the CaH band centered at 6975 Å. Using the unsmoothed, normalized spectrum for each object, a CaH index was calculated as the ratio of the continuum at 7035 ± 15 Å to the flux in the CaH absorption band at 6975 ± 15 Å and a TiO index as the ratio of the continuum at 7030 ± 15 Å to the flux in the TiO absorption band at 7140 ± 15 Å. For objects with multiple observations, average indices weighted by the noise were computed. These indices were then plotted against each other and compared to the loci defined by dwarf and giant stars (e.g., Allen 1996). In the Hectospec spectra, the strength of the sodium doublet at 5893 Å, the Ca ii triplet at 8660 Å, and the sodium doublet at 8183 and 8195 Å (2011 only) were also used to identify giants via visual comparison with standard stars (Torres-Dodgen & Weaver 1993).
2.3.2. Echelle Spectra
Spectral classifications for data taken with MIKE were accomplished using visual comparisons with standard stars retrieved from the ELODIE archive at Observatoire de Haute-Provence with similar spectral resolution to our data (Moultaka et al. 2004). For all spectral types, initial classifications were made employing hydrogen lines from Hα to Hγ along with Ba ii, Ti i, Fe i, and Ca i around 6497 Å (which are not blended at this resolution). For B stars, He i lines at 4143 and 4417 Å, as well as the Ca ii line at 4267 Å, were employed. For A stars and later, Ca i at 4226.7 Å was also available. For F and G type stars, Fe i lines at 4383.5, 4325.7, and 4045.8 Å were used as additional criteria. Spectral types are given in columns 5 and 6 of Table 3 and agreed with those from our moderate resolution spectra within 2 subclasses.
The echelle spectra are well-suited to estimate surface gravity due to a number of available gravity-sensitive lines (Ginestet et al. 1994; Gray & Corbally 2009). The procedure for estimating log g was as follows. Equivalent widths of various lines depending on spectral type were measured and plotted versus temperature using synthetic spectra from the POLLUX database8 (Palacios et al. 2010) with log g values of 4.5, 4.0, 3.5, 3.0 and 2.0. In order to obtain a full range of temperatures and surface gravities, synthetic spectra were created using both ATLAS (Coelho et al. 2005) and MARCS (Gustafsson et al. 2008) model atmospheres. For sources with spectral types between B6 and A7, equivalent widths of Hα, Hβ, Hγ, and Hδ were used (Palacios et al. 2010). These lines may be somewhat filled in with emission, so the values presented for sources in this spectral range were viewed as lower limits. For sources with spectral types A1-K1, Figures 6, 7, 10–12, and 14 from Ginestet et al. (1994) were recreated with our data plotted. The range of values for log g was then determined, and matched to luminosity classes V, IV, and/or III. It is important to note that for stars hotter than about F5, there is little variation in temperature versus log g between dwarfs, giants, and sub-dwarfs.
Using our echelle spectra, esimates for v sin i were made by convolving the synthetic spectrum of a standard to match the line widths observed in our spectra. Our main assumptions were that the rotational broadening kernel was Gaussian, rotation was the dominant source of line broadening, and that this was significantly larger than the source of broadening in the synthetic spectra. Synthetic spectra were taken from the POLLUX database (Palacios et al. 2010) which assumed microturbulent broadening of 1–2 km s−1. Synthetic spectra selected to match the spectral types and surface gravities of our objects were convolved using the Gauss package in IRAF. v sin i for each object was derived from the average of the individual v sin i values measured from the widths of the convolving gaussians needed to match the full width at half maximum for ∼10 metal lines distributed over the entire spectrum. In most cases, the value of v sin i for a given object did not vary significantly with surface gravity; the average values are presented in Table 3 except for SCB 40 and SCB 70 for which a range is given. To check the validity of our technique, we selected six stars with high S/N spectra in the ELODIE database with published values of v sin i: HD 187642 (α Aquili, A7V), HD 58946 (F0V), HD 70958 (F3V), HD 111456 (F6V), HD 176303 (F8V), and HIP 106231 (K3V) (Glebocki & Gnacinski 2005; White et al. 2007; Schroeder et al. 2009; Lopez-Santiago et al. 2010). With our method, we were able to reproduce the published values for v sin i to within 10%.
3. RESULTS
Optical spectra have been obtained for 86% of the stars in the V versus ( ) diagram (Figure 1) that fell above V = 18.5 mag and (
 ) = 1.8. This corresponds to M ≥ 0.6
  and AV < 4 mag.
3.1. Spectral Classifications and Surface Gravities
Spectral types were determined for 335 of 345 stars; seven of these were adopted from the literature. These data are presented in Table 2 along with previous source names, R.A. and decl. in J2000, some observing details, V magnitudes, and the ( ) and (
 ) color indices. For 6 sources with optical spectral types, (
 ) color indices were not available, so (
 ) values from 2MASS are listed. The presence of lithium absorption at 6707 Å and the equivalent width of Hα are also indicated (emission shown as a negative value). Lithium absorption in early-type stars is likely always present but not always obvious due to the strength of the continuum. Based on surface gravity indicators (see Section 2.3.1), twelve background giants have been identified. The possible range of surface gravities was estimated for objects with echelle spectra and are listed in column 7 of Table 3. The majority are consistent with dwarf or subgiant surface gravities, although as alluded to earlier, log g values do not vary greatly with luminosity class for stars hotter than F5 which dominate this sample.
Two sources are of particular interest: KOB 370 and J183037.5+0117581. KOB 370 is a known double with both sources reported to have Hα in emission (Kaas et al. 2004). The sources are not spatially resolved in our moderate resolution spectra and show Hα in emission with the EW(Hα) varying from −2.4 to −9.4 Å. However our MIKE spectrum of the visually brighter component does not show Hα in emission. This could be due to accretion variability. The X-ray source J183037.5+0117581 has hydrogen lines that do not match any of the standard stars. The echelle spectrum shows that hydrogen absorption lines and the Ca ii triplet are filled in with emission, making the spectral type for this source more uncertain. Accounting for this fact, we revised the spectral classification derived from moderate resolution spectra from K5 to K0.
Thirty of our sources had optical or infrared spectral types previously published by Winston et al. (2009) and Oliveira et al. (2009). Our spectral classifications agree well with those previously published with two exceptions; WMW 124 and WMW 220. Winston et al. (2009) report spectral types of K6.5 and A3, respectively. Strong H absorption lines with broad wings in the blue and red, the absence of He i at 4387 Å, a weak blend of Ba ii, Ti, Fe i, and Ca i at 6497 Å, and the lack of TiO bands led to our classification of A2 for WMW 124. For WMW 220, the strength of Ca i at 4226 Å and Fe i at 4383 Å relative to the G band at 4300 Å, the absence of the MgH bands, and the strength of the Mg i triplet at 5167, 5172, and 5183 Å led to our K1 classification.
3.2. Association Membership
Association members identified by this study are listed in Table 4. Fifteen new PMS objects were identified using the same criteria of Erickson et al. (2011) with one exception; proper motions were unknown and not used as a criterion. These criteria include Hα in emission with EW >10 Å during at least one observation, X-ray emission, the presence of lithium absorption for stars with spectral type K0 and cooler, a mid-infrared excess, or associated reflection nebulosity. Sources were required to meet at least one of these criteria to be considered association members; those meeting more criteria are more firmly established. Six sources do not show obvious Li absorption in their spectra; two are early A stars for which Li absorption would be weak relative to a strong continuum. The remaining four sources have S/N ratios of less than 10. We have also noted objects which are too luminous to be main sequence objects at the distance to Serpens, were not identified as giants, and had an estimate for AV too high to be foreground to the cloud (AV > 3.5 mag). Sources that met this criterion are noted by "ext" in the last column of Table 4 but were not identified as association members by this criterion alone.9 Fifty-six objects with optical spectral types are identified as association members. Spectral types for an additional seven YSOs with V and R band data were taken from the literature giving a total of 63 association members. Eighty percent of the YSOs in our sample have K or M spectral types, with the majority of these K stars due to the magnitude limit of our survey. A plot of the CaH index for the association members and giants with spectral types of K5 or cooler is shown in Figure 2. Most of the association members fall along the dwarf standard locus and justifies our use of dwarf standards for classification and dwarf colors for dereddening.

Figure 2. Plot of CaH vs. TiO indices as defined in the text for 32 association members (triangles) and 10 background giants (squares) with spectral types K5 and cooler. The solid lines were derived from fits to dwarf and giant spectral standards. Error bars are based on statistical errors in each band pass, and do not account for systematic errors in normalization. For the dwarf standards from K5-M7, the fit was y = 0.126x + 0.940 with a correlation coefficient of r = 0.94. For the giant standards from K5-M5, the fit gave y = −0.0357x2 + 0.191x + 0.795 with a correlation coefficient of r = 0.82.
Download figure:
Standard image High-resolution imageTable 4. Association Members
| Namea | R.A.(J2000) | Decl.(J2000) | Sp. Ty. |

|

|
log(L/L
 ) ) |
 log(L/L log(L/L
 ) ) |
logT(K) |
 , ,  logT(K) logT(K) |
Massb | log age | Criteriac |
|---|---|---|---|---|---|---|---|---|---|---|---|---|
| (hhmmss.s) | ( ' '' ) ' '' ) |
Adopt | (mag) | (mag) | ( ) ) |
(yr) | ||||||
| 18:28:57.3 | 01:13:03.0 | K1 | 7.4 | 4.32 | 0.33 | 0.31 | 3.71 | 0.02,0.08 | 1.5 | 6.55 | Li/ext | |
| XMM | 18:29:04.5 | 01:09:47.0 | <K6 | >1.6e | <8.9e | >−1.7 | ... | >3.62 | ... | ... | ... | X |
| WMW 124 | 18:29:08.2 | 01:05:43.1 | A2 | 3.8 | 1.49 | 1.40 | 0.17 | 3.95 | 0.01,0.02 | 2.3 | 6.75 | TD |
| 18:29:14.4 | 01:27:33.8 | K4 | 6.4 | 4.85 | 0.17 | 0.18 | 3.66 | 0.02,0.03 | 0.77 | 5.98 | Li/ext | |
| 18:29:16.0 | 01:08:56.2 | K3 | 6.6 | 4.66 | 0.23 | 0.32 | 3.68 | 0.05,0.04 | 1.1 | 6.23 | Li/ext | |
| WMW 104 | 18:29:20.4 | 01:21:03.8 | M0.5d | 6.3 | 5.67 | 0.14 | 0.15 | 3.57 | 0.02,0.03 | 0.28 | < 5 | IRX/ext |
| XMM | 18:29:20.5 | 01:08:55.1 | K5 | 2.6 | 5.62 | −0.09 | 0.20 | 3.64 | 0.03,0.02 | 0.71 | 6.21 | Li/X |
| WMW 221/XMM | 18:29:22.7 | 01:10:33.0 | K6 | 3.0 | 5.71 | −0.09 | 0.18 | 3.62 | 0.02,0.03 | 0.56 | 5.99 | Li/X |
| BD+01 3686 | 18:29:27.6 | 01:12:56.8 | F4 | 0.83 | 2.04 | 1.11 | 0.10 | 3.82 | 0.02,0.02 | 2.0 | 6.75 | X |
| XMM | 18:29:31.2 | 01:05:51.6 | M3 | 3.0 | 7.67 | −0.37 | 0.16 | 3.53 | 0.01,0.01 | 0.22 | 5.63 | Li/X |
| BD+01 3687 | 18:29:31.7 | 01:08:19.1 | F6 | 0.39 | 2.73 | 0.85 | 0.12 | 3.80 | 0.03,0.02 | 1.7 | 6.89 | ref. neb. |
| WMW 225/XMM | 18:29:33.1 | 01:17:16.5 | K0 | 5.0 | 3.38 | 0.69 | 0.30 | 3.72 | 0.05,0.08 | 2.0 | 6.25 | Li/X/ext |
| WMW 82/KOB 173 | 18:29:33.4 | 01:08:22.8 | A3 | 2.3 | 1.41 | 1.41 | 0.10 | 3.93 | 0.01,0.04 | 2.3 | 6.71 | IRX/ref. neb. |
| XMM | 18:29:33.6 | 01:07:00.0 | M3.5 | 1.7 | 7.90 | −0.35 | 0.45 | 3.51 | 0.03,0.02 | 0.17 | 5.00 | X |
| XMM | 18:29:34.5 | 01:06:06.9 | U | ... | ... | ... | ... | ... | ... | ... | ... | X |
| XMM | 18:29:34.7 | 01:05:28.9 | K8 | 2.8 | 5.79 | 0.01 | 0.17 | 3.59 | 0.02,0.01 | 0.38 | 5.62 | X |
| 18:29:34.9 | 01:08:46.2 | K6 | 0.85 | 5.84 | −0.14 | 0.18 | 3.62 | 0.02,0.03 | 0.59 | 6.09 | Li | |
| WMW 94/XMM | 18:29:39.9 | 01:17:56.0 | M0.5 | 7.7e | 4.18e | −0.43 | 0.08 | 3.57 | 0.01,0.01 | 0.42 | 6.14 | Li/Hα/X/IRX/ext |
| WMW 103/XMM | 18:29:41.5 | 01:07:37.9 | K5 | 3.3 | 5.50 | −0.05 | 0.20 | 3.64 | 0.03,0.02 | 0.69 | 6.14 | Li/Hα/X/IRX |
| 18:29:43.0 | 01:02:06.8 | M0 | 4.1 | 6.66 | −0.29 | 0.22 | 3.58 | 0.02,0.01 | 0.42 | 5.97 | Li/ext | |
| WMW 65/KOB 219 | 18:29:43.9 | 01:07:21.0 | K7d | 4.8 | 7.10 | −0.56 | 0.16 | 3.60 | 0.03,0.02 | 0.69 | 6.74 | ext/IRX |
| WMW 100/XMM | 18:29:44.5 | 01:13:11.6 | M4.5d | 1.8 | 9.17 | −0.60 | 0.16 | 3.49 | 0.04,0.04 | 0.14 | 5.23 | X/IRX |
| WMW 79 | 18:29:46.3 | 01:10:25.3 | M2d | 3.9 | 7.70 | −0.55 | 0.16 | 3.54 | 0.03,0.03 | 0.27 | 6.03 | TD/ext |
| WMW 199/XMM | 18:29:47.2 | 01:22:34.7 | K8 | 5.2 | 4.92 | 0.36 | 0.16 | 3.59 | 0.01,0.02 | 0.32 | <5 | Li/X/ext |
| WMW 81/XMM | 18:29:53.6 | 01:17:01.7 | K6 | 4.6 | 6.20 | −0.28 | 0.18 | 3.62 | 0.02,0.03 | 0.66 | 6.36 | Li/Hα/X/IRX/ext |
| WMW 201/XMM | 18:29:55.4 | 01:10:34.0 | M5 | 0.0 | 11.98 | −1.57 | 0.16 | 3.48 | 0.02,0.02 | 0.14 | 6.83 | Hα/X |
| WMW 38/XMM | 18:29:55.7 | 01:14:31.5 | <K6 | ... | ... | ... | ... | >3.62 | ... | ... | ... | X/IRX |
![$[CDF88]\;7$](https://content.cld.iop.org/journals/1538-3881/149/3/103/revision1/aj508881ieqn29.gif) /XMM /XMM |
18:29:56.1 | 01:00:21.7 | B5 | 5.3 | −1.21 | 2.96 | 0.10 | 4.18 | 0.10,0.01 | 5.1 | 7.81 | X/ref. neb. |
| WMW 205/XMM | 18:29:56.2 | 01:10:55.8 | K3 | 3.2 | 5.24 | −0.01 | 0.32 | 3.68 | 0.05,0.04 | 1.1 | 6.59 | Li/X/TD |
| WMW 193/BD+01 3689B | 18:29:57.5 | 01:10:46.4 | A5 | 0.16 | 1.37 | 1.41 | 0.30 | 3.91 | 0.06,0.03 | 2.3 | 6.68 | X |
| WMW 192/HD 170545 | 18:29:57.6 | 01:10:52.9 | A2.5 | 0.25 | 0.02 | 1.98 | 0.20 | 3.94 | 0.03,0.01 | 3.0 | 6.36 | X |
| WMW 83/KOB 319 | 18:29:57.8 | 01:15:31.9 | K3 | 22e | 1.96e | 0.58 | 0.22 | 3.68 | 0.05,0.04 | 1.0 | 5.70 | X/IRX |
| WMW 27/XMM | 18:29:58.2 | 01:15:21.7 | K5.5 | 5.5 | 6.70 | −0.51 | 0.16 | 3.63 | 0.02,0.02 | 0.85 | 6.97 | Hα/X/IRX/ext |
| WMW 59/XMM | 18:29:59.3 | 01:14:07.7 | K6 | 5.6 | 4.95 | 0.22 | 0.16 | 3.62 | 0.02,0.03 | 0.48 | 5.56 | Hα/X/IRX/ext |
| WMW 78/XMM | 18:30:03.4 | 01:16:19.1 | K5 | 3.9 | 5.79 | −0.16 | 0.26 | 3.64 | 0.04,0.02 | 0.75 | 6.35 | Li/X/IRX/ext |
| WMW 98/GFM 71 | 18:30:04.9 | 01:14:39.5 | M5d | 1.9 | 10.61 | −1.02 | 0.16 | 3.48 | 0.04,0.05 | 0.14 | 6.18 | X/IRX |
| WMW 84/XMM | 18:30:06.1 | 01:06:17.0 | M0 | 3.7 | 6.65 | −0.29 | 0.17 | 3.58 | 0.01,0.04 | 0.42 | 5.97 | Li/Hα/X/IRX/ext |
| KOB 359 | 18:30:06.4 | 01:01:05.8 | K6 | 3.0 | 6.56 | −0.43 | 0.18 | 3.62 | 0.02,0.02 | 0.75 | 6.68 | Li/Hα/X/IRX |
| WMW 73/XMM | 18:30:07.7 | 01:12:04.3 | K5.5 | 6.5 | 5.21 | 0.09 | 0.16 | 3.63 | 0.02,0.02 | 0.57 | 5.80 | Li/Hα/X/IRX/ext |
| XMM | 18:30:08.2 | 01:05:51.0 | M4.5 | 3.4 | 8.82 | −0.46 | 0.32 | 3.49 | 0.02,0.02 | 0.14 | 5.00 | Li/Hα/X |
| KOB 367 | 18:30:08.5 | 01:01:37.4 | K8 | 3.9 | 7.59 | −0.71 | 0.17 | 3.59 | 0.02,0.02 | 0.70 | 6.97 | Hα/IRX/ext |
| KOB 370 | 18:30:08.7 | 00:58:46.5 | K2 | 2.6 | 4.85 | 0.13 | 0.30 | 3.69 | 0.04,0.03 | 1.3 | 6.55 | Li/IRX |
| 18:30:10.7 | 00:58:13.3 | M1.5 | 2.0 | 6.93 | −0.28 | 0.61 | 3.55 | 0.09,0.03 | 0.29 | 5.77 | Li | |
| WMW 74 | 18:30:13.3 | 01:02:48.9 | M4d | 3.3 | 8.69 | −0.56 | 0.16 | 3.50 | 0.04,0.04 | 0.16 | 5.28 | TD |
| WMW 166/KOB 407 | 18:30:14.0 | 01:08:51.5 | M5d | 1.2 | 10.76 | −1.08 | 0.16 | 3.48 | 0.03,0.03 | 0.14 | 6.25 | IRX |
| WMW 40/XMM | 18:30:18.2 | 01:14:16.8 | K8 | 6.4e | 3.35e | −0.03 | 0.18 | 3.59 | 0.03,0.02 | 0.39 | 5.68 | Hα/X/IRX/ext |
| XMM | 18:30:21.9 | 01:21:07.7 | M3 | 1.8 | 9.32 | −1.03 | 0.30 | 3.53 | 0.02,0.03 | 0.26 | 6.59 | X |
| WMW 157/XMM | 18:30:22.4 | 01:20:44.0 | M1 | 1.8 | 7.60 | −0.59 | 0.20 | 3.56 | 0.02,0.01 | 0.41 | 6.31 | Li/X/TD |
| WMW 128/GFM 85 | 18:30:23.1 | 01:20:09.7 | M4 | 0.85 | 9.37 | −0.83 | 0.24 | 3.50 | 0.02,0.01 | 0.17 | 6.09 | X/TD |
| 18:30:23.3 | 01:06:22.6 | M3.5 | 2.0 | 8.79 | −0.71 | 0.22 | 3.51 | 0.02,0.02 | 0.18 | 6.03 | Li | |
| WMW 33/XMM | 18:30:23.4 | 01:05:04.6 | M3 | 1.6 | 9.08 | −0.93 | 0.30 | 3.53 | 0.02,0.01 | 0.25 | 6.43 | Li/Hα/X/IRX |
| WMW 220 | 18:30:24.5 | 01:19:50.7 | K1 | 0.79 | 5.68 | −0.22 | 0.18 | 3.71 | 0.02,0.02 | 0.99 | 7.28 | X |
| HD 170634 | 18:30:24.9 | 01:13:23.0 | B8 | 2.3 | −0.63 | 2.46 | 0.17 | 4.06 | 0.09,0.01 | 4.5 | 6.02 | ref. neb. |
| XMM | 18:30:25.7 | 01:09:32.9 | M5 | 0.0 | 11.18 | −1.25 | 0.61 | 3.48 | 0.03,0.03 | 0.15 | 6.44 | X |
| 18:30:33.5 | 01:02:56.8 | K4 | 3.9 | 7.32 | −0.82 | 0.31 | 3.66 | 0.05,0.03 | 0.72 | 8.00 | Li | |
| 18:30:35.0 | 00:59:02.7 | K3 | 6.3 | 4.72 | 0.20 | 0.16 | 3.68 | 0.02,0.02 | 1.1 | 6.27 | Li/ext | |
| XMM | 18:30:35.3 | 01:05:57.8 | K6 | 2.5 | 5.85 | −0.14 | 0.16 | 3.62 | 0.02,0.02 | 0.59 | 6.09 | Li/X |
| 18:30:35.4 | 01:19:07.0 | K1 | 6.2 | 4.05 | 0.43 | 0.16 | 3.71 | 0.02,0.02 | 1.6 | 6.42 | Li/ext | |
| XMM | 18:30:37.4 | 01:17:58.3 | K0 | 2.3 | 4.36 | 0.29 | 0.45 | 3.72 | 0.08,0.08 | 1.5 | 6.72 | Li/X |
| XMM | 18:30:39.6 | 01:18:03.1 | K4 | 1.9 | 5.63 | −0.14 | 0.16 | 3.66 | 0.02,0.03 | 0.91 | 6.55 | Li/X |
| XMM | 18:30:40.2 | 01:10:27.6 | M1.5 | 6.0e | 6.46e | −1.27 | 0.17 | 3.55 | 0.01,0.01 | 0.39 | 7.31 | X |
| 18:30:52.8 | 01:09:26.6 | K2 | 6.7 | 4.14 | 0.41 | 0.18 | 3.69 | 0.02,0.02 | 1.3 | 6.16 | Li/ext | |
| 18:30:56.6 | 01:02:41.4 | K6 | 3.5 | 4.78 | 0.29 | 0.35 | 3.62 | 0.06,0.02 | 0.46 | 5.48 | Li/ext |
aSource names from X-ray, optical or infrared studies by: (XMM) XMM-Newton survey by Preibisch (2003), (WMW) Spitzer survey by Winston et al. (2007), (GFM) Chandra survey by Giardino et al. (2007), (CDF88) reflection nebulae survey by Chavarria-K. et al. (1988), (KOB) ISO survey by Kaas et al. (2004).
bMasses and ages estimated from the tracks and isochrones of D'Antona & Mazzitelli (1997) and F. D'Antona & I. Mazzitelli (1998, private communication) except for the two B stars for which the Siess et al. (2000) models were used.
cAssociation membership established through location above the main sequence and  > 3.5 mag (ext), the presence of Hα emission EW(Hα) > 10 Å(Hα), an infrared excess (IRX), identification as a possible transition disk object (TD), lithium absorption (Li), reflection nebulosity (ref. neb.), or X-ray emission (X). See text for details.
dSpectral types from Winston et al. (2009) and Oliveira et al. (2009).
e(
> 3.5 mag (ext), the presence of Hα emission EW(Hα) > 10 Å(Hα), an infrared excess (IRX), identification as a possible transition disk object (TD), lithium absorption (Li), reflection nebulosity (ref. neb.), or X-ray emission (X). See text for details.
dSpectral types from Winston et al. (2009) and Oliveira et al. (2009).
e( ) photometry from 2MASS used to compute
  and M(J).
Sixteen sources which met the extinction criterion above and had either weak Hα emission typical of weak-line T Tauri stars or possible lithium absorption were identified as possible association members. They are among the fainter sources (V < 18) in our spectroscopic sample. As none of these sources have IR-excesses, they appear slightly more evolved. These objects are listed in Table 5 as "weak criteria" sources and require further observations to confirm their nature.
Table 5. Weak Criteria Sources
| Namea | R.A.(J2000) | Decl.(J2000) | Sp. Ty. | Av | MV | log(L/L
 ) ) |
σlog(L/L
 ) ) |
logT(K) |
 , ,  logT(K) logT(K) |
Massb | log age | Criteriac |
|---|---|---|---|---|---|---|---|---|---|---|---|---|
| (hhmmss.s) | ( ' '' ) ' '' ) |
Adopt | (mag) | (mag) | ( ) ) |
(yr) | ||||||
| 18:28:56.8 | 01:21:03.2 | K3 | 4.2 | 6.20 | −0.39 | 0.16 | 3.68 | 0.02,0.02 | 0.9 | 7.22 | ext/poss Li | |
| ... | 18:28:56.9 | 01:17:51.0 | G0 | 7.3 | 4.20 | 0.29 | 0.17 | 3.78 | 0.02,0.01 | 1.2 | 7.30 | ext/poss Li |
| ... | 18:29:01.7 | 01:01:12.2 | K3 | 6.7 | 3.38 | 0.74 | 0.18 | 3.68 | 0.02,0.02 | 1.2 | 5.61 | ext/poss Li |
| KOB 61 | 18:29:02.3 | 01:18:31.0 | K0 | 7.3 | 4.02 | 0.43 | 0.17 | 3.72 | 0.02,0.05 | 1.7 | 6.56 | ext/poss Li |
| ... | 18:29:10.0 | 01:08:45.1 | G3 | 5.9 | 4.27 | 0.28 | 0.24 | 3.77 | 0.04,0.01 | 1.2 | 7.26 | ext/poss Li |
| ... | 18:29:17.1 | 01:12:52.8 | K3 | 7.9 | 3.84 | 0.55 | 0.18 | 3.68 | 0.02,0.02 | 1.1 | 5.82 | ext/poss Li |
| ... | 18:29:25.5 | 01:00:42.4 | K3 | 6.5 | 4.94 | 0.11 | 0.32 | 3.68 | 0.05,0.04 | 1.1 | 6.40 | ext/poss Li |
| ... | 18:29:37.6 | 01:03:23.6 | K6 | 5.0 | 5.88 | −0.15 | 0.18 | 3.62 | 0.02,0.02 | 0.6 | 6.11 | ext/poss Li |
| ... | 18:30:27.2 | 01:03:46.8 | F0 | 5.4 | 1.37 | 1.36 | 0.16 | 3.86 | 0.01,0.02 | 2.3 | 6.64 | ext/poss Li |
| ... | 18:30:28.4 | 00:57:25.1 | G7 | 6.4 | 3.57 | 0.58 | 0.17 | 3.75 | 0.02,0.03 | 1.6 | 6.81 | ext/poss Li |
| ... | 18:30:31.6 | 01:06:44.5 | K2 | 6.3 | 3.52 | 0.66 | 0.18 | 3.69 | 0.02,0.02 | 1.4 | 5.84 | ext/poss Li |
| ... | 18:30:38.2 | 01:06:02.9 | G9 | 4.7 | 5.22 | −0.06 | 0.16 | 3.73 | 0.02,0.02 | 1.1 | 7.28 | ext/poss Li |
| ... | 18:30:39.3 | 01:02:44.9 | K3 | 5.5 | 5.74 | −0.21 | 0.18 | 3.68 | 0.02,0.02 | 1.0 | 6.92 | ext/poss Li |
| ... | 18:30:40.5 | 01:01:06.1 | K1 | 5.7 | 5.35 | −0.09 | 0.18 | 3.71 | 0.02,0.02 | 1.1 | 7.09 | ext/poss Li |
| ... | 18:30:43.4 | 01:16:54.0 | K2 | 6.8 | 3.22 | 0.78 | 0.25 | 3.69 | 0.04,0.02 | 1.4 | 5.71 | ext/poss Li |
| ... | 18:30:51.5 | 01:17:02.5 | K5 | 3.8 | 6.79 | −0.56 | 0.20 | 3.64 | 0.03,0.02 | 0.8 | 7.18 | ext/weak Hα |
aSource name from infrared ISO survey by Kaas et al. (2004). bMasses and ages estimated from the tracks and isochrones of D'Antona & Mazzitelli (1997) and F. D'Antona & I. Mazzitelli (1998, private communication). cWeak Criteria Sources sit above the main sequence with an AV > 3.5 mag (ext) and possible lithium absorption (poss Li) or the presence of weak Hα emission (10 Å> EW(Hα) > 5 Å).
Download table as: ASCIITypeset image
Fourteen sources were found to have strong Hα emission with EW(Hα) >10 Å which is characteristic of classical T Tauri stars. An additional 7 objects showed weaker Hα emission (10 Å > EW(Hα) > 5 Å), all with either a K or M spectral type. Four of these 7 are association members and one is a weak criteria member. The remaining two sources are unclassified and possibly dMe stars. The variable nature of Hα emission is apparent when comparing sources observed months or years apart.
3.3. Spatial Distribution
The distribution of 63 confirmed and 16 possible association members is shown in Figure 3 relative to the Serpens molecular core as defined by contours of C18O integrated intensity (McMullin et al. 2000). Star symbols mark the locations of the two most massive association members in our survey: the B8 star HD 170634 and the B5 star [CDF88] 7. One has the impression that the B stars have helped shape the distribution of gas in the core. While our spectroscopic survey included sources over the entire field, there is a tendency for association members to be concentrated toward the molecular core yet avoid the highest column density gas. The distribution of association members drops off sharply to the north but is continuous to the southern edge of our survey area. This is consistent with the distribution of cloud material which continues to the south where it overlaps with the Serpens South molecular core (Cambrésy 1999; Oliveira et al. 2009). The 16 possible association members appear to avoid the dense molecular core. Since these sources appear to be slightly more evolved, one would expect that they would be X-ray emitters. However, most are located outside the field of view of the most recent x-ray survey (see Winston et al. 2007 Figure 3).
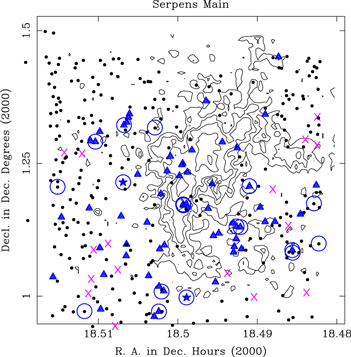
Figure 3. Distribution of association members is shown relative to contours of C18O integrated intensity (McMullin et al. 2000) that define the core of the Serpens molecular cloud. The map covers the 307 × 307 area of our imaging survey. Contours are in units of 1, 2, 3, 5, and 7.5 K km s−1. Association members are marked by triangles, possible association members by "x's," and unclassified sources by dots. Circles locate sources for which echelle spectra were obtained. Star symbols mark the locations of the two most massive association members of the Serpens Main cluster: the B8 star HD 170634 (BD+01 3694) which illuminates S 68 and the B5 star [CDF88] 7.
Download figure:
Standard image High-resolution image3.4. Hertzsprung–Russell Diagrams
Using our spectral classifications, effective temperatures were derived for each association member. Accounting for errors due to the observed range of spectral types as well as use of dwarf surface gravities, typical uncertainties were estimated to be ±250 K for K-M stars. Assuming dwarf, rather than subgiant, surface gravities led to a possible overestimate of Teff for stars with spectral types of G5-K5 by <250 K and an underestimate of Teff for stars with spectral types of M2-M5.5 by <200 K (e.g., Drilling et al. 2000). Intrinsic colors and bolometric corrections for dwarf stars were taken from Drilling et al. (2000) for B4-B7 stars, Schmidt-Kaler et al. (1982) for B8-K5 stars and from Bessell (1991) for K5-M7 stars.
In order to derive luminosities, sources were dereddened using the  color index assuming the reddening law derived by Cohen et al. (1981) with AR/AV in the Kron-Cousins system:


As noted in Columns 9 and 11 of Table 2, V and R band data were not available for 5 sources. They were dereddened using J and H band data from the 2MASS survey (Cutri et al. 2003) transformed into the CIT photometric system using the relationships derived by Carpenter (2001). Three of the sources with infrared excesses were dereddened to the classical T Tauri star locus (Meyer et al. 1997). Again using the reddening law derived by (Cohen et al. 1981):

For two sources in our sample, the errors in the photometry and/or spectral classifications yielded negative values for the extinction that were consistent with 0.0 within the errors.
The absolute V magnitude, M(V), was computed given the extinction and assuming a distance of 429 pc. Then the bolometric magnitude and luminosity were derived given:

and

In the situations where J and H were used to deredden, M(J) is recorded in Column 6 of Table 4 and was used along with BC(J) to derive Mbol.
The error in log(L) was estimated for each source by adding quadratically the uncertainties in the V and R magnitudes, the distance modulus (0.05 mag corresponding to a depth of ±10 pc), and the ( ) intrinsic color and BC(V) given the observed range of spectral types. We neglected possible uncertainties that might arise in the prefactors to Equations 1 and 2. Uncertainties in the extinction estimates dominated the error in log(L). The median error in log(L) was calculated to be 0.18 dex. Allowing for V band variability of ±0.1 mag typical of weak-line T Tauri stars (Grankin et al. 2008), the median error increased with 2/3 of the sample estimated to have uncertainties ≤0.22 dex.
H–R diagrams for association members and weak criteria members were made using tracks and isochrones from D'Antona & Mazzitelli (1997), F. D'Antona & I. Mazzitelli (1998, private communication), Palla & Stahler (1999, PS99), and Siess et al. (2000). The diagrams for the D'Antona & Mazzitelli (hereafter DM) and Siess et al. (2000) models are shown in Figure 4. The models yield similar median ages, even with the differences in treatments of the equations of state as a function of mass and of convection. Luminosities for several intermediate mass association members are only consistent with the current distance estimate of 429 pc; a distance to the cluster of 230–260 pc would place several association members below the main sequence. The masses and ages interpolated from the DM models are given in Tables 4 and 5. Masses range from 0.14  to 4.7
  with a median mass of 0.77
  . Ages range from log(age) of 5–8 with a median of 6.3. Since most of the objects lie on convective tracks, uncertainties in the mass relative to the DM models were estimated from the errors in the spectral classifications and uncertainties in the age from errors in the luminosities. Uncertainties in the mass for objects were typically 20–25%. Uncertainties in the log(age) were typically 0.24 dex relative to DM models. It is important to note that theoretical mass tracks may underpredict absolute stellar mass by 30–50% and absolute age by up to a factor of two if optical colors are used (Hillenbrand et al. 2009; Bell et al. 2012, 2013).

Figure 4. Hertzsprung–Russell diagrams for the Serpens Main association members with optically determined spectral types assuming a distance of 429 pc. The solid triangles mark the positions of association members and "x's" of possible association members relative to the theoretical tracks and isochrones of D'Antona & Mazzitelli (1997, 1998, private communication) in Figure 4(a), or Siess et al. (2000) in Figure 4(b). Error bars in Log Teff were estimated from uncertainties in the spectral type and surface gravity. Error bars in Log Lbol were estimated from errors in the photometry and uncertainties in the distance modulus and bolometric correction. In Figure 4(a), isochrones shown as solid lines are 105, 3 ×10⁵, 106, 3 ×10⁶, 107, and 108 yr. Evolutionary tracks from 0.02  to 3.0
  are shown by dashed lines. The bold dashed line marks the evolutionary track for a star at the hydrogen-burning limit. In Figure 4(b), isochrones shown as solid lines are 105, 3 ×10⁵, 106, 3 ×10⁶, 107, and 108 yr. Evolutionary tracks from 0.1
  to 7.0
  are shown by dashed lines.
Download figure:
Standard image High-resolution image3.5. Age Distribution
The values for log(age) derived from the models (DM, PS99, and Siess et al. 2000) are consistent with a normal distribution with a median log(age) from the DM models of 6.26 ± 0.08 (∼2 Myr). This is in agreement with findings of Kaas et al. (2004) who derived an age of 2 Myr for class II sources based on modeling of luminosity functions. Median ages derived from the PS99 and Siess et al. (2000) models are systematically older with log(age) = 6.49 and log(age) = 6.65, respectively.
Evidence for an intrinsic spread of ages in Serpens Main is sensitive to the assumption of random and systematic errors in Log L and choice of PMS models. Assuming Gaussian-distributed errors in log T (0.03 dex) and log L (0.22 dex) and using the DM models for a single 2 Myr isochrone, a Monte Carlo simulation derived values of log T and log L for over 10,000 samples in the mass range of 0.12–1.0  weighted by the Chabrier (2003) system mass function. Kolmogorov–Smirnov (K–S) tests were run with the association members and simulation sources, restricted to stars with log(age) = 5.0–8.0 and with masses between 0.14
  (lowest association member mass) and 1.7
  (the highest value in the simulation). For the DM models, the K–S test results in a probability of 5.0% suggesting that we cannot reject the null hypothesis that they were drawn from the same parent population. However, using the same procedures with the Siess et al. (2000) models, the K–S test produces a probability of 0.93%, suggestive of an age spread. Indeed, Winston et al. (2009) have reported an apparent age spread for this region. However, our initial analysis did not take into account possible sources of error such as accretion (which is partially included in the uncertainty introduced by variability, Section 3.4) or unresolved binaries (e.g., Hartigan et al. 1994; Gullbring et al. 1998). We note that these two effects will tend to offset as the effect of the unresolved companions overestimates the luminosity while bluer colors due to accretion will underestimate the extinction and hence the luminosity. In addition, the majority of objects have been dereddened assuming colors of main sequence stars while ignoring the effects of lower surface gravities and cool spots on YSO colors (e.g., Gullbring et al. 1998; Pecaut & Mamajek 2013). These effects will tend to redden the colors of YSOs leading to an overestimate of their luminosities. Consideration of all of these effects will serve to increase further the uncertainties in log (L) and weaken any evidence for an age spread in our data. An effort was made to deredden sources and derive luminosities using near-infrared (near-IR) data which reduced uncertainties in Log L introduced by the extinction. But after adding the effects of near-IR variability (e.g., Carpenter et al. 2001), the error in Log L was still about 0.2 dex on average. To test further for an intrinsic spread in ages, high resolution spectra enabling more accurate luminosity estimates and more sophisticated simulations may be needed (e.g., Cottaar et al. 2014).
3.6. Infrared Excesses and Transition Disk Objects
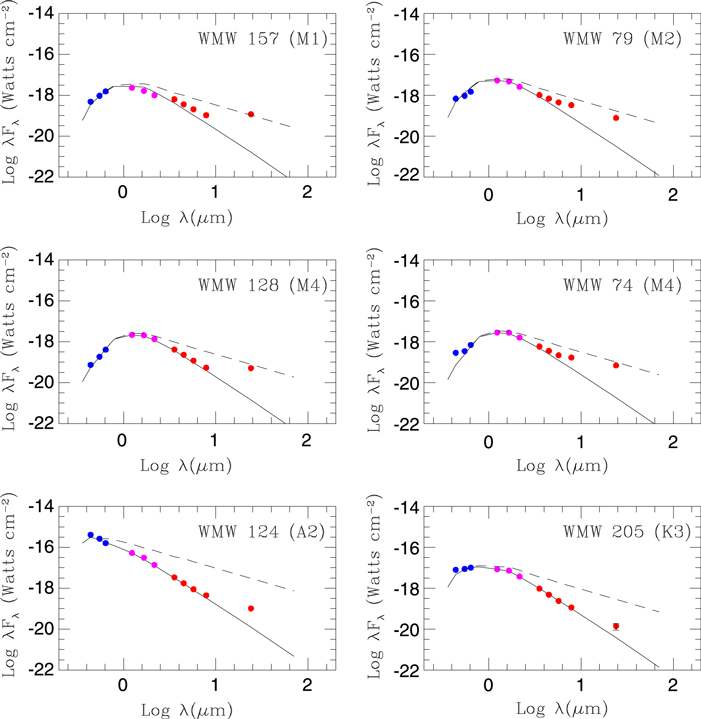
An initial assessment of the presence of a circumstellar disk can be determined by the slope of the mid-infrared energy distribution. Following the analysis of Lada et al. (2006), we performed a least squares fit to the IRAC flux densities observed with the (SST). A spectral index a ≥ −1.80 is indicative of an optically thick disk while −1.80 ≤ a ≤ −2.56 is representative of an "anemic" and possibly a transition disk. The results of our fits are shown in Figure 5 and suggests there are 22 association members with optically thick disks and 3–4 sources with "anemic" disks.

Figure 5. Spectral indices using the IRAC flux densities as a function of spectral type. Running numbers for spectral types B0, A0, F0, G0, K0, K5, M0, and M5 are 0,10, 20, 30, 40, 50, 60, and 70, respectively. Dotted lines are α = −1.80 and α = −2.56, sources above α = −1.80 have optically thick disks, and sources below α = −2.56 have no disks, sources between these values are potential transition disk objects. The spectral index was computed using a linear least-squares fit to the 3.6-8.0 μm flux densities. Error bars were calculated from the fit given the statistical uncertainties in the flux densities.
Download figure:
Standard image High-resolution imageWe can refine these classifications given the spectral types, visual extinctions, and optical/infrared photometry available for each association member. Dereddened spectral energy distributions were constructed for each association member using optical data from this study, near-IR data from the 2MASS catalog (Cutri et al. 2003), and mid-infrared data from 3.55–70 μm from the SST compiled in the C2D Fall '07 Full CLOUDS Catalog (Evans et al. 2003). The dereddened spectral energy distributions could then be compared to that expected from a stellar photosphere and from a face-on reprocessing disk scaled to the source flux at R or J. Disk models were taken from Hillenbrand et al. (1992) for A0, F0, G0, K0, K5, M0, and M3 stars.
The presence of an infrared excess from an optically thick disk is indicated for 21 association members as noted in the last column of Table 4. Our results agree well with previous classifications using data from the Infrared Space Observatory (Kaas et al. 2004) and the SST (Winston et al. 2009) with a few exceptions. Kaas et al. (2004) list BD+01 3687 as a possible transition object while our analysis indicates no excess out to 24 μm. We would include WMW 166 as having an optically thick disk as opposed to the previous classification as a transition disk object (Winston et al. 2009). We identify six association members as possible transition objects (sources without near-IR excesses) and show their spectral energy distributions in Figure 6. Three of the sources, WMW 124, WMW 128, and WMW 157 have been previously identified as such by Winston et al. (2009). We add WMW 205 to this category (previously classified as class 3) and note two sources with evidence for inner disk holes: WMW 74 and WMW 79. For the 4 objects for which we have spectra, three sources show weak Hα emission (−0.6 to −4.4 Å), suggesting they are weakly accreting. For the A2 star WMW 205, strong Hα absorption could be slightly filled by weak emission. The ages for these sources are 1–6 Myr and only WMW 74 is younger at 0.2 Myr.
Figure 6. Dereddened spectral energy distributions are presented for six possible transition disk objects. B, V, and R band data points are from this study, J, H, and K band data from 2MASS, and 3.6–8 and 24 μm data from IRAC and MIPS on the Spitzer Space Telescope. The solid curve is the spectral energy distribution of a blackbody given the effective temperatures from our spectral classifications, normalized to the R or J band flux density. The dashed curve is the flux density expected from a face-on reprocessing disk.
Download figure:
Standard image High-resolution image
In summary, 21 association members show evidence for an optically thick disk and 6 objects for an optically thin or possible transition disk. At face value, this suggests a disk frequency of 42% (+10%, −8%) with the uncertainty estimated using Poisson statistics (Gehrels 1986). One obtains a nearly identical disk frequency of 37%, but with much greater uncertainties, if one considers only an extinction-limited sample of 19 association members with M ≥ 0.6  and
and  4.0 mag assuming an age of 2 Myr using the DM models. This compares well with the disk frequency derived for optically visible association members in the Rho Ophiuchi L 1688 cloud (3 Myr, Erickson et al. 2011) and YSOs in IC 348 (2 Myr, Lada et al. 2006) and the trend of decreasing disk frequency with the age of the cluster (e.g., Briceño et al. 2007).
3.7. Accretion and Rotation Rates
For association members with strong Hα emission, the Gaussian full width at 10% of maximum was used to estimate an accretion rate using the relation developed by Natta et al. (2004) when the velocity width at 10% maximum was greater than 270 km s−1. This relation assumes a negligible contribution from an outflow. Accretion rates were estimated for 10 sources, with a range of log  from −9.4 to −7.0. One source had a log
  outside of this range, but with an Hα profile showing blueshifted absorption that will result in an overestimate of the accretion rate. All ten sources had an infrared excess, with spectral indices determined from mid-infrared data between −0.24 and −1.30 (see Section 3.5), however, there was no trend found between the spectral index and accretion rate.
The values we derived for v sin i are generally consistent with those found in main sequence and/or PMS stars of the same spectral type. Of the seven YSOs with v sin i values, all are on their radiative tracks (Figure 4) and only WMW 124 shows evidence for a circumstellar disk, albiet with a large inner disk hole (Figure 6). Both WMW 192 and WMW 124, with v sin i values around 30 km s−1, have projected rotational velocities slower than typical A stars which have median values around 100 km s−1 (Wolff et al. 2004; Glebocki & Gnacinski 2005; Dahm et al. 2012). However for WMW 124, v sin i was determined from only 3 lines, so its value is poorly determined. The presence of a circumstellar disk could explain the lower value for WMW 124 via a disk-braking mechanism (Koenigl 1991), although a low source inclination could equally well explain the values of both sources. Our echelle spectrum of the YSO J183037.4+0117581 has both the hydrogen lines and Ca ii triplet partially filled in with emission. This is an X-ray source that has no infrared excess, leading us to believe this is a result of chromospheric activity. This interpretation is consistent with our estimate of v sin i = 39 ± 3 km s−1 which is significantly higher than the median value of 5 km s−1 for K0V stars (Glebocki & Gnacinski 2005) but consistent with pre-main sequence stars on radiative tracks in the Orion and Upper Sco OB associations (Wolff et al. 2004; Dahm et al. 2012).
3.8. Radial Velocities and IMF
We attempted to derive radial velocities from the echelle spectra, using the cross-correlation IRAF routine fxcor, however we were unsuccessful. This was largely due to scarcity of usable lines in early type stars. We derived an Initial Mass Function of the form dN/dlog M, using sources identified as association members. The slope of our IMF (1.25 ± 0.5) is consistent with the field star IMF for sources above 1 
4. DISCUSSION
4.1. Comparisons with the Rho Ophiuchi Cluster
Optical spectroscopic studies have been performed in several star-forming regions such as the Orion Nebula Cluster (ONC), IC 348, Chamaeleon I, Lupus, Ophiuchus, and others (Luhman et al. 2003; Luhman 2007; Hillenbrand et al. 2013; Erickson et al. 2011; Mortier et al. 2011). These studies are often biased toward a particular stage in stellar evolution, e.g., objects with infrared excesses or X-ray emission. Of these regions, the young cluster in Ophiuchus is the most favorable for comparison with the present Serpens study since an unbiased optical spectroscopic study of the Rho Ophiuchi (L1688) molecular cloud using the same techniques as described in this paper has been conducted (Erickson et al. 2011).
Apart from the difference in distance (130 versus 429 pc), the two regions share many similarities. The molecular clouds are similar in mass (∼1000  Loren 1989; Olmi & Testi 2002) with centrally condensed cores. The clouds lack the disruptive effects of high mass stars since the most massive stars which have formed in both clouds are mid-B stars. Like L 1688, Serpens has a younger embedded population with class 0 and 1 spectral energy distributions in several dense molecular cores surrounded by a slightly older, more distributed population. This more evolved population tends to avoid the highest density of gas in these regions. The smaller number of optically visible YSOs in Serpens (63–79) compared to L 1688 (132) can be attributed to the greater distance of Serpens which limited our sensitivity to the lowest mass YSOs.
The median ages of these populations derived from the same PMS DM models are in the 2–3 Myr range. Hence it is not surprising that the disk frequency of 42% ± 10% for the optically visible sources in Serpens is comparable to the disk frequency of 27% ± 5% found in L 1688 (Erickson et al. 2011). It is difficult to compare the mass functions (IMF) of Serpens to other regions, as we were not able to probe the lower end of the mass function due to Serpen's greater distance. However at the high mass end ( ), the IMF agrees with the field star IMF as was found in L 1688 and other regions.
There is some evidence for a relatively larger spread in luminosities and hence ages in Serpens compared to Ophiuchus. Given the similarities between the two regions, the number of unresolved binaries and effects of episodic accretion and variability on Log L should be similar.10 Uncertainties in spectral classifications and photometry are comparable in both studies. For consistency with the Erickson et al. (2011) study, we disregard the effects of variability and uncertainties in the bolometric corrections and intrinsic colors with spectral type and derive a median error in Log L = 0.16 dex for Serpens. Using the DM models, a K–S test of the ages derived for the Serpens association members against a Monte Carlo simulation as described in Section 3.5 results in a probability of 0.96%, i.e., we reject the null hypothesis that they were drawn from the same parent population. For comparison, Erickson et al. (2011) found that a K–S test of the ages derived for the young cluster in L 1688 against those from a Monte Carlo simulation yielded a probability of 3.8%, consistent with the absence of an age spread.
What could be the origin of an apparent larger spread in luminosities and ages in Serpens relative to Ophiuchus? The trigger for star formation in L 1688, which is proposed to be a supernova shock originating in Upper Sco, could have initiated star formation on a global scale whereas the Serpens cloud could be forming stars over an extended period of time as the cloud evolves (Hartmann et al. 2012). Indeed, a cloud-cloud collision has been proposed as a trigger for the most recent star formation in the Serpens Main cluster (Duarte-Cabral et al. 2010). Alternatively, the greater distance of the Serpens cloud could lead to foreground contamination and an apparent luminosity spread. As discussed earlier, YSOs in Serpens could be spread over a wider range of distances due to the presence of YSOs formed in foreground clouds associated with the Aquila Rift. Supporting this picture, there is strong evidence for multiple cloud components toward the Serpens cloud core (McMullin et al. 2000; Duarte-Cabral et al. 2010; Levshakov et al. 2013). If there are YSOs in our sample foreground to the Serpens Main cluster, we would expect them to have low extinctions (AV < 3.5 mag) and, due to the overestimate in distance, younger ages (age <1 Myr). There are eight sources that met these criteria. A K–S test between a sample with the foreground candidates removed and a Monte Carlo simulation with no age spread yielded a probability of 67.5%, i.e., we could not reject the null hypothesis that they were drawn from the same parent population to a high degree of confidence. While this is not definitive, the idea that the relative age spread may in part be the result of contamination from foreground stars is plausible.
5. SUMMARY
A deep B, V, and R band survey of a 307 x 307 area centered on the Serpens Main cluster is presented. A V versus ( ) color magnitude diagram was used to select candidate YSOs for an optical spectroscopic survey. Over 700 moderate resolution optical spectra were obtained for 345 candidate YSOs.
Sixty-three objects with optical or infrared spectral types were identified as association members based on the presence of Hα in emission, lithium absorption, and when combined with published data, X-ray emission, a mid-infrared excess, and/or reflection nebulosity. Fifteen of these were newly identified PMS objects, 12 solely on the basis of Li absorption. This underscores the need for multi-wavelength surveys to obtain a complete census of YSOs in star-forming regions. An additional 16 possible association members had either a weak detection of Hα emission, possible lithium absorption, or association through extinction considerations; their PMS nature is in need of confirmation.
Masses and ages were derived for association and possible association members using multiple theoretical models. Our sample is 86% complete for sources with M ≥  and AV < 4 mag. Luminosities for several association members were only consistent with the current distance estimate of 429 pc; a distance to the cluster of 230–260 pc would place several association members below the main sequence. Using the tracks and isochrones from DM models, we derived a median age of 2 Myr for this sample. When compared to simulations while accounting for the major sources of uncertainties in the derived luminosities, there is no obvious evidence for an age spread. However, there does appear to be a larger spread in luminosities and hence ages in Serpens relative to the young cluster in Ophiuchus which could be intrinsic to the region or the result of a foreground population of YSOs associated with the Aquila Rift.
Dereddened spectral energy distributions from optical through mid-infrared wavelengths were modeled for association members and compared to expected flux densities from a stellar photosphere and face-on reprocessing disk. We found a circumstellar disk frequency of 42% ± 10% for our sample, which agrees fairly well with findings from other young star-forming regions of similar age for optically visible association members. Six sources were identified as candidate transition disk objects; three of these are newly identified. Accretion rates for sources with strong Hα emission ranged from log  of −9.4 to −7.0, however, no trend was found between the spectral index and accretion rate.
Surface gravities indicators in our moderate resolution spectra led to the identification of 12 background giants. Using CaH indices, association members with spectral types K5 and cooler were found to exhibit surface gravities in agreement with dwarf standards. Surface gravities and rotational velocities were estimated from high resolution echelle spectra for 11 association members. Estimates for log g were found to be consistent with dwarf or sub-giant stars. Values for v sin i were in agreement with values for PMS stars of the same spectral type with the exception of two A stars which had lower rotation rates. One of these is a candidate transition disk object, suggesting that disk braking could be playing a role in the slower rotation. Finally, the spectrum for J183037.4+0117581 exhibits hydrogen lines and Ca ii triplet lines partially filled in with emission which is likely the result of chromospheric activity.
We would like to dedicate this paper to Richard D. Schwartz who provided us with critical calibration data before he passed away in 2011. B.W. and K.E. gratefully acknowledge support from the Missouri Research Board and the College of Arts and Sciences at the University of Missouri-St. Louis and K. E. for support from a graduate fellowship from the NASA/Missouri Space Grant Consortium, a dissertation fellowship from the University of Missouri-St. Louis, and a Grant-in-Aid of Research from Sigma Xi. M.R.M. acknowledges support from the Swiss National Science Foundation (SNF). We thank Jesus Hernandez for his advice in using SPTCLASS, Eric Mamajek for sharing his program to interpolate ages and masses from pre-main sequence models, Joe McMullin for providing a digital version of his C18O map, and the referee for detailed and insightful comments and suggestions. We would like to especially thank Nelson Caldwell for acquiring our 2011 MMT data. We thank Daryl Willmarth and Dianne Harmer for assisting with observing at the WYIN telescope. We would like to acknowledge University of Arizona Observatories, for providing us time on several telescopes. Finally, we acknowledge Harper Smith, Krystal Kasal, Jason LaCroix, and John Robinson for their invaluable assistance with the observations and data reductions. This research has made use of the NASA/IPAC Infrared Science Archive, which is operated by the Jet Propulsion Laboratory, California Institute of Technology, under contract with the National Aeronautics and Space Administration, and the SIMBAD database and the VIZIER catalog access tool, CDS, Strasbourg, France.
Footnotes
- *
Observations reported here were obtained at the MMT Observatory, a joint facility of the University of Arizona and the Smithsonian Institution. This paper includes data gathered with the 6.5 m Magellan Telescopes located at Las Campanas Observatory, Chile.
- 6
IRAF is distributed by the National Optical Astronomy Observatory, which is operated by the Association of Universities for Research in Astronomy, Inc., under cooperative agreement with the National Science Foundation.
- 7
The WIYN Observatory is a joint facility of the University of Wisconsin-Madison, Indiana University, Yale University, and the National Optical Astronomy Observatory.
- 8
This research was achieved using the POLLUX database (http://pollux.graal.univ-montp2.fr/), operated at LUPM (Universite Montpellier II—CNRS, France) with the support of the PNPS and INSU.
- 9
A minimum AV of 3.5 was selected using the results of Straiz̆ys et al. (2003) who reported a maximum extinction in the direction of Serpens of AV = 3 mag at a distance <360 pc. Hence, we expect that sources with an AV > 3 mag will be located behind foreground clouds from the Aquila Rift.
- 10
Due to Serpen's greater distance the number of unresolved binaries in seeing-limited imaging data (∼1'') is slightly greater, 79% in Serpens versus 67% in Ophiuchus (cf. Raghavan et al. 2010).