


Abstract
The Herbig Ae star HD 169142 is one of the objects that show complex structure, such as multiple (innermost, middle, and outer) disks, gaps, and unresolved sources. We made N-band (8–13 μm) observations of HD 169142 with the Cooled Mid-Infrared Camera and Spectrometer on the 8.2 m Subaru Telescope. The images are spatially resolved out to an ∼1'' radius in all the observed bands. We made a simple disk model composed of an unresolved central source (representing the innermost disk/halo) and the ring at a radius r ∼ 25 au (corresponding to the inner wall or edge of a middle disk at ∼25–40 au). The radial intensity profile within the central region (≲0 3 or
3 or  au) is well reproduced by the model. Furthermore, we subtracted the model image from the observed one to search for additional structures. In the model-subtracted images, we found an unresolved west source separated by 17.0 ± 2.9 au in the direction of position angle 260° ± 5° from the original emission peak, which is supposed to correspond to the position of the central star, and a bright east arc located at r ∼ 60 au. The west source is different from the L'-band unresolved source recently found in coronagraphic observations. It could be a structure related to planet formation in the disk, such as a circumplanetary disk or clumpy disk structure. The east arc corresponds to the inner wall or edge of the outer disk.
Export citation and abstract BibTeX RIS
1. Introduction
As the number of detected exoplanets is increasing, their universality and diversity are becoming more evident. Since they are formed in protoplanetary disks through the accumulation of gas and dust grains, it is important to understand the properties and evolution of the disks when studying planet formation. Recent observations have revealed detailed insight into these issues. In particular, direct imaging and/or interferometric observations with high angular resolutions have resolved many circumstellar disks around low-to-intermediate-mass stars at various wavelengths from optical to radio. Herbig Ae/Be stars (HAEBEs), which are pre–main-sequence (PMS) stars of intermediate mass, tend to have brighter and more extended protoplanetary disks than T Tauri stars, which are low-mass counterparts (i.e., they are solar-analogous PMS stars), because of their much greater central stellar luminosities. Thanks to this advantage, many disks around HAEBEs are more easily resolved by ground-based 8 m class optical/infrared telescopes and radio interferometers (e.g., AB Aur by Fukagawa et al. 2004; Honda et al. 2010; Hashimoto et al. 2011; HD 142527 by Fujiwara et al. 2006; Fukagawa et al. 2006; Grady et al. 2007; HD 169142 by Honda et al. 2012; Quanz et al. 2013; Osorio et al. 2014; HD 20075 by Okamoto et al. 2009; HD 97048 by Lagage et al. 2006; SAO 206462 by Grady et al. 2009; Muto et al. 2012; and HL Tau by ALMA Partnership et al. 2015). Studying these direct images has provided many details of the disk structures and their evolution related to the formation of planetary systems, such as gaps, spiral arms, warps, azimuthal asymmetry, etc.
Among the protoplanetary disks with characteristics of evolved structures, transitional disks have been attracting recent attention. They show evidence for gaps or inner cavities due to the lack of small dust grains in the inner regions. Such disks are considered to be in transition from an initial continuous protoplanetary disk to a debris disk. A variety of mechanisms have been put forward as being capable of producing these gaps/cavities: photoevaporation, gravitational instabilities, and dynamical clearing (Bryden et al. 1999; Alexander et al. 2006; Chiang & Murray-Clay 2007). The latter two are particularly interesting because such processes could occur when planets are forming. When a protoplanet is formed, it could dynamically sweep and/or accumulate gas and dust around its orbit, creating a gap or an inner cavity.
Direct imaging and a combination of imaging and spectral energy distribution (SED) analysis suggest that several HAEBEs are in fact at a transitional disk stage (Honda et al. 2010, 2012). Meeus et al. (2001) classified HAEBEs into two groups (I and II) on the basis of the SEDs. While the SEDs of group I sources can be accounted for by a power law and an additional blackbody emission in the mid- to far-infrared, those of group II show a continuum emission that can be fitted with only a single power law. Meeus et al. (2001) interpreted that the SED of group I can be explained by a continuous flared outer disk irradiated by the central star, whereas the power-law SED of group II can be reproduced with a flat disk. However, group I HAEBEs have a higher probability of being spatially resolved in the 20 μm region (9 out of 11 samples in Honda et al. 2015) with radii greater than ∼20 au. Honda et al. (2015) concluded that the steep SED rise in the mid- to far-infrared in group I HAEBEs results from both the warm inner wall of the outer disk directly irradiated by the central star and a lack of near- (to short mid-) infrared emission due to the inner cavity. They suggested that group I HAEBEs possess transitional disks rather than continuous flaring disks.
HD 169142 is a group I Herbig Ae star with an extended 20 μm emission. Previous observations suggest the presence of disks and gaps around this object. Observing this object in the mid-infrared, especially at around 10 μm with a high special resolving power, will reveal the structure in the disk's inner region at radii from several to a few tens of au. We made imaging and spectroscopic observations of HD 169142 with the Subaru/Cooled Mid-Infrared Camera and Spectrometer (COMICS) in the N-band (8–13 μm). Using the 8.2 m Subaru Telescope, the diffraction limit ( ) of 025 can be achieved at a wavelength of 10 μm where structures down to the size of ∼01 can be probed by careful observation and data reduction, together with a simple model. To achieve as high a spatial resolution as possible, and to avoid telescope tracking errors, we took short (60–100 ms) exposures and saved all the images for later analysis. Further, we observed a point source (a standard star) in order to obtain a point-spread function (PSF) reference with the same method. In this paper, we report the results of these measurements and discuss the structure of the disk around HD 169142.
2. HD 169142
HD 169142 is a Herbig Ae star classified as group I (Meeus et al. 2001) and is located at 145 pc (Sylvester et al. 1996). From its visual spectrum, Dunkin et al. (1997a, 1997b) determined that it is an A5Ve star and derived a stellar temperature of 8200 K. Van den Ancker (1999) estimated its stellar luminosity to be 15.33 ± 2.17  and the stellar mass to be 2.28 ± 0.23
  . Grady et al. (2007) found a co-moving PMS star 93 from HD 169142 and estimated the age of the entire system to be
  Myr.
Myr.
HD 169142 is surrounded by a transitional disk with complicated structures observed at various wavelengths. Figure 1 illustrates these various disks, cavities, and sources. In the radio band, a nearly face-on rotating gas disk was detected (Dent et al. 2006; Raman et al. 2006; Panić et al. 2008). Raman et al. (2006) measured the disk to extend out to 235 au in radius with The Submillimeter Array (SMA) 12CO J = 2–1 observations and estimated the position angle (PA) of the major axis and the inclination of the disk to be 5° ± 5° and 13° ± 1°, respectively. Mariñas et al. (2011) resolved HD 169142 at 12 and 18 μm and found that the PSF-subtracted disk emission at 12 μm is almost circular. Honda et al. (2012) resolved the disk at 18.8 and 24.5 μm with direct imaging by Subaru/COMICS. They simultaneously fitted the spatial distributions of the extended emission and the SED with a two-dimensional radiative transfer disk model and found that the disk around HD 169142 has a large gap between the compact inner disk or the halo and the outer disk. The radius of the inner wall of the outer disk was estimated to be  au. Based on these results, they argued that HD 169142 is a source at a transitional disk stage.

Figure 1. Illustration of the various disks, cavities, and sources around HD 168142. Overlapped contours show our average image of the model-subtracted images for the N 8.8, 10.5, 11.7, and 12.5 bands. These contours are the same as those in Figure 8.
Download figure:
Standard image High-resolution imageThe detailed structure in the outer disk was spatially resolved at near-infrared and radio wavelengths. Grady et al. (2007) detected the disk between 057 and 14 from the central star using 1.1 μm scattered light by Hubble Space Telescope (HST) Near Infrared Camera and Multi-Object Spectrometer (NICMOS) coronagraphy. More recently, Quanz et al. (2013) and Momose et al. (2015) obtained polarized light images in the H-band. Both groups found a complicated disk emission composed of a ring and an outer disk. There is an apparent annular gap at ∼40–70 au in the outer disk, which extends to as far as 11 (160 au) in radius. Furthermore, the image obtained by Quanz et al. (2013) probed as close as ∼01 to the central star and revealed that the disk rim is located at ∼25 au. The 25 au rim seems to correspond to the inner wall of the outer disk modeled by Honda et al. (2012). At  , Osorio et al. (2014) revealed a ring of enhanced emission at radius 25–30 au, consistent with the 25 au rim found by Quanz et al. (2013). The inner region (
 au) is devoid of detectable 7 mm emission. Osorio et al. (2014) interpreted this ring as the rim of an inner cavity or gap, possibly created by a planet or substellar companion. An outer annular gap at 40–70 au in radius, corresponding to the gap identified in the H-band image, was marginally detected at
  . This gap may have been created by a protoplanet with mass
  Jupiter mass (Kanagawa et al. 2015). Based on modeling of the broadband SED and the 7 mm images, they also suggested a small (r ∼ 0.6 au) disk inside the central cavity. This may correspond to the inner disk/halo inferred by Honda et al. (2012) and Maaskant et al. (2013). Based on the distribution of dust in three annuli with gaps between them, Osorio et al. (2014) suggested that the HD 169142 disk is being disrupted by at least two planets or substellar objects.
HD 169142 shows prominent polycyclic aromatic hydrocarbon (PAH) features in the infrared region (Meeus et al. 2001; Sloan et al. 2005; van Boekel et al. 2005). Habart et al. (2006) found that the 3.3 μm PAH emission is extended with a FWHM of 03 (or 43 au). The feature is clearly visible above the continuum and is strong in the inner region (r  03), decreasing rapidly in the outer region. In contrast, HD 169142 shows no silicate emission, which was interpreted by the fact that the silicate grains had already grown too large to show dust-band features (van Boekel et al. 2005).
Since each feature in the disk is denoted by a different term in the literature, we summarize the structures discussed so far as follows (see Figure 1): (i) the outer disk at r ≳ 70 au (hereafter the outer disk), (ii) the annular gap at r ∼ 40–70 au (between the outer disk and the middle disk; the annular gap), (iii) the middle disk at r ∼ 25–40 au (the middle disk), (iv) the inner cavity inside the middle disk and outside the innermost disk/halo (the inner cavity), and (v) the innermost disk (or halo) at r ≲ 1 au (the innermost disk/halo). The inner wall of the outer disk at 23 au in the 20 μm emission inferred by Honda et al. (2012), the H-band ring emission at 25 au found by Quanz et al. (2013), and the enhanced 7 mm emission at ∼25–30 au detected by Osorio et al. (2014) all correspond to the inner wall or edge of the middle disk.
In the annular gap, a knot in the 7 mm continuum was found at r ∼ 50 au and PA ∼ 175°. Osorio et al. (2014) speculate that it could be tracing circumplanetary dust emission associated with the protoplanet responsible for creating the annular gap. They estimated the mass of the 7 mm emission as 0.6 Jupiter mass, although it is highly uncertain. In addition, point-like sources in the L'-band were found in the inner cavity at r = 011 ± 003 and PA = 0° ± 14° (Biller et al. 2014) and at r = 0156 ± 0032 and PA = 7 4 ± 113 (Reggiani et al. 2014), although these are likely to be the same source, considering the positional uncertainties. Reggiani et al. (2014) suggested that the L'-band source corresponds to a 28–32 Jupiter-mass planet according to the "COND" models of Baraffe et al. (2003). However, Biller et al. (2014) claimed that the L'-band source cannot be a photosphere of a substellar or planetary-mass companion based on the lack of an H- or Ks-band counterpart and must instead be a part of the disk feature. They suggested that it may be connected to ongoing planet formation.
3. Observations and Data Reduction
3.1. Imaging in the N-Band
Imaging of HD 169142 in the N-band using the COMICS (Kataza et al. 2000; Okamoto et al. 2003; Sako et al. 2003; Ishihara et al. 2006) on the 8.2 m Subaru Telescope was performed on 2007 June 5–6 (UT). We used six filters, namely, N 8.8, 10.5, 11.7, and 12.5 and UIR 8.6 and 11.2 (see Table 1). The pixel scale in the imaging mode is 013 pixel–1. We employed an on-chip chopping method with a chopping frequency of 0.43–0.45 Hz and a chopping throw of 12'', where the off-chopped beam was taken at the PA of 230° from the north.
Table 1. Filter Bands Used for Observations
| Filter | Wavelength (μm) | Included PAH Feature | |||
|---|---|---|---|---|---|
| Center | Width |

|

|
||
| UIR 8.6 | 8.59 | 0.42 | 8.38 | 8.80 | PAH 8.6 and partly 7.7 μm bands |
| N 8.8 | 8.75 | 0.75 | 8.37 | 9.13 | PAH 8.6 and partly 7.7 μm bands |
| N 10.5 | 10.49 | 0.99 | 10.00 | 10.98 | Very weak PAH 10.9 μm plateau |
| UIR 11.2 | 11.24 | 0.60 | 10.94 | 11.54 | PAH 11.2 and 11.05 μm bands |
| N 11.7 | 11.74 | 1.06 | 11.21 | 12.27 | Part of PAH 11.2 μm band |
| N 12.5 | 12.39 | 1.03 | 11.88 | 12.90 | Weak PAH 12.7 and partly very weak 12.0 μm band |
Download table as: ASCIITypeset image
In one chopping cycle, we repeated many short exposures. Then we repeated many chopping cycles. All of the individual (RAW mode) or co-added (ADD mode) exposures can be saved. In the ADD mode, the PSF could worsen due to tracking errors between short exposures. We used the RAW mode for the imaging. The exposure time and total integration time of HD 169142 and HD 169916 (flux and PSF standard; see below) are listed in Table 2.
Table 2. Observation Parameters
| Filter | Single Frame Exposure Time | Total Integration Time | |
|---|---|---|---|
| HD 169142 | HD 169916 (PSF Ref.) | ||
| UIR 8.6 | 100 ms | 87 s | 43 s |
| N 8.8 | 100 ms | 87 s | 43 s |
| N 10.5 | 60 ms | 95 s | 40 s |
| UIR 11.2 | 100 ms | 87 s | 43 s |
| N 11.7 | 80 ms | 96 s | 39 s |
| N 12.5 | 60 ms | 95 s | 40 s |
Download table as: ASCIITypeset image
According to the memory limits, the RAW mode data were saved in several number of files. Within each file, exposures are continuous except for short time breaks for chopping movement, but there are a few second break time exits in between files to save the data. The standard star HD 169916 was observed as a reference for the flux and PSF either just before or after HD 169142. HD 169142 and the standard star were observed at an airmass of 1.544–1.549 and 1.492–1.543, respectively.
Data reduction was performed as follows. First, the background signal was subtracted from each exposure frame using a standard chopping subtraction method. Then, flat-fielding was applied using a self-sky flat frame. We applied a shift-and-add method to stack the flat-fielded images. In this process, we divided the original pixel into 10 × 10 subpixels before shifting and adding, so as not to degrade the spatial resolution of the final image. We excluded exposures or frames in which the peak detection was unsuccessful, mainly due to the faintness of the source. Such exclusion occurred only for the HD 169142 data taken with the N 10.5 and 12.5 filters (∼10% of total exposures and several exposures, respectively). We applied this shift-and-add method to the RAW data taken continuously and got several shift-and-add frames.
The flux calibration was made based on Cohen et al. (1999). We used a relatively large aperture of 52 to measure the signal from the standard star. A growth curve was drawn to determine the size of the aperture at which the most flux was included. As a result, the flux density became accurate, but the aperture correction was required to estimate the fluxes from point-like sources, whose extraction aperture is smaller than 52.
3.2. Spectroscopy in the N-Band
We performed low-dispersion (R ∼ 250) spectroscopy in the N-band with the COMICS on the Subaru Telescope on 2007 June 5–6 (UT). We used the N-wide filter, which covers 7.2–13.5 μm with a combination of atmospheric transmission. We placed a long slit of 033 × 36'' along a PA of 50°. The secondary mirror was chopped to cancel the background radiation with a chopping frequency of 0.45 Hz and the same chopping throw (12'') as the imaging. The pixel scale in the spatial dimension on the spectrograph is 0165 pixel–1. We used the ADD mode. We again observed the standard star HD 169916 for the flux calibration and PSF reference. The standard star was observed both before and after the HD 169142 spectroscopy. The total integration time was 4068 and 497 s for HD 169142 and HD 169916, respectively. The airmass of HD 169142 and the standard star was 1.546–1.578 and 1.477–1.484, respectively, on June 5, and on June 6 it was 1.543–1.626 and 1.486–1.512, respectively.
Data reduction was conducted as follows. For flat-fielding, we used the thermal spectra of the cell cover of the primary mirror. The atmospheric absorption was corrected by the spectrum of the standard star HD 169916. For the 9.33–10.01 μm region, where ozone dominates atmospheric absorption, we corrected for the airmass difference between HD 169142 and the standard star by calculating the atmospheric transmission using the ATRAN code (Lord 1992). The standard deviation of the sky background at each wavelength was taken as an error. Along the slit direction, we integrated the spectrum over 18 centered on the peak emission.
4. Results
4.1. Images
Figure 2 shows the images of HD 169142 at the N-band. The images of the corresponding standard star HD 169916 are also shown so that the telescope structure is in the same direction as that for the HD 169142 images for each filter band. Therefore, the diffraction patterns due to the telescope spiders can be compared directly with those in the images of HD 169142 and the standard star. The flux of HD 169142 at each band is measured using a wide aperture (325 for UIR 8.6, N 8.8, and N 10.5 and 455 for UIR 11.2, N 11.7, and N 12.5). These aperture sizes are determined from encircled counts plots, but they are narrower than those for the standard star because the object is fainter and we cannot detect emission from the outer skirt. Uncertainties are estimated statistically from variations in shift-and-add frames.

Figure 2. Observed HD 169142 images (top row) and corresponding PSF images (images of the standard star HD 169916; bottom row) for a 325 × 325 area centered on the peak position of HD 169142 or HD 169916. North is up for HD 169142. The images of the standard star are rotated so that the diffraction patterns due to the telescope structure can be compared directly. The color distribution is assigned from the peak brightness level down to zero level for all images. Contours larger than the 3σ level are plotted for levels of peak  , where
  and
and  . Here, σ is the sky noise level (i.e., standard deviation of the background emission).
Download figure:
Standard image High-resolution imageThe fluxes of the stellar photospheric emission are estimated based on the SED model fit in Maaskant et al. (2013). The estimated fluxes are listed in Table 4 and are at most only several percent of the total flux of HD 169142 at these mid-infrared wavelengths. Thus, most of the N-band emission of HD 169142 originates from the circumstellar component.
Figure 3 shows the radial intensity profiles of HD 169142 and the PSF standard star averaged in the azimuth direction. The observing conditions were good enough to see the first few diffraction rings in the PSFs at all wavelengths, and they were stable during our observation. Figures 2 and 3 show that HD 169142 emission is resolved at all of the filter bands and that emission in the central region (≲03 or  au) extends to a larger radius than the PSF. The half widths at the half maximum (HWHMs) of HD 169142 (
 ) and the PSF (
 ) are listed in Table 3. In addition, faint emission extends to about 1'' in radius at most of the bands.

Figure 3. Azimuthally averaged radial intensity profiles of HD 169142 (red lines with red dotted error bars) with the radial intensity profiles of the PSF standard star (HD 169916; black lines with black dashed error bars). The azimuthally averaged radial intensity profiles of the model disk (the central unresolved component and the ring at r = 25 au) are also plotted (blue dashed lines). The green lines show radius 086, 093, 070, 10, 096, and 083 at UIR 8.6, N 8.8, N 10.5, UIR 11.2, N 11.7, and N 12.5, respectively, where the faint emission is detected with an S/N of 3. The model flux ratio of the ring to the center at each filter band is 1.4, 1.3, 2.8, 4.1, 4.5, and 6.4 for UIR 8.6, N 8.8, N 10.5, UIR 11.2, N 11.7, and N 12.5, respectively. All profiles are normalized at the peak emission for (a) the UIR 8.6 band, (b) the N 8.8 band, (c) the N 10.5 band, (d) the UIR 11.2 band, (e) the N 11.7 band, and (f) the N 12.5 band.
Download figure:
Standard image High-resolution imageTable 3. HWHM Values of the Observed Radial Profiles and Deconvolved Gaussian Size
| Filter | HD 169142 | PSF (HD 169916) | Deconvolved Gaussian | Bias-Free Size |
|---|---|---|---|---|

|

|

|

|
|
| UIR 8.6 |

|

|

|
0.044 |
| N 8.8 |

|

|

|
0.046 |
| N 10.5 |

|

|

|
0.062 |
| UIR 11.2 |

|

|

|
0.053 |
| N 11.7 |

|

|

|
0.052 |
| N 12.5 |

|

|

|
0.053 |
Note. All sizes are given in units of arcseconds.
Download table as: ASCIITypeset image
The faint emission is detected to 086, 093, 070, 10, 096, and 083 in radius at UIR 8.6, N 8.8, N 10.5, UIR 11.2, N 11.7, and N 12.5, respectively, when we set the detection limit as a signal-to-noise ratio (S/N) of 3. Mariñas et al. (2011) reported the diameter size at the wavelength 12 μm, which used a band filter similar to N 11.7, as 215 ± 019 and 262 ± 019 for the 1% and 0.5% brightness levels of the peak emission, respectively. The sizes at the same brightness levels from our N 11.7 band observations are 11 and 14 in radius for the 1% and 0.5% levels, respectively. The emissions at these levels are detected with an S/N of 2.4 and 1.1, respectively. The sizes measured here are similar to those of Mariñas et al. (2011). In our images, the extended emission does not show a clear cutoff in radius, and the measured sizes depend on the S/N. Thus, fainter emission can be extended further.
4.2. Spectrum
Figure 4 shows the spectrum of HD 169142 integrated over 18 along the slit centered on the peak emission. Prominent PAH-band emissions at 7.9, 8.63, and 11.25 μm, in addition to weak PAH-band emissions at 11.05, 12.0, and 12.73 μm, are detected. In addition, continuum emission covering the entire N-band is detected. The 7.9 μm band shows a plateau peak at ∼7.8–8.0 μm that is different and much redder than the usual 7.7 μm PAH band detected from many interstellar sources (Peeters et al. 2002; Tielens 2008). The spectrum agrees well with that obtained with the Spitzer Space Telescope (Sloan et al. 2005; Acke et al. 2010).
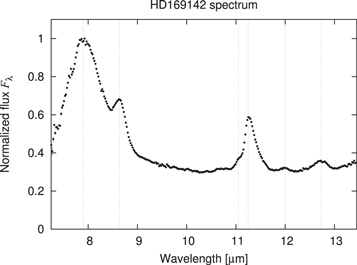
Figure 4. HD 169142 spectrum integrated over 18 along the slit centered on the peak (filled circles with error bars). Flux is normalized at the peak flux of the 7.9 μm PAH feature. The dotted lines show detected PAH features at 7.9, 8.63, 11.05, 11.25, 12.0, and 12.73 μm.
Download figure:
Standard image High-resolution imageBased on the total spectrum, we note that the properties of the wavelength coverage of the six filter bands used for the COMICS imaging are as follows. The N 10.5 and 12.5 bands are dominated by the continuum emission. The N 11.7 band contains a part of the 11.25 μm PAH band but is also dominated by the continuum emission. The UIR 11.2 band covers most of the strong 11.25 μm PAH band while it is dominated by the continuum emission in total. In contrast, the N 8.8 and UIR 8.6 bands contain the PAH emission of the 8.6 μm band and the skirt of the 7.9 μm band. In these two bands, the PAH and continuum emission contribute relatively equally. These filter-band properties are summarized in Table 1.
5. Discussion
Most of the emission from HD 169142 is concentrated near the center, but the source size is clearly extended compared with the PSF. First, we made a simple model composed of a central point source and a ring emission. This model should explain the HWHM radius of the observed image. Second, we subtracted the model emission from the observed image to extract those components not attributed to the central point source or ring emission.
5.1. Extended Emission in the Central Region
From the radius of the observed images ( ) and PSFs (
 ), we roughly estimated the intrinsic size of the source. If the PSF has a Gaussian shape and the intrinsic source has a Gaussian brightness profile, then the HWHM of the source can be calculated as
  . The PSF we obtained has a profile similar to Gaussian. By contrast, the real intrinsic source shape is likely to be complicated, as suggested by previous observations. Then, the Gaussian HWHMs (
 ) indicate a spatial structure near the center. These are listed in the fourth column of Table 3 and plotted in Figure 5. Under this simple assumption,
  is biased depending on the Gaussian size of the PSF (
 ), its dispersion, and the dispersion of the observed size (
 ). Because of this bias, even if the source size is infinitely small, the estimated
  from the observations has a non-zero value. We defined a bias-free size (
 ). Beyond this size, the difference between the size estimated from Gaussian deconvolution and a true-object Gaussian size is less than 5%. We estimated
  using Monte Carlo simulations. For a certain source size R and PSF size, we made
  using a Gaussian random generator with the same S/N as that of our observation and made
  using another Gaussian random generator. Then,
  was calculated only if
  . We repeated this 10,000 times and got a mean
  as a simulated value. With changing R, the smallest R value at which
  is defined as
  . The values of
  are listed in Table 3 and plotted in Figure 5. At all filter bands,
  is much smaller than
  . It shows that the instrumental artifacts are small enough and that the spectral dependence
  comes from the nature of the object.

Figure 5. The  of the deconvolved Gaussian at each wavelength (filled circles). Filled triangles show
  . Beyond
  , artificial bias on the estimated deconvolved size is less than 5%. The
  is estimated by Monte Carlo simulations.
Download figure:
Standard image High-resolution imageSince  is a measure of the size emitting with a half brightness of the peak emission, it is a measure of the core emission size rather than the faint extended emission. The derived
  sizes are 0109–0160, which correspond to 15.8–23.2 au at 145 pc.
The derived  size increases with the wavelength. At the longest wavelength (N 12.5), the size is similar to or slightly smaller than that of the ∼25 au ring, which corresponds to the inner wall of the middle disk (see Figure 1) suggested from the 18.8 and 24.5 μm images and model fit to the SED (Honda et al. 2012; Maaskant et al. 2013). In addition, both of the direct images (Honda et al. 2012; Quanz et al. 2013; Osorio et al. 2014) and the model fit to the SED (Honda et al. 2012; Maaskant et al. 2013; Osorio et al. 2014) suggest an inner cavity within the ∼25 au ring. By contrast, the sizes at the shortest two bands (UIR 8.6 and N 8.8) are the smallest and almost the same, much smaller than the ∼25 au ring. This suggests that there is another emission source within the ∼25 au ring. It is probably the innermost disk/halo suggested by the disk model fit to the SED by Honda et al. (2012) and Osorio et al. (2014). The increase of the size in Figure 5 indicates that the contribution from the ∼25 au ring relative to the unresolved innermost disk/halo increases with wavelength. The disk model fit to the SED and the mid-infrared images by Maaskant et al. (2013) provide the model spectra of the unresolved innermost disk/halo and the inner wall of the middle disk (the outer disk, in their expression). Their result suggests that the contribution from the innermost disk/halo is dominant at ≲9 μm, while the contribution from the inner wall of the middle disk is dominant at ≳9 μm. Thus, the derived sizes and wavelength dependence here agree well with their model.
5.2. A Model with a Central Point Source and a Ring
We made a simple two-dimensional model composed of a point-like central emission and circular ring emission at a radius of 0170 (25 au at 145 pc) from the central star. The ring is assumed to have an unresolvable narrow width and a constant brightness distribution. The HD 169142 disk is inclined by 13° at a disk PA of 5° (Raman et al. 2006). This inclination angle makes only a 2.6%, or 0004, decrease of the projected radius in the direction of PA = 5° for the intrinsically circular ring, which is much smaller than the HWHM of the PSF. In addition, the near-infrared scattered light image shows an offset of the disk center from the stellar position (Quanz et al. 2013; Momose et al. 2015), which is also much smaller than the HWHM of the PSF. Thus, we assumed that the projected ring shape is a circular ring.
We changed the flux ratio of the integrated ring to the central source, F, convolved the brightness distribution of the model disk with the PSF, and compared the azimuthally averaged radial intensity profiles between the models and the observations. The HWHM from the model profile must match that of the observed profile. For the PSFs, we used those shown in Figure 2, where the direction of the telescope structure is the same as that of the HD 169142 images. Figure 3 shows the model profiles with the best-fit F values (blue dashed lines), and Figure 6 shows the images of the model disk. The obtained model profiles agree well with the observed profiles at the central region (≲03 or  au). However, the brightness distribution of the model images at fainter levels is less extended than that of the observed images and is relatively similar to that of the PSF images. The observed 10 μm region emission is likely to have more extended components. This is supported by the fact that the azimuthally averaged radial profiles of the observed images are significantly brighter than that of the model at ≳03 or ≳40 au.

Figure 6. Model disk images convolved with the PSFs for a 325 × 325 area centered on the central star. North is up. The contours are plotted for levels of peak  , where
  and
and  . The band name is shown in each panel.
Download figure:
Standard image High-resolution imageThe observed emission from HD 169142 must contain residual emission that cannot be accounted for by the above model. To estimate the residual emission, we subtracted the model image from the observed image. Since our model has only the ring-to-center flux ratio as a parameter, we have to fix the total flux of the model. If we assume that the central region is within a radius of  , where D = 8.2 m is the entrance pupil diameter of the telescope, then the residual emission should not become a negative value; however, some negative pixels are expected due to the noise of the observed image. We fixed the contribution from the model as follows.
First, the total flux of the model image was set to that of the observed image. We then calculated the mean value and the standard deviation  within a sky region in the observed image. This sky region was the same area as that for the previous photometric calibration. Then we subtracted the mean sky value from the observed image and counted the number of negative pixels (N0) in the sky region. We also counted the number of pixels whose value was less than
  (N1). We subtracted the model image multiplied by a factor α from the observed image and counted the number of pixels with negative values (M0) and the number of pixels less than
  (M1). Then we estimated α to satisfy
  . The obtained values of α are 0.913, 0.924, 0.919, 0.945, 0.936, and 0.934 for UIR 8.6, N 8.8, N 10.5, UIR 11.2, N 11.7, and N 12.5, respectively.
Table 4 lists the decomposed flux of each source, and the spectra of each source are shown in Figure 7. Except for the stellar photospheric emission estimated from the SED model fit (Maaskant et al. 2013), the central source has the bluest spectrum, possibly associated with PAH emission at the 11.2 μm band. The flux ratios of the N 10.5 and 12.5 bands suggest a color temperature of each component, since these two bands contain little or only weak PAH emission and are dominated by the continuum emission. The derived ratio for the central component is 2.1 ± 0.18, which is higher than expected for blackbody radiation of the dust sublimation temperature (∼1500 K); however, the ratio of the average minus 2σ is 1.74, corresponding to the temperature of 1100 K. This is within the range of the estimated temperature of the inner wall of the inner disk at 0.2–0.5 au in the SED model fit by Osorio et al. (2014). The ratio of the two bands for the 25 au ring is 0.909 ± 0.079, and the corresponding temperature is 228(−23 + 21) K. The temperature of the inner edge of the middle disk estimated by Honda et al. (2012) is 180 K, and this corresponds to the temperature of the average minus 2σ value. Our result suggests that it is much warmer than 110 K at the corresponding area called "the outer wall of the inner gap" by Osorio et al. (2014).

Figure 7. Spectra of the central unresolved emission, the r = 25 au ring emission, the west source, and the stellar component.
Download figure:
Standard image High-resolution imageTable 4. Decomposed Fluxes of Each Component
| Filter | Wavelength | Flux [10−19 W cm−2 m−1] | ||||
|---|---|---|---|---|---|---|
| (μm) | Total | Stellar Photosphere | Central Component | Ring at r = 25 au | West Source | |
| UIR 8.6 | 8.59 | 87.4 ± 1.6 | 2.6 | 32.3 ± 0.6 | 44 ± 0.8 | 5.7 ± 0.11 |
| N 8.8 | 8.75 | 77.9 ± 2.3 | 2.4 | 30.0 ± 0.9 | 40 ± 1.2 | 4.3 ± 0.13 |
| N 10.5 | 10.49 | 39.3 ± 2.5 | 1.1 | 9.2 ± 0.6 | 25 ± 1.6 | 2.3 ± 0.15 |
| UIR 11.2 | 11.24 | 64.0 ± 1.8 | 0.90 | 9.9 ± 0.3 | 41 ± 1.2 | 2.4 ± 0.07 |
| N 11.7 | 11.74 | 52.9 ± 1.6 | 0.74 | 7.4 ± 0.2 | 33 ± 1.0 | 2.1 ± 0.06 |
| N 12.5 | 12.39 | 46.3 ± 2.7 | 0.60 | 4.3 ± 0.3 | 28 ± 1.6 | 1.9 ± 0.11 |
Download table as: ASCIITypeset image
The origin of the PAH emission from the HAEBEs is still unclear. It is often thought that PAH emission arises from the disk atmosphere and that its emitting region has a larger radius than that of the continuum at the same wavelength in models (Dullemond & Dominik 2004). This is also suggested by observations (Lagage et al. 2006). Figure 7 shows that PAH emission at the 11.2 and ∼8 μm wavelength regions is seen for both the central source and the 25 au ring. For the 11.2 μm band, we do not see a significant difference in the feature-to-continuum ratio between the central source and the 25 au ring. The difference in  between the narrowband and wideband filters (UIR 8.6 and N 8.8; UIR 11.2 and N 11.7) should indicate the size difference between the PAH emission (at the 8.6 and 11.2 μm bands) and the continuum emission at the same wavelength. There is no clear difference in
  in Figure 5.
5.3. Residual Components after Model Subtraction
The obtained residual images after model subtraction with a multiplying factor α are shown in Figure 8. In all of the filter bands, we noticed that there clearly remains an arc-like emission in the east of the stellar position and a bright knot slightly shifted to the west of the stellar position but still inside the 25 au ring. Since these structures are very consistent for all of the filter bands, we considered them as real emission structures.
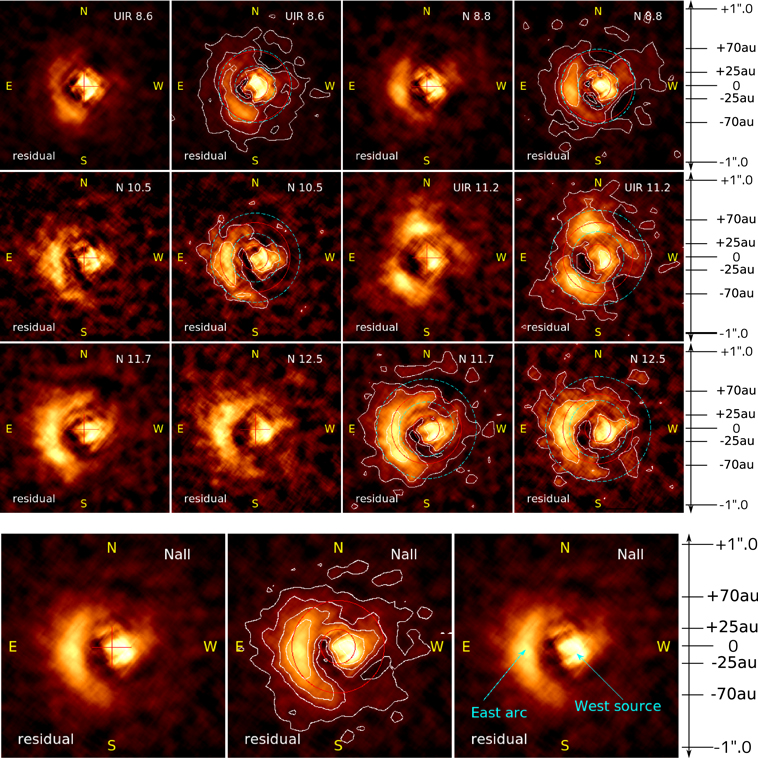
Figure 8. Residual images after model subtraction from the observed images. Each panel shows a 221 × 221 area centered on the central star. The band name is shown in each panel. The position of the central star is shown by the red crosses. The red circles show r = 25 au (017) and r = 66 au (0455) rings centered on the central star. The cyan circles show the first and second dark diffraction rings at each wavelength. The contours are drawn for (3, 6, 12, 24, 48, ...) × σsky levels of the residual images. The bottom three panels show the average of the residual images for the N 8.8, 10.5, 11.7, and 12.5 bands. The position of the central star, the red circles showing r = 25 and 66 au with the contours, and the position of the east arc and west source are also shown.
Download figure:
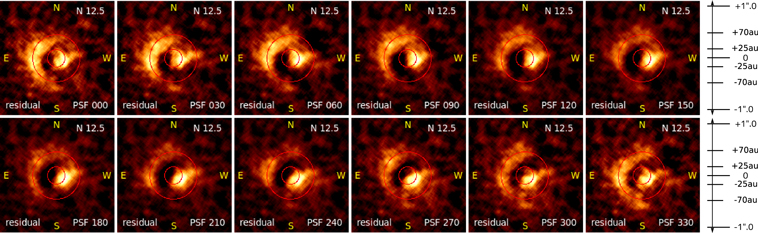
Standard image High-resolution imageTo check whether these residual features are real or are artificial structures caused by fluctuation or instability of the PSF, we made model images convolved with intentionally rotated PSFs and subtracted them from the observed images. The obtained residual images at the N 12.5 band are shown in Figure 9 as an example. Even when we use the rotated PSFs, the west knot is seen in all of the images. About the east arc, although the azimuthal position changes a little for the rotated PSFs, it always appears in the east part. These residual images are slightly affected by the change of the PSF of the UIR 8.6 and 11.2 bands. In these two filter bands, the PSFs are distorted from a circular shape and show more ellipsoidal shapes. Thus, the positions of the bright spots in the residual images are not reliable in these two bands. Such a difference in the PSF shape is caused by the filter position in the COMICS. The UIR 8.6 and 11.2 filters are located at the pupil in the fore-optics with a slightly tilted angle, while the other four filters are located in converging light just in front of the imaging detector array. In the other four bands (N 8.8, 10.5, 11.7, and 12.5), the PSF is circular and the residual images are not affected by it. Therefore, we used these four bands to estimate the positions of the sources in the residual images.
Figure 9. Residual images after subtraction of 90% of the fitted model from the observed images. Each panel shows a 221 × 221 area centered on the peak position of HD 169142. The PSF used to make the model image was rotated by 0°, 30°, 60°, 90°, 120°, 150°, 180°, 210°, 240°, 270°, 300°, and 330° in the counterclockwise direction, and the rotation angle is shown in each panel.
Download figure:
Standard image High-resolution image
5.3.1. The West Source
The size of the west knot in Figure 8 agrees with that of the PSF. We fitted the center position and the peak intensity of the PSF to the knot within the HWHM of the PSF. Because the radial intensity profile of the knot agrees with that of the PSF within the HWHM, the knot is a point-like source within the spatial resolution of the observation. We call it the west source.
The position of the west source is almost the same for all filter bands. The source is shifted by 0116 ± 0020 (corresponding to 17.0 ± 2.9 au at 145 pc) from the emission peak (corresponding to the stellar position) in the direction of PA = 260° ± 5°. These values were derived from the N 8.8, 10.5, 11.7, and 12.5 band images as their average and standard deviations of the position.
The flux of the west source was estimated from the total flux of the PSF after the fitting and is only 5%–7% of a sum of the main component. Thus, it could not affect the peak search in our image reduction using shifting and adding. The flux of the west source is listed in Table 4 and plotted in Figure 7. The flux is larger than the estimated stellar flux but much smaller than those of the main components (the central component and the 25 au ring). The spectrum of the west source is redder than the central component and bluer than the 25 au ring. The N 10.5/N 12.5 flux ratio is 1.21 ± 0.10, which corresponds to 330 (+60 −40) K. The west source shows the PAH emission at the 11.2 and ∼8 μm wavelength region. Its 11.2 μm feature-to-continuum ratio is similar to that of the main components. When we assume that the west source is a sphere (or circle) with radius Rmin emitting as a blackbody, the observed flux corresponds to  , where Rj is Jupiter's radius. This corresponds to the minimum emitting area. The west source should not be a blackbody, since it has PAH emission (Figure 7); thus, the real emitting area would be larger.
The west source is not likely to be a background source overlapping by chance, but it must be a structure physically associated with the HD 169142 system. This is supported by the fact that the estimated color temperature is between that of the central component and the 25 au ring. Also, the spectrum of the west source tentatively shows PAH features at 8.6 and 11.2 μm. This feature-to-continuum ratio is intermediate between those of the central component and the ring. The orbital motion can be estimated from the observed position. When we assume a circular orbit with radius 17.0 au and 2.28  as the mass of the central star, the orbital period of the west source is derived as 46.4 yr. By contrast, the proper motion of HD 169142 is listed as −00021 ± 00015 yr−1 in R.A. and −00402 ± 00015 yr−1 in decl. in the SIMBAD database9
based on the Tycho-2 catalog (Høg et al. 2000). Thus, we are able to exclude the possibility of a background source and confirm that the west source physically associates with HD 169142 by additional 10 μm observations at a different epoch separated by about a decade. We are planning observations for confirmation in the near future.
as the mass of the central star, the orbital period of the west source is derived as 46.4 yr. By contrast, the proper motion of HD 169142 is listed as −00021 ± 00015 yr−1 in R.A. and −00402 ± 00015 yr−1 in decl. in the SIMBAD database9
based on the Tycho-2 catalog (Høg et al. 2000). Thus, we are able to exclude the possibility of a background source and confirm that the west source physically associates with HD 169142 by additional 10 μm observations at a different epoch separated by about a decade. We are planning observations for confirmation in the near future.
Reggiani et al. (2014) found an L'-band source in the cavity inside the ∼25 au rim with 2013 June 28 (UT) observations. It was located at  north of the host star (PA = 74 ± 113) and had a brightness of
  mag. Biller et al. (2014) independently found an L'-band point-like source at a separation of r = 011 ± 003 and PA = 0° ± 14° from the stellar position with 2013 July 14 (UT) observations. These L'-band sources are likely to agree with each other in their positional errors. The 0156 and 011 correspond to 22.6 and 16.0 au at 145 pc, respectively. The overlapping range of their derived positions is 0124–014, which corresponds to 18.0–20.3 au. The PA of the west source differs from that of the L'-band source by about 100°. If the west source has a circular orbit with an orbital period of 46.4 yr, then it only rotates 47° between the two epochs of our observations and in the L'-band. Thus, the west source in the 10 μm region seems to be different from the L'-band source. From the proper motion of HD 169142, the possibility that the west source and the L'-band source are the same background source is also excluded.
The west source is too close to be detected in the near-infrared coronagraphic observations. It is shifted from the center about 01, and the near-infrared coronagraphic observations have a slightly larger obscuring area around the central source. The H-band coronagraph images by Quanz et al. (2013) and Momose et al. (2015) probe as close as ∼01 and 02 to the star, respectively.
The west source in the N-band is the innermost structure detected, except for the innermost disk/halo. The disk of HD 169142 has a complicated structure with multiple disks, cavities/gaps, and point-like sources, including the west source, the L'-band source, and the 7 mm knot (see Figure 1). The model fit to the SED (Maaskant et al. 2013) and the 7 mm observations (Osorio et al. 2014) showed that the inner region has a cavity between the innermost disk/halo (at r = 0.1–0.2 au in Maaskant et al. 2013 and 0.5–0.6 au in Osorio et al. 2014) and the middle disk starting at ∼25 au. The cavity, where dust is depleted, is extended in radius (∼1–25 au). The complicated structure of HD 169142 could be explained by multiple planet formation in the disk (Biller et al. 2014; Osorio et al. 2014; Reggiani et al. 2014). The west source might be related to cavity formation, together with the L'-band source. The west source might be a disk structure related to planet formation, such as a circumplanetary disk or clumpy disk structure created by forming planets.
5.3.2. The East Arc
In all of the images in the N-band of Figure 8, where the main components are subtracted, an arc-like structure at r ∼ 04 is seen on the east side. At the same radius, faint emission is seen at all azimuthal directions. The bright position of the east arc is similar in each of the four bands (N 8.8, 10.5, 11.7, and 12.5).
From modeling of the H-band radial intensity profile, Momose et al. (2015) found that the disk surface density starts to increase outward at the radius where the H-band brightness profile starts to increase. They called this region the transition zone (TZ). The TZ is extended to slightly outside of the H-band brightness peak. According to Momose et al. (2015), the TZ extends over r = 52–81 au (from annular gap to outer disk in Figure 1). Outside of that, a radial dependence of the surface density typical for a continuous disk was detected.
The peak positions of the N 8.8 and 10.5 bands are located inside of the peak position of the H-band modulated polarization intensity (PI) image, whereas those of the N 11.7 and 12.5 bands are similar to the peak position in the H-band image (see Figures 4(b) and 7(b) of Momose et al. 2015). Thus, the peak positions of the east arc at the observed bands correspond to the TZ, and, within the TZ, the peak position shifts further away from the central source at longer wavelengths. This suggests that the emission is likely to be thermal emission rather than scattered light. Combining the fact that it is not resolved radially, the east arc is likely the inner wall or the edge of the outer disk heated by stellar irradiation. In contrast, the H-band emission, whose origin is the scattered light, comes from the wall and surface of the outer disk out to a relatively large radius.
Momose et al. (2015) thought that the east part is the near side of the outer disk because the azimuthal brightness distributions in the H-band tend to have maxima on the east side, which is explained by the forward scattering. Considering a simple structure, the edge of the outer disk on the far side is more easily and widely seen by us. In the N-band, where thermal emission is dominated, the far side of the disk is brighter than the near side whereas in the H-band the near side is brighter by forward scattering. Then the brighter side in the N-band and that in the H-band is opposite as in the case for HD 142527 suggested by Fujiwara et al. (2006) and Fukagawa et al. (2006). In the case of HD 169142, the brighter side is the same in both the H-band and the N-band. There are several possibilities for interpreting this result.
First, the west part of the disk is the near side, and the edge on the east side is observed in thermal emission in the N-band. But an asymmetric distribution of the matter in the disk atmosphere might cause brighter scattered light in the east part. Scattered light is more sensitive to corrugation at the disk surface compared with the thermal emission. Alternatively, the inner wall or edge of the outer disk is more irradiated on the east side than the west side. Such a condition might be formed by asymmetry in the structure inside of the outer disk. If the inner and/or middle disk is misaligned with the outer disk, or if the disk flaring varies along the azimuthal direction and the shadowing effect is different along with the azimuthal direction, then the irradiation of the outer disk by the central star would vary azimuthally. This would produce an asymmetry of the intensity distribution that becomes similar for both the H-band and the N-band.
6. Conclusions
We imaged the Herbig Ae star HD 169142 in the N-band with six filter bands (N 8.8, 10.5, 11.7, and 12.5 and UIR 8.6 and 11.2) and performed spectroscopy in the 10 μm region with Subaru/COMICS. The emission in the N-band is spatially resolved at all the observed bands and shows the continuum and PAH-band emissions. The flux in the N-band is much larger than the stellar photospheric emission and thus is mostly from the disk. The extended emission at the central region is well explained by a combination of the point-like central emission (corresponding to the innermost disk/halo close to the star at r ≲ 1 au) and the r ∼ 25 au ring (corresponding to the inner wall or edge of the middle disk starting at the radius). The flux is more dominated by the 25 au ring at longer wavelengths, which is consistent with the model fit to the SED and the 20 μm images by Maaskant et al. (2013).
By subtracting the main components (the 25 au ring and the central point-like emission), there remains residual emission with additional structures. The residual images show a west point-like source separated by 17.0 ± 2.9 au in the direction of PA = 260° ± 5° from the original emission peak (i.e., stellar position) and a bright east arc located at r ∼ 60 au. The west source is located between the central point-like source and the 25 au ring, which is consistent with the color temperature. It is considered to be a different source from the L'-band unresolved source found by Reggiani et al. (2014) and Biller et al. (2014) and, therefore, the innermost structure in the HD 169142 disk, except for the innermost disk/halo at r ≲ 1 au. It might be a structure related to planet formation in the disk, such as a circumplanetary disk or clumpy disk structure created by planet formation. In the HD 169142 disk, three planets might be being formed, as suggested by the presence of the L'-band source, the 7 mm knot, and the 10 μm region west source.
The east arc corresponds to the transition zone seen in the modulated PI image in the H-band shown by Momose et al. (2015). This is considered to be the inner wall or edge of the outer disk. The outer disk and its edge are brighter on the east side in the H- and N-band regions, respectively. It cannot be explained by a configuration in which the disk is closer to us on the east side. The west side of the disk might be near us, and bright scatted light in the H-band might be accounted for by the different material distribution in the disk atmosphere between the west and east sides of the outer disk. Alternatively, the east side of the outer disk is more irradiated by the stellar flux due to the asymmetric structure inside the disk.
We would like to thank all of the staff members of the Subaru Telescope for their support during the observations and development of the instrument. Y.K.O. was supported by KAKENHI 23103004. H.F. is supported by KAKENHI 07J02823 and 26800110.
Footnotes
- ∗
Based on data collected at the Subaru Telescope, which is operated by the National Astronomical Observatory of Japan.
- 9