
Abstract
While numerous gait families have been defined and studied for legged systems traversing level ground (e.g. walking, running, bounding, etc), formal distinctions have yet to be developed for dynamic gaits in the vertical regime. Recognition and understanding of different gait families has clear implications to control strategy, efficiency, and stability. While several climbing robotic systems have been described as achieving 'running' behaviors on vertical surfaces, the question of whether distinct dynamic gaits exist and what differentiates these gaits has not been rigorously explored. In this paper, by applying definitions developed in the horizontal regime to simulation and experimental data, we show evidence of three distinct dynamic climbing gaits families and discuss the implications of these gaits on the development of more advanced climbing robots.
Export citation and abstract BibTeX RIS
1. Introduction
Legged animals demonstrate the remarkable capacity to rapidly and reliably traverse unstructured terrain, both in the horizontal and vertical domains. One of the means by which they do so is by employing distinct gaits suited for the given task and terrain. For example, horses and dogs have been shown to use walking, trotting, and galloping gaits, among others, and will switch between these gaits depending on speed and changes in terrain. In the classical study of bipedal legged locomotion on level ground, dynamic gaits are often classified as either 'walking' or 'running'.
Gait selection has implications for more than just speed, as the possible control approaches, in addition to the associated stability and efficiency, are greatly impacted by the gait. While the difference between these gaits can often be qualitatively identified through visual observation (such as the presence of a flight phase), more quantitatively grounded metrics can be (and often are) used as well, including shape factor [1], Froude number [1], and phasing between kinetic and gravitational potential energy [2]. For bipeds in the horizontal domain, the most common gaits, walking and running, have been historically described with unique dynamic models: the ballistic motion model for dynamic walking [3–5] and the spring loaded inverted pendulum (SLIP) model for dynamic running [6, 7].
These and other models have informed the physical design and control approaches of numerous robotic platforms. These include quasi-static walkers, which leverage complex control strategies to stand and move, allowing for the implementation of varied and complex tasks, but with limited locomotion efficiency and limited dynamic performance [8, 9]. Platforms based on the ballistic model, such as passive dynamic walkers, require minimal energy addition and body control to walk, but are generally restricted to walking motions and often have a limited ability to recovery from perturbations [10]. SLIP-like running platforms, which range from single legged hoppers [11, 12] to multi-legged platforms with 3+ degrees of freedom per leg [13–16], have demonstrated dynamic running modalities. It has more recently been shown that both walking and running behaviors can be exhibited by a single compliant bipedal model [17], which robots like ATRIAS utilize to instantiate both gaits [18].
Similarly, a range of strategies have been applied to climbing robotic systems, as there have been numerous quasi-static climbers, which navigate the challenges of climbing by finding attachment points and carefully placing the foot to maintain attachment [19–21], some of which are flexible enough to climb non-planar, real world surfaces [21]. The planar yaw dynamics of geckos and cockroaches rapidly running up walls has been captured by the Full-Goldman (FG) model [22], shown in figure 2(a), and has lead to the development of dynamic climbing platforms which can approach the performance of biological analogs on planar vertical surfaces in terms of speed and efficiency [23, 24].
While extensive study has been focused on characterizing gaits for level-ground locomotion, little rigor has been applied to gait classification for dynamic climbing, and rapid vertical motions are often described as 'running' without applying any quantitative metrics for support. In this paper1, we examine different gait families that can emerge from a simplified dynamic climbing model and the characteristics, both qualitative and quantitative, of these gaits. We demonstrate the presence of distinct walking and running regimes in this dynamic climbing model. Additionally, we discuss the differences in these climbing modalities with respect to the analogous horizontal domain gaits and address the implications of these findings on the design and control of climbing robots. We show that distinct dynamic gaits can be exhibited by a robot instantiating FG climbing. Using a new robotic platform, BOB 2.0 (figure 1(a)), we demonstrate that the predicted gaits can be realized on a physical system and show the relationship between gait families and climbing frequencies. The similarities and differences between the theoretical and experimental performance characteristics are described and shown to more closely match a modification of the FG model that includes damping. Finally, the implication of how damping impacts FG climbing and how its impact on gaits can be utilized to enable faster, more robust performance is discussed.
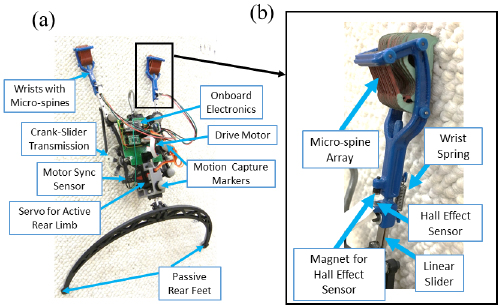
Figure 1. (a) The miniature bipedal dynamic climbing platform, BOB 2.0. A single actuator at the center of the platform drives both gears, which are physically locked 180° out of phase to move the linear guide rails. (b) A single front foot of BOB 2.0, showing the micro-spine array which enables attachment on surfaces such as cinder-block and the Hall-Effect base wrist force sensor.
Download figure:
Standard image High-resolution image2. Reduced order modeling
2.1. Full-Goldman (FG) template
Although many climbing models exist [26–28], this study will focus on the Full-Goldman climbing template. The FG template emerged from observations of the similarities in locomotion dynamics of cockroaches and geckos rapidly scaling vertical surfaces. While these animals have distinctly different limb morphologies and footfall patterns, the ground reaction force and velocity profiles were qualitatively similar. The template captures these patterns with a simple model consisting of a distributed body mass and two springy legs. This model, because of its 2 limbed nature, has the potential to represent a range of distinct gait behavior, as has been done with the spring loaded inverted pendulum model [17].
The FG model has been shown to not only instantiate the dynamics of biological systems climbing, but also captures the dynamics of a series of dynamic climbing platforms, ranging from the fastest legged climbing robot achieving 65 cm s−1, the bipedal Dyno-Climber [23], to the multi-modal quadruped SCARAB [29]. A dynamically similar version of Dyno-Climber, the Bipedal Oscillating roBot (BOB) which has achieved 1.95 body lengths per second (BL s−1), will be used to define the physical scale for this study and enable direct experimental comparison.
2.2. Distinct climbing models
The reduced order template [22] of the originally developed FG model, the pendular dynamic climbing model which is shown in figure 2(a), maintains the two linearly actuated, springy limbs set at a fixed angular offset. Attachment is treated as a pin joint while engaged on the surfaces, so with a single leg engaged, the system behaves as a springy pendulum with the rest length of the spring nominally reduced during stance. The free unattached leg is extended at the same time until it attaches to the surface, causing the previously attached leg to detach and the cycle to repeat. Unlike the traditional FG model which consists of a distributed body mass, the pendular dynamic model consists of a point mass at which the spring legs are attached.
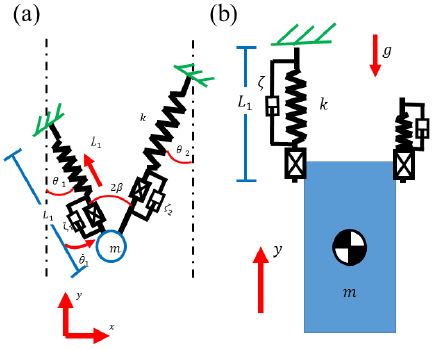
Figure 2. (a) The pendular dynamic climbing model, based on the Full-Goldman template, consists of two legs at a fixed angular offset ( ). Unlike previous FG based modeling, this model directly includes linear viscous damping along the limbs. (b) The one dimensional reduction of the pendular dynamic climbing model which restricts motion to strictly vertical. © 2016 IEEE. Reprinted, with permission, from [25].
Download figure:
Standard image High-resolution imageA further reduction of the climbing model was implemented, which restricted the dynamics to the 1D vertical regime, similar to the formulation by Clark and Koditschek [28]. The pendular dynamics were constrained by setting the fixed angular offset of the springy arms to zero and by defining the attachment to behave as a rigid joint instead of a pin joint, thereby absorbing any angular perturbations. This special case of the pendular dynamic model isolates the vertical dynamics from the rotational dynamics of the full system, allowing the mechanisms of various dynamics to be studied.
The modeling used in this study is distinct from previous studies of Full-Goldman climbing dynamics by implementing the concept of state-based attachment approach (i.e. directional adhesion), rather than a timing based approach. This approach should result in a more realistic model of attachment/detachment than previously implemented timing-based approaches.
2.3. Equations of motion (EOMs)
The EOMs, shown in equations (1) and (2), were derived with respect to the global Cartesian coordinate frame, similar to the formulation of the bipedal compliant leg model created by Geyer et al [17]
where X and Y are the globally defined Cartesian coordinates of the center of mass (COM), m, k, and b are the physical parameters of the system (mass, spring stiffness, and linear viscous damping respectively), L1 and L2 are the lengths and  and
and  are the current angles of the left and right leg respectively,
  and
and  are the rest lengths of the left and right legs, and Leg1 and Leg2 are flags representing the attachment state of the left and right leg respectively.
Defining the equations of motion within the global frame simplifies the description of the second stance leg during double support phases. While Cartesian coordinates simplify the state transitions, the switching conditions, system forces and leg states are all more intuitively expressed in polar coordinates. As such, state information in Cartesian space, (X and Y) was converted to the polar representation, L and θ of each individual leg, using the mapping described by equations (3) and (4), which requires the Cartesian coordinate of each foot ( and
and  ).
).
To achieve climbing in the model (even without friction losses), energy addition is required to achieve the gain in potential energy inherent to climbing. For this study, the actuation utilized in previous studies [23], which fixes the limbs at 180° out of phase, will be implemented since it results in a single equation defining the current desired position of each leg, shown in equation (5)
where Lnom is the nominal and minimum length of the leg, Lstroke is the stroke length of the legs, and Ω is the driving frequency of the actuation. This actuation model was additionally chosen since it matches the actuation on the experimental platform described in section 3.1.
2.4. Switching conditions
The condition required for a specific foot to change states are shown below. The foot remains engaged to a surface as long as there is force within the leg:

and immediately detaches if Fleg < = 0.
The foot remains in flight as long as the foot is moving upward, and adheres to the surface if:

where  is the velocity of the foot along the leg axis, which can be determined as:

where β is the sprawl angle, and  is the rate of extension(+)/retraction(−) of the leg as dictated by the controller.
By using these switching conditions which encode directional adhesion, there are four distinct states the simulation can reach. These are flight, where neither foot is attached to the surface, right stance and left stance, where a single foot is attached, and double stance, where both feet are attached. Additionally, these states could be repeated in any order to create a system cycle. For this paper, we restrict the gaits to period one gaits, shown in figure 3, which have been experimentally observed.

Figure 3. (a) Shows the phase changes which occurs for gaits with a flight phase. The system starts with a single attachment then completely detaches from the surface before the second limb attaches. (b) Shows the phase changes which occur for gaits with a double support phase. The system starts in single support, then the second limb attaches before the first limb has reached the conditions for detachment. © 2016 IEEE. Reprinted, with permission, from [25].
Download figure:
Standard image High-resolution image2.5. Simulation parameters
The initial simulation work used parameters which were selected based on the physical parameters of BOB, which provided the stiffness, the leg length and stroke length, sprawl angle, and realistic bounds for the achievable range of driving frequencies. Since the first goal is to identify and understand the fundamentals of the gait dynamics, the most conservative form of the simulation (with damping set to zero) was utilized. After this initial study, the simulation fidelity was improved by using parameters based on the physical properties of BOB 2.0, described in section 3.1, given in table 1. Because BOB 2.0 is a new platform, the leg parameters were measured under static loading conditions, which resulted in an estimated spring stiffness of  and a damping ratio of 0.17. To account for passive variations during running, a range of spring stiffnesses were tested ranging from
  which is the spring stiffness when a few toes (described in section 3.1) are engaged to
  when all the toes are engaged. A wide range of damping was investigated to explore the impact of frictional losses on the fundamental dynamic climbing behavior.
Table 1. Parameter settings for climbing sweeps.
| Parameter | Description | Value |
|---|---|---|
| g | Gravitational constant | 9.81 ms−2 |
| i | Leg identifier | [0 or 1] |
| Legi | Flag for attachment of Leg i | [0 or 1] |
| Lnom | Nominal length of Leg | 0.2 m |
| Lstroke | Stroke length of Leg | 0.05 m |
| k | Spring stiffness of Leg spring | 130, 200–400 Nm−1 |
| β | Sprawl angle | 20  |
| b | Damping ratio | 0– |
| m | Body mass |  |
| Ω | Driving frequency | 1– |
For the range of values given in table 1, Newton–Raphson fixed-point searches were implemented to determine steady state behavior of the system. Once fixed points were determined, efficiency, ground reaction forces, climbing velocity, duty factor, effective stroke length (distance between foot placements in direction of travel), and the phasing between kinetic energy and gravitational potential energy were determined. Efficiency was determined using the cost of transport definition
where

The phasing between kinetic energy and gravitational potential energy is computed using the definition given by Full and Tu [2].
3. Experimental setup
3.1. Physical platform—BOB 2.0
In order to validate the simulation results in an experimental setting, an updated version of the bipedal oscillating roBot (BOB) [30], named BOB 2.0, was developed. BOB 2.0, shown in figure 1(a), uses a single drive motor (Maxon RE-13 dc motor ( ) with a
  planetary gearhead (Maxon
  )) connected to the front limbs via spur gears (
 ratio) which phase lock the limbs
  out of phase. Although not actively used in this study, BOB 2.0 also has an actuated body degree of freedom (Power HD Low-Profile Digital Servo 1207TG) located on the centerline of the body which nominally acts as a stiff torsional spring, partially regulating out of plane dynamics. In addition to the actuation, the rear limb has been redesigned to more closely resembles point feet and therefore reduces drag on rough surfaces. The front feet use micro-spine arrays [31] which allow for attachment and rapid ascension of real world surfaces, such as stone aggregate and cinder block.
To handle the additional actuation and the sensors described below, new controller electronics were developed. To enable on-board measurement of ground reaction forces (and contact timing), a set of new lightweight front feet with hall-effect based force sensors, shown in figure 1(b), were developed. These sensors were connected to a PJRC Teensy 3.2 development board, which recorded the data onto a microSD card at  as well as executed motor and servo control at
  .
.
3.2. Experimental data capture
Ground contact time and wall reaction force, which allow for duty factor, peak ground reaction force, and ground reaction force profiles to be determined, were measured with the hall-effect based wrist sensor. Sensor calibration was performed in two stages, first comparing displacement and then force accuracy. On a test fixture, a magnet was placed at various distances from hall effect sensor along its centerline. Data were recorded to map the non-linear output from the hall effect sensor magnet displacement measurements. These measurements were validated on the physical platform using high-speed video to record displacement. The results demonstrated that spring deflection could be measured to an accuracy of 0.5 mm. Forces were calculated by estimating the total wall reaction force as the displacement of spring attached at the wrist. Validation was performed with a Gamma ATI six axis force plate mounted to a physically isolated section of the climbing surface.
In order to capture the climbing velocity and effective stroke length, a 6 camera Vicon® motion capture system was used to track center of mass (COM) position at  . This system was set up in front of the climbing walls shown in figure 4, which enables testing on multiple surfaces. While the experiments in this paper are restricted to the carpeted wall in order to reduce the impact of attachment dynamics on the overall body dynamics, this set up will enable exploration of how surface attachment dynamics impact these results.

Figure 4. Experimental surfaces tested. Left is a flat vertical carpeted wall. Real world surfaces that BOB 2.0 can climb include cinder block (center) and stone aggregate (right).
Download figure:
Standard image High-resolution imageExperimental results were compiled from a set of randomized experiments (chosen to minimize the impact of system wear) on a carpeted wall at 9 distinct driving frequencies (with 3 runs per parameter set) ranging from the minimum of  to the maximum achievable on BOB 2.0 of
  . Since this study aims to understand the dynamics of various steady state climbing gait families, transient behaviors encountered during initial ramp up as well as due to disturbances (e.g. missed steps) were omitted from the analysis.
4. Classification of distinct climbing gaits—simulation results
4.1. Identification of distinct COM trajectories
Within bipedal locomotion in the horizontal regime, walking verse running gaits exhibit very distinct COM trajectories and duty factors, with running typically occurring for gaits with a duty factor below 0.5 (i.e. flight phases) and walking gaits occurring at duty factors over 0.5 (i.e. double support phases). Thus the COM trajectories (shown as the vertical COM position versus stride percentage) for the 1D and 2D models are directly compared in figure 5 at several distinct driving frequencies (1.5, 2.0, and  ), by examining the phasing patterns. Examining the types of phasing patterns which are exhibited at distinct frequencies enables potential gait families to be identified.
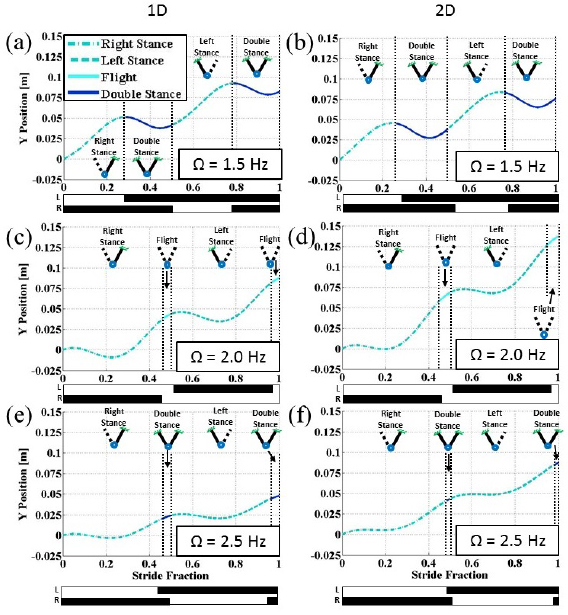
Figure 5. Set of trajectories from both the 1D (shown on the left) and 2D (shown on the right) simulation at discrete frequencies. The top row, (a) and (b) shows the simulation at 1.5 Hz which results in a double stance flow. Increasing the frequency to 2.0 Hz, (c) and (d) results in a flight flow. Then, running the simulation at 2.5 Hz, (e) and (f) results in a double stance flow. © 2016 IEEE. Reprinted, with permission, from [25].
Download figure:
Standard image High-resolution imageComparing the left column with the 1D results with the 2D results shown in the right column, the behavior at each frequency is qualitative similar. The  gaits, shown in figures 5(a) and (b), both exhibit a double support phase, with actuator loading occurring during the double support phase. The
  gaits, shown in figures 5(c) and (d), both exhibit a flight phase, with loading occurring during the single support phase. The highest frequency (
 ), has a double support phase which entirely occurs while the body is moving upward, as shown in figures 5(e) and (f), thus loading occurs during the single support phase. It also has a shorter stroke length than intermediate frequency gaits as seen from the total height gained over the course of a stride.
An examination of figure 5 shows three distinct families of trajectories. At low frequencies, double stance gaits arise with the loading of the legs springs occurring during double stance. At intermediate frequencies, flight phases exist with loading occurring during single support. At higher frequencies, double stance gaits exist with loading occurring during single support. This suggests there are at least three different gait behaviors that can be exhibited by dynamically climbing systems; however, the presence of double stance gaits at driving frequencies higher than the flight gaits suggests that duty factor and COM motion are not sufficient to fully characterize and classify these gaits.
4.2. Classification of gaits
In order to understand and classify these gait patterns, we employ additional, quantitative definitions of gaits. The first definition considered involves the shape of the ground reaction force profiles. In the horizontal regime, dynamic walking gaits have ground reaction force profiles, over the course of a step, which have a symmetric double peak, while running gaits have a single peak during the course of a step [1]. The second definition utilized will be the relative phasing of the peak kinetic energy and gravitational potential energy. In horizontal locomotion, the kinetic and gravitational potential energy are in phase for running gaits, and are 180 degrees out of phase for walking gaits [2].
4.2.1. Ground reaction force comparison
The ground reaction force profiles for each of the trajectories described previously are shown in figure 6. As with the vertical trajectories, the qualitative behavior of the 1D and 2D systems were the same. However, the magnitudes of the vertical ground reaction forces are consistently higher for the 2D model, which can be explained by the increased energy stored in the system from the pendular motion which increases the load on the feet.

Figure 6. Set of ground reaction force profiles from both the 1D (shown on the left) and 2D (shown on the right) simulation at discrete frequencies. The top row, (a) and (b) shows the simulation at 1.5 Hz which results in a profile with a double peak. Increasing the frequency to 2.0 Hz, (c) and (d) results in a single. Then, running the simulation at 2.5 Hz, (e) and (f) also results in a single peak, but has a double support phase. © 2016 IEEE. Reprinted, with permission, from [25].
Download figure:
Standard image High-resolution imageThe gait at 1.5 Hz, the lowest driving frequency shown, has a ground reaction force pattern that has 2 peaks over the course of a step, as seen in figures 6(a) and (b). For this gait, the highest total ground reaction force occurs during a double stance phase. The gait at 2.0 Hz has a ground reaction force pattern, shown in figures 6(c) and (d), which only has a single peak over the course of a step. While the gait at 2.5 Hz has no flight phase and has a double stance phase, it also has a single peak in the ground reaction force pattern, shown in figures 6(e) and (f).
The low frequencies gaits, including  , appear to correspond to dynamic walking in the horizontal domain, which occur at lower driving frequencies, have a double support phase, and the loading for the next step occurs during double support phases. The moderate frequency gaits, including
  , correspond to a running gait in the horizontal domain. This gait meets the standard definition of running, since it has a flight phase, it occurs at a higher driving frequency than the previously defined walking, and it has a single peak in the ground reaction force pattern. The higher frequency gaits, including
  , have a single peak which suggests that these are running gaits, but the double stance phase is uncommon for bipedal running. The only way a horizontal system experiences this type of gait behavior is in compliant or Groucho running [32].
4.2.2. Energy phasing
The second metric that we examine is the phasing between the peak gravitational potential energy and kinetic energy. Since a climbing system gains gravitational potential energy over the course of a step, the phasing was calculated by examining the variation from the average increase in gravitational potential energy. The results, shown in figure 7, demonstrate a clear difference between the dynamic walking gaits and running gaits in the 2D system, where the dynamic walking gaits' peak kinetic energy leads the gravitational potential energy by about 120° while in the running gaits the kinetic energy lags behind the potential energy by about 60°.

Figure 7. The phasing difference between the kinetic energy and gravitational potential energy for the 2D model for a frequency range from 1– . The phasing profiles of the gaits shown previous are also shown and a clear phase shift can be seen, as the walking gait is almost out of phase while the running gaits are almost in phase. © 2016 IEEE. Reprinted, with permission, from [25].
Download figure:
Standard image High-resolution imageWithin the horizontal domain, dynamic walking gaits are defined by the kinetic energy and the potential energy being  out of phase while running gaits are in phase. Within the climbing regime, there is also a
  phase difference, but the phase is shifted 60°.
Consideration of the energy phasing confirms our observations from the ground reaction forces and COM trajectories that dynamic climbing can be classified into 3 distinct gaits. At low frequencies there is a dynamic walking gait with a double hump ground reaction force profile and phasing between kinetic energy and gravitational potential energy close to  out of phase. At moderate frequencies, climbing results in running gaits, with the presence of a flight phase, a single peak in the ground reaction force profile and the kinetic energy and gravitational potential energy being close to in phase. At higher frequencies, gaits are also clearly running based on the ground reaction forces and the phasing between kinetic energy and gravitational potential energy, but the short stroke lengths produce small steps with double support phases resembling Groucho [32], or compliant, running.
Furthermore, figure 7 shows the ranges of stride frequencies that result in each of the 3 gaits. The transition between dynamic walking and flight running is identifiable from the phase shift, and flight running becomes Groucho running when the duty factor equals 0.5, shown by the dashed line on figure 10(b).
5. Classification of distinct climbing gaits—experimental results
In section 4, the presence of distinct gaits was determined by applying several standard dynamic metrics, which included examining the shape of the ground reaction force profile, identifying changes in the gait pattern, and the kinetic verses gravitation potential energy phasing, all of which had been previously applied to horizontal locomotion to define gaits [1, 2]. Here we use BOB to see if these gait classifications (from a 2D model) apply to a physical (3D) robot. To accomplish this, we examine performance metrics such as climbing velocity, duty factor, peak ground reaction forces, and stroke length as a function of driving frequency.
5.1. Experimental results
An examination of the experimental ground reaction force profiles at 1.5, 2.75, and  , shown in figure 8, indicates that at these frequencies there are changes in the robot's dynamic behavior which are consistent with changes in gait. The lowest frequency (
 ) ground reaction force profile, figure 8(a), has a double peak consistent with previously defined walking gaits. As expected with walking, at this frequency, the duty factor is above 0.5 indicating a gait pattern with double support. A single peak ground reaction force profile is present for both the moderate frequency (
 ), figure 8(b), and high frequency (
 ) climbing, figure 8(c). The moderate frequency gait has a duty factor below 0.5 indicating a flight phase which, with the single peak profile, is consistent with flight running. Finally, at the highest frequencies, the duty factor goes above 0.5 again which requires a double support phase consistent with walking in the horizontal regime, but has a single peak in the ground reaction force profiles consistent with running. This corresponds to the previously defined compliant, or Groucho, running [32]. This sequence of gaits is the same as shown in section 4.
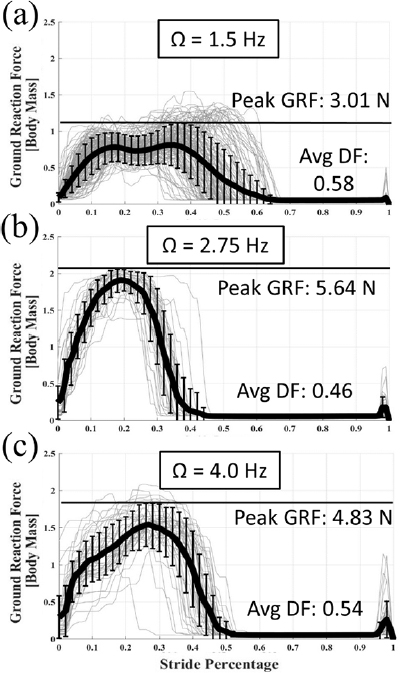
Figure 8. Experimental ground reaction force patterns with standard deviation shown with error bars. (a) An example of a walking gait which has a double peak in the ground reaction forces. (b) An example of a single peak with a duty factor below 0.5 (thus resulting in a flight phase). (c) An example of a single peak with a duty factor over 0.5 (thus resulting in double support). © 2016 IEEE. Reprinted, with permission, from [25].
Download figure:
Standard image High-resolution imageFrom the duty factor and the ground reaction force profiles discussed in section 5.1, the driving frequencies where these gaits exist can be identified. Walking gaits range from  to
to  . The flight running region is from
  to
to  . Finally, the compliant running region occurs for driving frequencies greater than
  . Having identified the gaits, the performance characteristics (duty factor, peak ground reaction force and climbing velocity) of the experimental gaits were determined and are shown in figure 9. For duty factor (figure 9(a)), the experimental trend shows a walking duty factor of around 0.6, followed by a decrease in duty factor where the local minimum under 0.5 is reached, then finally a gradual increase in duty factor into the compliant running regime, which is defined once the duty factor exceeds 0.5. For the peak ground reaction force (figure 9(b)), the lowest peak ground reaction forces occur during walking, a maximum occurs during the flight region, and then the peak ground reaction force decreases with increasing frequency in the complaint running regime. The climbing velocity data (figure 9(c)) appears to be roughly monotonic with a slightly faster increase in velocity during within the flight running region.
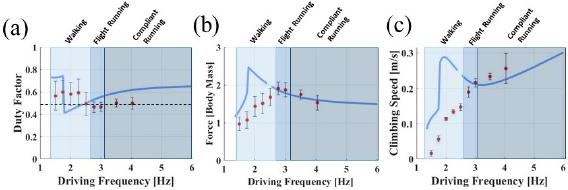
Figure 9. Comparing experimental results with a frictionless simulation as driving frequency is swept with standard deviation shown with error bars. (a) The duty factor highlights the shift in transition point as the transition from walking to running shifts from  (simulation) to
  (experimental). (b) The peak ground reaction force results in both peaking during flight running. (c) The experimental climbing velocity trend appears monotonic while the simulation has a local maximum. © 2016 IEEE. Reprinted, with permission, from [25].
Download figure:
Standard image High-resolution image6. Effect of gaits selection
Having identified the presence of three distinct gaits within vertical climbing, both in simulation and experimentally, the differences of these gaits performance and general gait trends with the comparable horizontal domain counterpart was examined. Since the qualitative behavior of the 1D and 2D models (with only marginal quantitative differences), which are both regulated by spring mass dynamics with the 2D model additionally regulated by pendular dynamics, suggests gait dynamics are primarily defined by the spring mass dynamics. Since both models demonstrate the gait behavior, the 1D model will be utilized for the comparison with the horizontal domain gaits to leverage the most conservative reduced order model, with the qualitative results confirmed on the 2D model (which will be withheld for the sake of brevity). Later, these trends will be examined with the experimental results, with the aim to capture those results within simulation.
6.1. Differences with respect to Horizontal domain
Within the horizontal domain, systems generally experience a monotonic relation between actuation frequency and running velocity [2]. The monotonic relation is replaced in vertical running with a local peak in climbing velocity which occurs at the lowest frequencies of flight running, while the exponential relation near frequency limits is replaced with a linear relation with respect to driving frequency, as shown in figure 10(a). The higher frequency flight running gaits have reduced climbing velocity, with this trend continuing to the compliant running region until a local minima is reached and the linear relation dominates.

Figure 10. Several standard classifications for the horizontal regime applied to vertical domain for the 1D simulation over a range of driving frequencies. (a) Shows the relation of climbing velocity to driving frequency, (b) shows the duty factor versus driving frequency, and (c) shows the stroke length versus driving frequency.
Download figure:
Standard image High-resolution imageThese distinct velocity trends match up with the differences in the stroke length. The effective stroke length while climbing, shown in figure 10(c), is highest at the low frequency flight running gaits, with this stroke length decreasing until a constant value is reached, which corresponds to the location of linear velocity increase. This is a departure for the horizontal domain, where increases in velocity are achieved primarily by increasing the effective stride length, with frequency only changing marginally at high velocities.
The relation between duty factor and driving frequency, which for the horizontal domain decreases monotonically, results in a local minima at the transition to flight running as seen in figure 10(b). After this local minima, the duty factor increases an asymptotically approaches a constant value over 0.5. This duty factor may be advantageous for climbing, since a duty factor above 0.5 ensures at least one foot is always in contact with the surface, with double support occurring at the transition to a new foothold.
6.2. Mechanism for walk to run transition
The distinct leg roles of horizontal locomotion (where legs push against the ground and thus move opposite to the direction of travel) and climbing (were legs pull the body up the surface) might explain the reason for the dynamic gait transitions. While not seen in the 1D simulation, the 2D system demonstrated a gait bifurcation, where for a small range of frequencies both stable dynamic walking and flight running existed, which had been previously seen in the horizontal domain [1].
For the walking to running transition, the system's effective stroke length is approximately equal to the actuator stroke length (represented as the dashed line on figure 10(c)). When the effective stroke length does not exceed the actuator stroke length, the system is dynamically walking, and the loss in effective stroke length occurs because the second limb touches down before the first releases, while above this threshold a flight phase must occur to extend the effective stroke length, thus flight running occurs.
At the transition between flight and compliant running, which occurs at higher actuator frequencies and thus velocities, the body velocity does not stay above the actuator velocity. This causes the second limb to begin moving downward (and thus attach) before the body has risen enough to completely unload the first limb to detach. As the frequency increases, the difference between body and actuator velocity increases to a constant.
6.3. Gait performance and attachment
Having shown the existence of three unique gaits and compared these gaits with horizontal regime trends, the question can then be asked: when should a specific gait be used? For current dynamic climbing robots, attachment limits are the primary constraint in achieving high speed locomotion on a range of surfaces, which is especially true as systems increase in scale. Therefore gaits which minimize the peak ground reaction forces should be more desirable than gaits than gaits with higher ground reaction forces. For the BOB scale simulation, the relation between peak ground reaction force and driving frequency is shown in figure 11(a), which has a peak in the ground reaction forces during flight running then a asymptotic decrease within the compliant running regime.
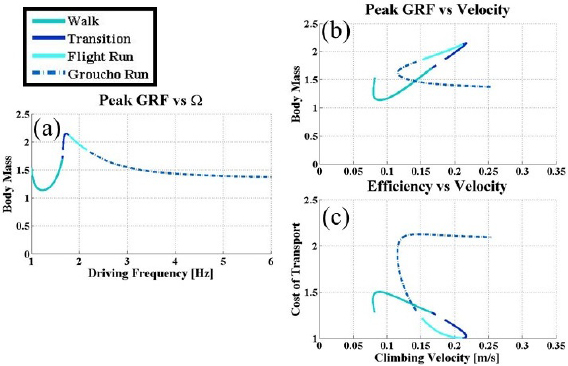
Figure 11. Some implications of the difference between the horizontal domain and vertical domain are the need to reduce the peak ground reaction force. (a) Shows the peak ground reaction force versus driving frequency to show the identify the behavior for the different gaits. (b) Shows the peak ground reaction force versus climbing velocity which is not monotonic so several gaits produce the same climbing velocity. (c) Shows the efficiency for choosing gaits with a lower ground reaction force.
Download figure:
Standard image High-resolution imageThe overall lowest peak ground reaction forces occurred with the walking region, where the peak load occurred when both legs were in contact with the ground as can be seen in figures 6(a) and (b). Since surface strength, part of the surface attachment limit, does not change with robot size, larger systems might need to be limited to dynamic walking gaits to ensure attachment success. Beyond this, when surface conditions are not known or unstable, walking gaits are the least likely to produce attachment failure, which for climbing is often catastrophic.
Since neither peak ground reaction force and climbing velocity are monotonic, the strategy for maximizing velocity while minimizing the peak ground reaction force requires non-standard control inputs. Figure 11(b) provides the relation of ground reaction force and climbing velocity, which results in several gaits at the same climbing speed each with a distinct peak ground reaction force. The strategy to linearly increase climbing velocity which would consistently result in the lowest peak ground reaction force sweeps the driving frequency linearly from 0 to 1.6 Hz, then discontinuously increase driving frequency to 3.5 Hz. This strategy is distinct from standard practices in the horizontal regime, where driving frequency would be continuously swept until the desired speed was reached.
While compliant running limits the peak ground reaction force, it does not maximize efficiency as seen in figure 11(c). For climbing, since the system is continually gaining energy, the theoretical optimal COT is 1 where all energy input into the system results in an increase in the systems' gravitational potential energy. The flight running gaits achieve this limit since the simulation was run without any damping and the only losses come from the additional energy required to drive the system in double stance. For compliant running, the system settles to an efficiency of approximately 2, requiring twice as much energy input during the course of a stride to climb the same distance as the optimal flight gait.
While the peak ground reaction force is a limiting factor as a system increases in mass, an additional factor in climbing success is the ability to recover from attachment failure. For the compliant running gaits, if the next attachment fails, there is still a foot in contact on an attachment point which has already supported the peak ground reaction force. However, for the flight running gaits, there is no foot in contact when a new foot attaches, and if the next foothold fails, the system may catastrophically fail. However, a lighter platform, which produces smaller ground reaction forces, combined with an actuation scheme that ensures attachment could utilize flight gaits which are significantly more efficient and faster than comparable Groucho running gaits.
7. Effect of parameter variation
7.1. Matching experimental trends with damping
In an attempt to more accurately predict the dynamic behavior seen in the experimental results, the simulation was modified to investigate the effect of a range of physically realizable spring stiffnesses and damping values as described in section 2.5. As can be seen in figure 12(a), the system's spring stiffness had the most significant effect on determining the gait transition point, causing the walk to flight running transition to vary from  at k = 200 to
  at k = 400. Increasing damping from
  to 0.2 was accompanied by an overall decrease in the peak ground reaction forces, see figure 12(b), causing the magnitudes to more closely match. The climbing velocity (figure 12(c)) also no longer has a local maximum, only a sharp increase in the flight running regime. Examining figure 12(b), the transition point seems to match with the system having a stiffness of
  and a damping ratio of 0.2. Examining figure 12(a), we see the shift point matchs with a higher stiffness, but quantitatively, once reaching the running frequencies, the data more closely matches the lower stiffness simulation at
  .
.
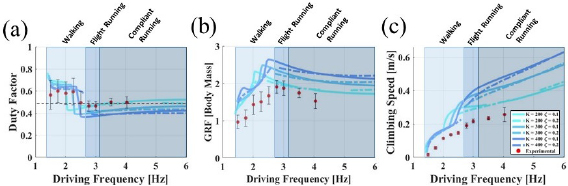
Figure 12. Comparing the experimental results with a simulation including damping, with 6 specific cases shown. The k values of 200, 300, and 400 are each shown with a damping ratio of 0.1 and 0.2. Standard deviation of experimental data is shown with error bars. The transition point matches the simulation with k = 400 and  , but the magnitude during running best matches k = 200
  .
.
Download figure:
Standard image High-resolution image7.2. Impact of damping
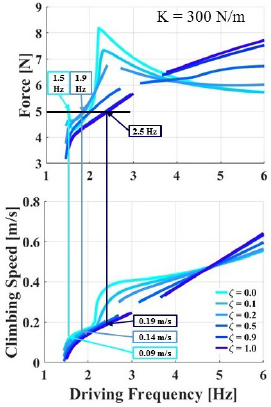
More generally, increasing damping in the system results in a reduction of the local peak or initial slope of the climbing velocity at the transition to flight running, seen in figure 13(bottom). At these higher frequencies and with increased damping, the leg behaves more like a strut rather than a spring, which causes the fixed point to move to a higher energy gait where driving frequency increases stroke length.
Figure 13. Impact of damping on system performance. (top) Peak ground reaction force versus driving frequency. Line at  represents the estimated physical limit of attaching to cinder-block, which results in different upper limits of driving frequency. (bottom) Climbing velocity versus driving frequency. The upper limited of driving frequency is mapped to a climbing velocity and results in a 110% increase in climbing velocity.
Download figure:
Standard image High-resolution image
The peak ground reaction forces, shown in figure 13(top), are affected in a similar manner as the climbing velocity, as the local peak is reduced or eliminated as damping increases. As expected when the leg behaves more like a strut with damping ratios near 1, the increase in peak ground reaction force is almost linear.
While only the results with parameters from BOB have been presented up to this point, additional 1D and 2D simulations were run with a range of spring stiffnesses and damping ratio's. The gait boundaries of the system at various frequencies were determined by applying the gait definitions determined above, namely the change in duty factor and change in the ground reaction force profile. Examining the compliant running region shows that compliant running does not exist for all stiffnesses, only existing in a region with low stiffness. Examining the walking boundary, the frequency transition from walking to running shifts to higher frequencies as stiffness increases.
7.3. Improving simulation fidelity via contact models
Comparing the experimental results to the simulation with damping results, there was no specific parameter set which could simultaneously match the transition point from walking to running and approach quantitatively matching the experimental results. For the running region, the duty factor and peak ground reaction force relatively closely matched the  ,
,  system, but the transition point of this parameter set was off by around
  . The parameter set of
  ,
,  , matched the transition point, but none of the system trends quantitatively matched the results.
This could be reconciled by considering how the number of micro-spines engaged with a surface affects the stiffness. A single micro-spine has a spring stiffness of approximately  , and multiple micro-spines act as a set of springs in parallel. Thus with 5 micro-spines engaged, the effective stiffness of the leg is approximately
  , while when 15 toes are engaged, the approximate stiffness is
  . During our walking gaits, it can be visually observed that most of the micro-spines are engaged, although the exact number varies. Once the system transitions to running, the number of micro-spines engaged decreases. In addition to this, it can be observed that attachment to carpet results in a reduction in the effective stroke length which contributes to the experimental climbing velocity and peak ground reaction force being lower than simulation. This suggests that a better understanding of the attachment dynamics of the micro-spines and a surface dependent model for the attachment could yield more precise alignment of simulation and experimental values.
7.4. Improving performance by varying damping
Increasing damping can generate a shift in the gait transition points, in some cases significantly. In simulation, the transition from walking to running occurs at  without damping and
  for the critically damped case. This understanding can be leveraged to improve performance of the physical robot. Consider the case of climbing on cinder-block where experiments have shown the micro-spines can only support about a
  load, indicated by the horizontal line in figure 13(top). Depending on the damping ratio, this limit is reached at different driving frequencies, shifting from
  to
to  . Mapping these driving frequencies to climbing velocity shows that the maximum walking speed could be increased from
  to
to  , an 110% increase. Thus adding damping could increase the frequency range of the walking gait and consequently the overall achievable speed.
8. Conclusion and future work
In this paper, we show evidence of three distinct dynamic gaits for vertical motion: dynamic walking gaits, flight running gaits and compliant running gaits. Those gaits are identified and classified by adapting definitions commonly applied to gait distinction in the horizontal domain, including the shape of ground reaction force profiles and phasing between peak kinetic energy and gravitational potential energy. We show that comparable gait behavior occurs in both the 1D and 2D models, suggesting that gaits transitions are governed by the spring mass dynamics inherent in the 1D model.
The climbing models show both gaits with flight and double stance, but double stance gaits appear at both low driving frequencies and high driving frequencies. This led to the identification of compliant or Groucho running as a climbing modality, and that these running gaits minimize the peak ground reaction force, a key characteristic for improved surface attachment. Gaits including a flight phase appear at intermediate driving frequencies, which is unlike the horizontal domain where flight phase running is commonly associated with frequencies above walking. Flight gaits are faster and more efficient than compliant running gaits, but may not be reliable and safe for current climbing systems.
Thus to maximize velocity while minimizing peak ground reaction force, a discontinuous set of driving frequencies should be used. For the system with BOB parameters, this translated to using the dynamic walking gaits at frequencies below  and transitioning directly to
  or above for compliant running gaits.
These three distinct dynamic gaits were additionally experimentally verified with a FG climbing robot. The gait regions were determined by looking at the ground reaction force profiles and duty factor of BOB 2.0 while climbing, which demonstrated the presence walking, running, and compliant running.
While the presence of three gaits was seen experimentally, the transition points of these gaits and the velocity versus frequency profile did not quantitatively match the previous frictionless simulation study. Simply adding linear damping to the model, however, captured the qualitative behavior of the experimental results, while also improving the quantitative matching.
Despite the modeling abstractions of the frictionless simulation, the experimental behavior remains consistent with the insights from the initial simulation. Flight phase running has the highest peak ground reaction forces, which, when attachment is a concern, suggests a policy to transitioning from walking gaits directly to compliant running gaits, but this strategy is the least efficient energetically. Additionally, dynamic walking has the lowest peak ground reaction force of all the gaits, which suggests using walking gaits in environments with uncertain attachment.
Furthermore, the low peak ground reaction forces of walking gaits and a knowledge of how damping impacts the transition point could be leveraged in the future to improved performance when limits of attachment are reached. Specifically, with the attachment limits of our current feet on cinder block, increasing damping could result in a shift of the walking gait transition, significantly increasing climbing velocity.
With the identification of these gaits families, dynamic climbing robots could choose to change which gait they used based on current attachment conditions. If the surface becomes less reliable for attachment, dynamic walking gaits could be utilized to reduce the chance for detachment. Additionally, by showing the benefits of flight running gaits, while not currently desirable for current dynamic climbing designs, new actuation schemes might be able to overcome the challenges of flight running to enable faster and more efficient running.
Future investigations can extend the current work by verifying the strategy for increasing performance on surfaces where attachment currently limits the climbing speeds. Another extension could investigate attachment dynamics, specifically how three dimension dynamics are influencing the attachment timing. This work also suggests a number of biological studies, specifically examining if the distinct types of ground reaction force profiles shown in simulation and on BOB 2.0 exist at different climbing velocities, if there are preferences for gait selection based on speed and surface (attachment reliability), and if animals prefer to run with a flight running gait and gain the efficiency benefits of doing so.
Acknowledgment
This work was supported in part by the National Science Foundation Grant Number CMMI-1351524. Any opinion, findings, and conclusions or recommendations express in this material are those of the authors and do not necessarily reflect the views of the National Science Foundation.
Footnotes
- 1
Preliminiary version of the simulation portion of this paper appeared in conference preceedings [25].