

Abstract
For the first time the successful preparation of Sr doped baghdadite (Ca3−xSrxZrSi2O9 x = 0.1 and 0.75) is shown. Sr-doped as well as pure baghdadite are prepared via a versatile solid-state synthesis and conventional sintering at 1400 °C. XRD measurements and crystal structure refinements reveal that a substitution of Ca atoms with Sr and a high purity (>99%) is achieved. The physical, mechanical, and biological properties of these novel bioceramics are presented in relation to the dopant concentration. Incorporating Sr into the baghdadite crystal caused only minor changes to the grain size and the mechanical properties. The characteristic strength ranges from 145 to 168 MPa and a Weibull modulus of 4.9 to 9.2 is observed. Other mechanical properties like fracture toughness and hardness vary from 1.23 ± 0.07 MPam0.5 to 1.31 ± 0.12 MPam0.5 and 7.3 ± 0.6 GPa to 8.0 ± 0.7 GPa, respectively. The in vitro cellular response of human osteoblasts showed an increase in the cell proliferation and a significantly higher alkaline phosphatase (ALP) activity with an increase in the Sr content. From the improved biological properties and the suitable mechanical performance we conclude that this material is a highly promising candidate for bone replacement material and bioactive implant coatings.
Export citation and abstract BibTeX RIS
1. Introduction
One of the major challenges in biomaterial engineering is the quest for an ideal bone substitute material featuring good biocompatibility, resorbability, and mechanical strength [1]. Bioactive ceramics like calcium silicates (CaSiO3 and Ca2SiO4) offer great potential as a bone replacement material due to their high bioactivity [2–6]. However, the high degradation rate causes an increase in pH, which can be detrimental for cell growth in this region and thus for the osseointegration [7].
It has been shown that the incorporation of Zr, Zn, or Mg into calcium silicates (CaSi) results in better biological properties like higher cell proliferation and differentiation, gene expression, and bone formation compared to pure calcium silicates or calcium phosphates [7–10]. For instance, baghdadite (Ca3ZrSi2O9) as a member of these modified calcium silicates has been widely considered and comprehensive studies about its in vitro and in vivo bioactivity have been performed by numerous research groups.
Ramaswamy et al [7] investigated the cell-material interaction of Ca3ZrSi2O9 and CaSiO3 ceramics with different cell lines. They observed that baghdadite induced an increased cell proliferation and bone-related gene expression compared to CaSiO3. Similar results were presented by Lou et al [9] and Roohani-Esfahani et al [11], who investigated the in vivo behavior of baghdadite. Lou et al [9] implanted microbeads comprising either Ca3ZrSi2O9, CaMgSi2O6, or Ca3(PO4)2 into the femurs of rats. A higher expression of type I collagen and more new bone formation was observed using baghdadite microbeads. Roohani-Esfahani et al [11] showed the superior bone formation ability of baghdadite compared to hydroxyapatite (HAp)/β-tricalcium phosphate (β-TCP) scaffolds after 12 weeks implantation in the radii of rats.
Although the biological properties of baghdadite are promising, the bioactivity of this material could be improved by incorporating important bone-related trace elements like Sr, Zn, or Mg into the crystal structure. Strontium is of high interest for bone-related applications as 98% of the strontium within the human body is located in the skeleton [12]. It is generally accepted that strontium improves bone formation and inhibits bone resorption [13]. Therefore, strontium-based compounds (e.g. strontium ranelate) are approved as anti-osteoporotic drugs [14]. Although the interplay of Sr with bone tissue is highly complex [15], extensive research has been conducted to identify the pathways on which it beneficially affects the skeletal architecture [14, 16]. The positive impact of Sr on the biological behavior of ceramic biomaterials has been widely stated. A number of comprehensive reviews about the impact of strontium on the biological properties of Sr substituted biomaterials [15, 17–20] have been reported. Investigations using Sr doped hardystonite (Ca2ZnSi2O7) showed an increased in vitro cell response and in vivo osteoconductivity due to the addition of Sr [12]. The ability to increase the osseointegration of Ti alloy implants by the application of an Sr doped hardystonite coating was shown by Zhang et al [21]. They tested these materials in vitro and in vivo and observed an increased in vitro ALP activity and mineralization due to the release of Sr.
Apart from the biological performance of Sr doped bioceramics its mechanical properties are an important matter for biomaterial research. Numerous publications have focused on the impact of Sr on the mechanical properties and crystal structure of bioceramics [12, 17, 22–24]. However, most of the studies related the mechanical impact of the dopant on the changes in the phase composition or porosity. Thus, a clear relation of the crystal structure with the mechanical properties for these materials is sparse.
In our work, we prepared Sr doped baghdadite materials via a versatile solid-synthesis route and conventional sintering. The impact of the dopant content on the mechanical and biological properties of these novel materials was evaluated. Mechanical characteristics like bending strength, fracture toughness, and hardness were measured and the cell proliferation, cell morphology, and ALP activity of human osteoblasts was monitored to determine the impact of the Sr doping.
2. Materials and methods
2.1. Ca3−xSrxZrSi2O9 preparation
Ca3ZrSi2O9 (baghdadite; BAG) was prepared according to our previously reported synthesis route [25] by mixing stochiometric amounts of CaO (12047, lot. SZBC2430V Sigma Aldrich, Germany), ZrO2 (NZ-911, lot. 090509 Absco Materials, UK), and SiO2 (SiO2P015-01, lot. 110205-01, Fiber Optics, US) and by taking into account the initial mass loss of the starting materials. For the preparation of the Ca3−xSrxZrSi2O9 samples CaO was partially substituted by SrCO3 (472018, lot. MKBK1712V, Sigma Aldrich, Germany) to obtain a composition of Ca2.9Sr0.1ZrSi2O9 and Ca2.25Sr0.75ZrSi2O9. The sample codes, strontium content, and initial powder composition are given in table 1.
Table 1. Sample code and composition of Sr doped baghdadite.
| Sample code | Strontium content (atom%) | Composition (wt%) | |||
|---|---|---|---|---|---|
| CaO | SiO2 | ZrO2 | SrCO3 | ||
| BAG | 0 | 40.9 | 29.2 | 29.9 | 0.0 |
| 0.7S-BAG | 0.65 | 39.1 | 28.9 | 29.6 | 2.4 |
| 5S-BAG | 5 | 28.2 | 26.9 | 27.5 | 17.4 |
These samples will be referenced as 0.7S-BAG and 5S-BAG within this study. The powder mixture was dispersed in 150 mL acetone (technical grade, VWR, Germany) in a 500 mL polyethylene bottle and homogenized for 24 h using a ball mill (UR400, Germatec GmbH, Germany) and 300 g of Al2O3 milling balls (Germatec GmbH, Germany). After homogenization the suspension was dried at room temperature for at least 2 d. Residual acetone was removed by heating on a heating plate for 6 h. Cylinder-shaped green bodies were uniaxially dry pressed at ~4 MPa and sintered (HT 04/17 and 08/17, Nabertherm, Germany). Water and any possible organic residues were removed by heating up to 500 °C at a rate of 1 °C min−1. Afterwards the sample were sintered at 1400 °C for 3 h using a 2 °C min−1 heating rate. The samples were sintered on hydroxyapatite substrates to avoid sintering reactions between the samples and the alumina support material.
2.2. Structural properties
2.2.1. Phase composition and crystal structure
X-ray powder diffraction data were collected at room temperature on a Bragg-Brentano PANalytical X'Pert MPD PRO diffraction system, equipped with Cu-Kα radiation (λ = 1.5418 Å), ¼° fixed divergence, primary and secondary Soller slits with 0.04 rad aperture, a secondary Ni-filter, and an X'Celerator detector system (127 channels, channel width 0.016 71°2θ). The sintered discs were ground with a mortar and pestle to obtain powder samples, which were prepared with a standardized PANalytical backloading system using circular sample holders 16 mm in diameter. Scans were performed in the range from 3° to 120° 2θ, step width 0.0167° 2θ; the measuring time per step was 100 s. Rietveld refinement was performed using Topas V. 4.2 (Bruker AXS GmbH, Germany) to identify a successful substitution of Ca with Sr. As a starting model for all the refinements the crystal structure model of Plaisier et al [26] was used.
2.2.2. Microstructure and grain size analysis
The polishing and grinding of the baghdadite and Sr doped baghdadite was conducted by SiC grinding paper (down to P1200) and diamond paste (down to 1 μm), respectively. To improve the grain size observations the samples were thermally etched at 1350 °C for 10 min in a tube furnace (VFT7, Vecstar Ltd., UK). SEM micrographs were collected with a Zeiss Supra 40 scanning electron microscope (Zeiss, Germany) to investigate the microstructure and grain size of the BAG and Sr doped BAG samples. The sizes of at least 350 grains were measured using Linear Intercept software (v. 2.4.2) and the grain size was calculated according to equation (1).
where D is the average grain size, C is the total length of the test line, M is the magnification, and N is the number of grain intercepts [24].
The elemental composition was quantitatively determined by energy dispersive spectroscopy (EDS) measurements. A voltage of 20 kV was used to ensure a distinct identification of Sr.
2.2.3. Density and total porosity
The true densities (ρtrue) of the baghdadite and Sr doped baghdadite materials were determined with a He Pycnometer (Pycnomatic ATC, Porotec, Germany) at 20 °C. The bulk density (ρbulk) was obtained by measuring the diameter and height of the samples. The ratio of both densities according to equation (2) gave the total porosity of the materials.

2.3. Mechanical properties
2.3.1. Biaxial bending strength
The ball on three balls (B3B) setup was used to determine the biaxial bending strength (BBS) of the samples due to its ability to evaluate the strength of ceramics with an 'as sintered' quality [27]. Disc-shaped samples with a diameter of 22 mm (average for all samples = 22.0 ± 0.2 mm) and a height of 1.7 mm (average for all samples = 1.69 ± 0.05 mm) were used to determine the biaxial bending strength. In this test setup the samples are placed on three support balls (15 mm) and a load is applied on the opposite side through a fourth, centered support ball. The maximum force was measured with a Zwick Z005 universal testing device (Zwick Roell, Germany). A 5 kN load cell and a testing speed of 0.5 mm min−1 was used. All the samples were tested without any surface finishing. The following analytical formulae (according to Godfrey et al [28]) were used to determine the BBS,
where F is the maximal force, t is the sample height, ν is the Poisson's ratio, R is the radius of the disc, Ra is the support radius, and b is the contact radius. Ra and b were determined as follows,


where Rb is the radius of the support balls, and νb and Eb are the Poisson's ratio (0.3) and Young's modulus (210 GPa) of the support balls. The nomenclature and formulae were derived from Börger et al [29].
At least 30 samples per material were tested and analyzed using Weibull statistics. The maximum-likelihood method was used to calculate the Weibull parameters m and σ0 [30].
2.3.2. Fracture toughness and hardness
The sample preparation and determination of the fracture toughness and hardness were conducted according to [25]. We determined the fracture toughness of 5 samples per material by a modified version [31] of the single edge notched beam method (SENB). The ratio of the crack depth to the height of the samples was approximately 0.3.
To measure the hardness we used a Vickers indenter and a force of 1 N, which was held for 15 s. Three samples of each material were indented on three spots and the averages were determined. The hardness was calculated according to equation (6), where F is the applied force and a is the half diagonal of the indent.

2.4. Biological properties
2.4.1. Sample preparation
As a reference material plastic coverslips (Thermanox®, Lot No:1048785, Thermo Scientific, USA) with a diameter of 15 mm and sintered calcium silicate (CaSi) were used. The CaSi samples were prepared by dry pressing. CaSiO3 powder (CaSiO3, Lot # MKBN7395V, Sigma Aldrich, Germany) was mixed with 3 wt% binder to prepare stable discs followed by sintering at 1300 °C for 3 h (LTH 04/17, Nabertherm, Germany). Heating of the samples was applied at 1 °C min−1 to 500 C to allow the release of the binder followed by 2 °C min−1 to 1300 °C.
The sample surface was ground with P320 and P500 SiC grinding paper to generate comparable average surface roughness (Sa) values. Cleaning of the samples was conducted in accordance with große Holthaus et al [32] Sa was calculated according to ISO 25178-2 [33]. Three measurements were performed for each sample, the averages of 10 samples were used for each material, and Sa was determined with an optical profilometer (Plμ2300, Sensofar, Spain) with 420-fold magnification and SensoMap Plus software 5.0.3.499 (Sensofar, Spain). The samples was sterilized by heat treatment at 200 °C for 3 h prior to the cell tests.
2.4.2. Cell culture with HOBs
In vitro investigation was done using human osteoblast cells (HOB, passage 4, Provitro GmbH, Berlin, Germany). HOBs were pre-cultured in Dulbecco's modified Eagle medium (DMEM, Invitrogen, Germany), supplemented with 10% fetal calf serum (FCS, Lot.No. 010M3395, Sigma Aldrich, Germany) and 1% antibiotic-antimycotic (Life Technology, Germany) in a cell incubator (Labotect GmbH, Germany) at 37 °C with 95% air humidity and 9.5% CO2. The cell culture medium was refreshed every 2 d.
These cells were seeded on all the samples (discs approximately 15 mm in diameter), which were placed in 24 well plates (Nalge NUNC, non-treated, Thermo Scientific, Denmark). A cell concentration of 1.5 × 10⁴ cells cm−2 was used and after 1, 3, and 7 d of culturing, the samples were investigated at each time point.
2.4.3. Immunofluorescence staining
Immunofluorescence microscopy was performed to evaluate the cell morphology. At each time point the cells were rinsed with phosphate-buffered saline (PBS, Lot.No. SLBF5741V, Sigma Aldrich, Germany) and fixed with 4% paraformaldehyde (PFA, Lot.No. 53260, Riedel-de Haën, Germany). The cell nuclei and cytoskeleton were stained with 4'6'-diamidino-2-phenylindole (DAPI, Lot.No. 1242642, Fluka, Germany) and Alexafluor®488-phalloidin (Lot. 808465, Invitrogen, Germany), respectively. The cells' shape and behavior were monitored using a fluorescence microscope (Axio Imager M.1, Carl Zeiss GmbH, Germany). For each type of material and sampling point 3 specimens were imaged.
2.4.4. Cell viability of HOBs
Cell proliferation and viability was evaluated using WST-1 colorimetric assay (Roche Diagnostics GmbH, Mannheim, Germany). This method was applied to measure the cell activity via the formazan product in viable cells according to [32]. In brief, 100 μL of WST-1 assay was added to each sample and incubated for 2.5 h at 37 °C. Afterward the absorbance was measured at 450 nm with a reference wavelength of 650 nm using a plate reader (Chameleon V, Hidex, Germany). For every time point 6 replicates of each type of material were employed.
2.4.5. Alkaline phosphatase activity and total protein content
Alkaline phosphatase (ALP) is a marker associated with the early differentiation of HOBs. ALP activity was colorimetrically evaluated at each time point for all the samples using p-Nitrophenyl phosphate (pNPP, Lot.No. 091K5315, Sigma Aldrich, Germany) assay. HOB cells were lysed using a lysis buffer containing 0.1% Triton-X-100 (Lot.No. MKBL5839V, Sigma Aldrich, Germany) in 0.9% NaCl solution. 100 μL of cell lysate was added to 100 μL of pNPP assay and incubated for 30 min at 37 °C. The reaction was stopped with 100 μL of 1 M NaOH (Lot.No. BCBC7310V, 98%, Sigma Aldrich, Germany) and the absorbance was measured at 405 nm using a plate reader (XION X500, Dr Lange, Germany). ALP activity was calculated from a standard curve and normalized with the total protein content, which was quantified using the Pierce BCA protein assay kit (Lot No: OD187710, Thermo Scientific, USA). In brief, 200 μL of BCA working reagent was added to 25 μL of sample and the absorbance was measured after an incubation of 30 min at 37 °C at a wavelength of 570 nm using a plate reader. For every time point 6 replicates of each type of material were employed.
2.4.6. Statistical analysis
The statistical analysis was performed using the statistical software Minitab 16.1.1 (Minitab Inc, State College, US) and the R package [R Core Team (2015). R: A language and environment for statistical computing. R Foundation for Statistical Computing, Vienna, Austria. URL www.R-project.org/]. A one-way analysis of variance (ANOVA) with a post hoc Tukey's multiple comparison method was used to investigate statistically significant (p < 0.05) changes in the cell proliferation and ALP activity of HOBs. The normality of the residuals was checked with an Anderson-Darling Test. As normality tests have small power to detect deviations from normality in samples with sizes as in the present data, a simulation solution was generated to validate the ANOVA results. Ten thousand (10 000) data sets were generated, each of the same size as the original data set, by adding appropriate random errors to the grand mean of the original data set. Random errors were distributed as the residuals found in the original data, obtained by sampling from a kernel density estimate of the residual density, applying the inversion method. For each generated data set, all relevant pairwise group differences and the t statistic for each model coefficient were recorded. From all 10 000 datasets jointly the empirical distributions of pairwise differences and t statistics were calculated. These were used to calculate the confidence intervals for group differences and the p values for the t statistics. This approach has the advantage that no assumption about the normality of data residuals is needed (because the distribution observed in the data is used) and that inference is based on the distributions of test statistics arising from just this error distribution. This approach is preferred over using a rank statistic method like the Kruskal-Wallis test, because the latter is valid only if error distributions in all groups have the same shape and differ only by a location parameter, a condition that is as hard to check as normality in small samples. Further, if the residuals were actually normally distributed, the Kruskal-Wallis test has less power to detect differences than ANOVA or the simulation approach from above.
Furthermore, the influence of the Sr content on the hardness, fracture toughness, and grain size were tested.
3. Results
3.1. Crystal phase
XRD experiments on the three baghdadite samples (BAG, 0.7S-BAG, and 5S-BAG) were performed for the means of phase identification and the calculation of lattice parameters. The diffraction patterns (figure 1) clearly show that all the samples consist of a baghdadite phase (•) as the major component and only a close inspection of the diffraction peaks given in figure 1(b) revealed the presence of traces (<1 wt%) of monoclinic ZrO2 (+) for both Sr doped baghdadites. As indicated in figure 1(b) a shift of diffraction peaks towards lower 2θ is observed, which can be explained by a change in the lattice parameters due to the incorporation of Sr into the crystal structure of baghdadite. The lattice parameters were determined during the Rietveld refinements and are given in table 2.
Table 2. Crystallographic lattice parameters determined by rietveld refinement.
| Properties | Samples | |||
|---|---|---|---|---|
| BAG | 0.7S-BAG | 5S-BAG | ||
| Lattice parameters | a (Å) | 7.3611(2) | 7.3665(1) | 7.4192(1) |
| b (Å) | 10.1821(3) | 10.1826(2) | 10.1981(2) | |
| c (Å) | 10.4468(3) | 10.4618(2) | 10.5820(2) | |
| β (°) | 90.808(1) | 90.8903(9) | 91.022(1) | |
| Sr content (atom%) | expected | 0 | 0.666 | 5 |
| calculated | 0 | 0.733 | 4.8 | |
| Secondary phases | (wt%) | 0 | <1 (ZrO2) | <1 (ZrO2) |
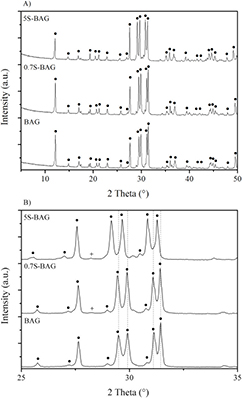
Figure 1. (A) Diffraction patterns of BAG (•), 0.7S-BAG, and 5S-BAG the enlargement, (B) visualizes the shift of diffraction peaks toward lower 2θ, the (+) symbol indicates the presence of traces (<1 wt%) of monoclinic ZrO2.
Download figure:
Standard image High-resolution imageAs expected, due to the higher ionic radius of Sr2+ compared to Ca2+, all the lattice parameters increased with an increasing amount of Sr2+ in the structure. Whereas the changes for lattice parameters b and β are rather small (0.2%), the sample with the highest Sr content yields lattice parameters a and c, which are 0.8 and 1.3% higher than for the Sr-free sample, respectively. The refinement of mixed occupancies clearly showed that in the crystal structure of baghdadite Ca2+ replaced Sr2+ on all three Ca sites. Furthermore, the chemical composition calculated from the refined occupancies is in very good agreement with the initial composition of the samples (table 2).
3.2. Microstructure and grain size
The SEM micrographs of the surface structure and grain morphology of BAG and Sr-doped BAG are depicted figure 2. The polished and thermally etched surface of BAG (figure 2(a)) shows a homogeneous microstructure with a few pores. 0.7S-BAG and 5S-BAG exhibit comparable microstructures confirming the minor impact of the Sr doping the on the microstructure (figures 2(b) and (c)).
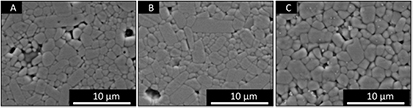
Figure 2. SEM micrographs of polished and thermally etched cross sections of BAG (A), 0.7S-BAG (B), and 5S-BAG (C). Thermal etching was performed at 1350 °C for 10 min and revealed the grain size and morphology.
Download figure:
Standard image High-resolution imageNevertheless, we observed an increased grain growth with higher Sr content. Figures 3(a)–(c) depicts the relative grain length distributions of each material extracted from the SEM images. From figure 3 it is evident that the fraction of smaller grains (up to 1.5 μm) decreased with an increasing Sr content. These shifts are well reflected by the mean grain sizes, which were calculated according to equation (1). We determined a mean grain size of 2.5 ± 0.3 μm, 2.9 ± 0.6 μm, and 3.1 ± 0.2 μm for pure BAG, 0.7S-BAG, and 5S-BAG (table 3). In agreement with the SEM micrographs we observed the existence of larger grains within a large number of smaller grains for pure baghdadite (figure 3).
Table 3. Microstructural features of baghdadite and strontium doped baghdadite.
| Material | Sr content (atom%) | Porosity (%) | Grain size (μm) |
|---|---|---|---|
| BAG Ca3ZrSi2O9 | 0 | 2.8 ± 1.2 | 2.5 ± 0.3 |
| 0.7S-BAG (Ca2.9Sr0.1ZrSi2O9) | 0 | 3.4 ± 1.1 | 2.9 ± 0.6 |
| 5S-BAG (Ca2.25Sr0.75ZrSi2O9) | 5.9 ± 0.7 | 3.4 ± 1.6 | 3.1 ± 0.2 |
a,b,cRepresent groups with members which do not significantly differ from one another based on the Tukey post hoc test (p < 0.05).

Figure 3. (A–C) Grain length distribution of more than 350 grains of BAG, 0.7S-BAG, and 5S-BAG determined by a linear intercept method. For each material at least 350 grains were measured. An increased fraction of larger grains was measured for Sr doped baghdadite. The number of smaller grains seems to decrease with an increase in the Sr content. The dotted horizontal lines (Q1, M, and Q3) represent the first quartile (25%), median (50%), and third quartile (75%) of the cumulative frequency of the grain length.
Download figure:
Standard image High-resolution imageUsing quantitative EDS we detected the amount of Sr in strontium doped baghdadite materials. As expected, we did not measure the Sr signals for pure baghdadite. Unfortunately, this was also the case for 0.7S-BAG. However, we were able to detect 5.9 ± 0.7 atom% Sr for 5S-BAG, which is close to the expected content (table 3). In table 3 a summary of the microstructural characteristics of baghdadite and Sr doped baghdadite is given.
3.3. Biaxial bending strength
The strength of ceramic materials is generally described with the help of the 'weakest-link'-based Weibull statistics [34]. Here, the Weibull modulus (m) and characteristic strength (σ0) represent the scattering of the strength distribution and the stress with a failure probability of 63.2%, respectively. Thus, an increase in both measures will improve the reliability and strength of a ceramic. Weibull plots of the BBS of pure BAG and Sr doped BAG were prepared and are depicted in figures 4(a)–(c). Pure BAG exhibits a modulus of 9.2 and a characteristic strength of 168 MPa. The addition of 0.7 atom% Sr caused a broadening of the strength distribution, which is reflected by an m of 4.9. Likewise a drop in σ0 (145 MPa) was observed (figure 4(b)). Values similar to pure BAG were determined for an Sr content of 5 atom%. The Weibull modulus was 8.6 and σ0 was 162 MPa (figure 4(c)).
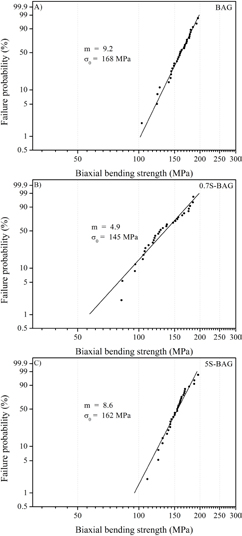
Figure 4. (A–C) Weibull plot of the BBS strength (n ⩾ 30) of pure BAG and Sr doped BAG. The m and σ0 of pure BAG were 9.2 and 168 MPa (figure 4(A)). A Strontium content of 0.7 atom% caused a reduction in the Weibull modulus and characteristic strength. For 5S-BAG similar strength values to pure BAG were observed.
Download figure:
Standard image High-resolution image3.4. Fracture toughness and hardness
The crack and wear resistance of BAG and Sr doped BAG were investigated by means of fracture toughness and hardness, as shown in figure 5. A fracture toughness of 1.22 ± 0.06 MPam0.5 was measured for pure BAG, which increased to 1.30 ± 0.11 MPam0.5 for 5S-BAG (figure 5(a)). Comparing the hardness of Sr doped BAG and pure BAG elucidated similar observations (figure 5(b)). The hardness of the 0.7S-BAG (7.3 ± 0.6 GPa) is comparable to pure BAG (7.4 ± 0.7 GPa), whereas materials containing 5 atom% Sr exhibited slightly higher mean values of 8.0 ± 0.7 GPa. However, a significant difference was not measured.
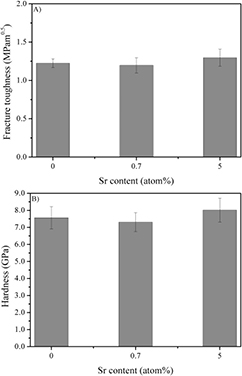
Figure 5. (A) Fracture toughness (n = 5) of BAG and Sr doped BAG. The fracture toughness was in a range of 1.22 ± 0.06 MPam0.5 (BAG) and 1.30 ± 0.11 MPam0.5 (5S-BAG). (B) The hardness (n = 9) of BAG and Sr doped BAG varied from 7.3–8.0 GPa. A significant difference for the fracture toughness and hardness of pure and Sr doped baghdadite was not observed.
Download figure:
Standard image High-resolution image3.5. Cell morphology
Fluorescence imaging was applied to observe the morphology of HOB cultivated on the BAG and Sr doped BAG samples. For comparison, Thermanox® and CaSi were used as references. To provide a comparable surface roughness of the ceramic materials they were treated with SiC grinding paper (P320 and P500). For the BAG and Sr doped BAG samples a comparable roughness was achieved, which ranged from 0.53 ± 0.04 μm for BAG to 0.44 ± 0.05 μm for 5S-BAG. The surface roughness of CaSi was 1.61 ± 0.09 μm. Figure 6 shows the immunofluorescence staining of HOBs after 7 d of cultivation.
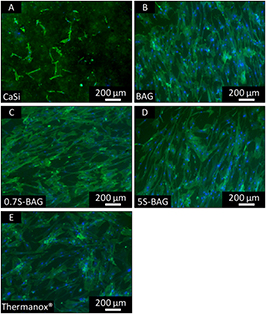
Figure 6. Fluorescence microscopy images of HOBs on CaSi, BAG, 0.7S-BAG, 5S-BAG, and Thermanox® after 7 d of culturing. Cells on CaSi are round and formed stressed actin filaments. Flattened and well-spread cells could be observed on the other materials (cytoskeleton = green, nuclei = blue).
Download figure:
Standard image High-resolution imageThe cells grown on BAG, 0.7S-BAG, and 5S-BAG are flattened and well spread over the surfaces. They show a polygonal morphology with well-defined stress fibers and actin containing micro filaments even after 1 d of culturing, which is comparable with Thermanox® (data not shown). On 0.7S-BAG and 5S-BAG samples, the cells show a strong intercellular network indicating numerous filopodia-like processes. This observation could not be made for CaSi, on which the cells look round without many cell-to-cell contacts.
3.6. Cell proliferation of HOBs
WST-1 assay was applied to determine the cell activity and proliferation of HOBs on different baghdadite materials (figure 7).
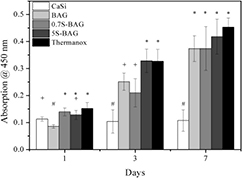
Figure 7. Cell proliferation of HOBs on CaSi, BAG, 0.7S-BAG, 5S-BAG, and Thermanox® determined via WST assay after 1, 3, and 7 d. CaSi as a reference material presented the lowest cell proliferation on all days. Sr doped baghdadite materials exhibited comparable or significantly higher cell proliferation over the investigated period, which was comparable to Thermanox®. For every time point 6 replicates of each type of material were tested. #, *,+ represent groups with members which do not significantly differ from one another based on the Tukey post hoc test (p < 0.05).
Download figure:
Standard image High-resolution imageHOBs steadily proliferated through 7 d of culturing on BAG, 0.7S-BAG, and 5S-BAG. The proliferation of HOBs on BAG was significantly lower compared to the other investigated materials after one d of culturing. It increased for all the baghdadite-related materials and Thermanox® after day three, where CaSi showed significantly lower cell proliferation. After 7 d of culturing the proliferation of BAG, Sr doped BAG, and Thermanox® was comparable. At that point CaSi showed the lowest proliferation.
3.7. ALP activity of HOBs
The ALP activity was measured after 1, 3, and 7 d of cell culturing (figure 8). It is a biochemical marker for osteoblast cells and plays an important role in bone differentiation and mineralization [12, 35]. As shown in figure 8 the ALP activity of the cultured HOBs increased over the test period on all the samples.

Figure 8. The ALP activity of HOBs was determined after 1, 3, and 7 d of culturing. HOB cells on CaSi materials showed the lowest ALP activity on all days. Baghdadite and Sr doped baghdadite materials exhibited a comparable ALP activity to Thermanox®. The highest ALP activity was found for cells on 5S-BAG, which was significantly higher compared to the other materials. For every time point 6 replicates of each type of material were tested. #, *,+ represent groups with members which do not significantly differ from one another based on the Tukey post hoc test (p < 0.05).
Download figure:
Standard image High-resolution image
Significantly higher ALP activity compared to the other materials was found for 5S-BAG and Thermanox® at day one. At day three both Sr doped baghdadite samples showed a significantly higher ALP activity. Here CaSi, BAG, and Thermanox® exhibited comparable ALP activity results. Slightly different findings were observed after seven d of culturing. Among the investigated materials 5S-BAG exhibited the highest ALP activity. Followed by this result BAG, 0.7S-BAG, and Thermanox® showed comparable activity, whereas CaSi showed the lowest ALP levels.
4. Discussion
The successful preparation of almost pure (<1 wt% ZrO2) Sr doped baghdadite was confirmed by XRD and Rietveld refinements (figure 1 and table 2). With increasing the Sr content all four lattice parameters systematically increased, suggesting a linear relationship that needs to be verified by additional samples. Similar observations were reported by O'Donell et al [36], who prepared Sr doped apatites. However, they additionally observed a linear increase in the crystallographic lattice parameters and density with increasing fractions of incorporated Sr. These dependencies were attributed to the differences of Ca and Sr atoms in mass and size and were also observed by Aina et al [37]. The presence of less than 1 wt% ZrO2 shows the efficiency of our solid-state method. It should be noted that its volumetric content is even less due to the higher crystallographic density of zirconia (5.9–6.1 g cm−3) compared to strontium doped baghdadite (3.5–3.6 g cm−3).
Taking the crystal composition of Sr doped BAG and pure BAG into account our findings regarding the porosity and grain size are reasonable. Pure BAG exhibits a porosity of 2.5 ± 1.6% with a grain size of 2.5 ± 0.3 μm (table 3). With the substitution of Ca with Sr the crystallographic cell volume slightly changed, but it did not majorly affect the porosity or grain size (table 3). However, a minor increased mean grain size was found, which was significant for the highest Sr content. These changes might be attributed to a change in the sintering kinetics by strontium. In a study conducted by DeVoe et al the impact of Sr on the grain size and porosity of β-TCP was investigated [23]. They found a decrease in the porosity with an increase in the Sr content (up to 5 mol%) whilst the grain size was unchanged. The increased densification was hypothesized to be related to an increased sintering kinetic by the addition of strontium. Likewise, Curran et al observed only minor changes in the grain size in the investigated range (5 and 10 mol% Sr) [24]. However, they assumed that grain boundary diffusion could not contribute to grain growth due to a low relative density. Based on the cited literature and the observed microstructure of BAG and Sr doped BAG (figure 2) it is highly likely that Sr influenced the sintering process.
The mechanical performance of pure baghdadite has been recently reported [25]. A bending strength of ~100 MPa was determined as well as a fracture toughness and hardness of 1.3 MPam0.5 and 7.9 GPa, respectively. Apart from the strength value, which was 168 MPa in the B3B setup, comparable mechanical characteristics (figures 4 and 5) were observed in this investigation. A reason for the different strength values can be found when the varying test setups and sample preparations are considered. In the previous study, a four-point bending setup was used, which typically results in slightly lower observed values due to different stress states in the samples [29]. However, in the present study we chose the B3B test because of the easy sample preparation as well as the biaxial stress state, which can be considered more realistic for many ceramic applications [38].
The investigation of the mechanical properties of Sr doped baghdadite showed that the impact of Sr is limited in its strength, hardness, and fracture toughness. Although minor variations in these material properties could be observed a clear trend is nonexistent. This might be explained by the constant porosity and relatively small changes in the grain sizes, in combination with the stable phase composition. Comparable results were observed by Albert et al [39] for Sr doped HAp. They observed a constant strength of the materials up to an Sr content of 15 wt% accompanied by stable phase composition. However, no information regarding the porosities for the materials considered are stated. In another study a different effect of Sr is described. For example, DeVoe et al observed that the addition of 5 mol% Sr to β-TCP increased the compressive strength (~57%) without altering the phase composition [23]. However, the strength increase was attributed to a better material densification and less porosity, which was not observed in our study. Furthermore, Yatongchai et al prepared Sr doped HAp with 5 and 10 wt% and found a lower Weibull modulus for an Sr content of 5 wt% compared to 10 wt%. It was proposed that the higher Sr content altered the microstructure during sintering and led to less crack nucleation sites and flaw reduction [40]. However, it should be pointed out that Sr addition caused a phase transformation of HAp to β-TCP in this case, which can also be attributed to the strength changes.
The in vitro biocompatibility of baghdadite and Sr doped baghdadite was evaluated by monitoring HOB cell morphology, proliferation, and ALP activity. Some studies have already been conducted on the biological performance of baghdadite, which cover a range from in vitro biocompatiblity tests to in vivo studies. All of them stated that baghdadite exhibits superior biological properties [7, 9, 11, 41, 42]. Ramaswamy et al investigated the in vitro biocompatibility of baghdadite ceramics with primary human osteoblast, osteoclast, and endothelia cells, and compared their findings with calcium silicate samples. In consistency with our results (figures 7 and 8) they found a significantly higher metabolic activity of HOBs cultured on baghdadite ceramics. The differences in cell activity were attributed to the different released ion (Ca and Si) concentrations from both materials as well as the increased pH values within the culture medium for CaSi [7]. Furthermore, a different surface roughness might have contributed to the varying cellular response. In our study we were able to maintain a comparable surface roughness (Sa) for all baghdadite-related materials via grinding. It ranged from 0.53 ± 0.04 μm for pure BAG to 0.47 ± 0.05 μm and 0.44 ± 0.05 μm for 0.7S-BAG and 5S-BAG, respectively.
In our study we showed that HOB cells possessed the highest ALP activity on 5S-BAG after 7 d of culturing (figure 8). It significantly increased compared to all the other investigated materials. In our opinion, this increased ALP activity can be attributed to the incorporation of Sr into the baghdadite crystal structure. Recent studies of Sr doped calcium silicate based ceramics have also confirmed the general opinion that Sr addition positively influences cellular activity. Zreiqat et al showed that Sr doped hardystonite (Ca2ZnSi2O7) ceramics induced a better in vitro cell attachment and differentiation of HOBs compared to pure hardystonite [12]. It also exhibited enhanced expression levels of osteogenic markers. These observations were confirmed by Zhang et al, who identified the release of strontium from Sr doped hardystonite to be a key issue in the differentiation of canine bone marrow mesenchymal stem cells [21].
In our study, we showed that the successful preparation of Sr doped baghdadite resulted in a material with similar mechanical properties as pure baghdadite but with improved biological performance. The combination of good strength, high hardness, and improved ALP activity makes Sr doped baghdadite an ideal candidate for biomedical applications such as coating, filler, or scaffold material in non-load bearing applications. Furthermore, we still see the potential for the improvement of the mechanical strength of Sr doped baghdadite by decreasing the grain size. This could be achieved by an optimized sintering profile or a more advanced sintering technique like spark plasma sintering or high frequency induction heat sintering.
5. Conclusion
The preparation of Sr doped baghdadite has been reported for the first time. The resulting new materials were synthesized with the use of the versatile solid-state method and contained approx. 0.67 and 5 atom% Sr. XRD measurements and Rietveld refinements confirmed the substitution of Ca by Sr and revealed a linear increase in the lattice parameters with increasing the Sr content. The influence of the dopant concentration on the materials' properties were evaluated. We showed that Sr did not significantly alter the porosity, grain size, and mechanical properties of baghdadite. The biaxial bending strength, fracture toughness, and hardness of these materials were approximately 168 MPa, 1.3 MPam0.5, and 8.0 GPa, respectively. An evaluation of the in vitro biocompatibility of the materials was conducted with human osteoblasts up to 7 d. Immunofluorescence staining revealed a well-flattened cell morphology and a strong intercellular network indicating numerous filopodia-like processes on pure and Sr doped baghdadite. The cell proliferation of HOBs on pure and Sr doped baghdadite was comparable to Thermanox® and also significantly higher compared to pure CaSi at all the investigated sampling times. Regarding the ALP activity of HOBs we even observed a significant increase in 5S-BAG compared to Thermanox® and the other baghdadite containing materials. Pure calcium silicate exhibited significantly lower ALP levels. Moreover, our results showed that the substitution of Ca with Sr did not affect the mechanical properties of baghdadite but increased the ALP activity of HOBs.
Acknowledgments
We thank the Petra Witte for the help with the SEM and EDS measurements and the European Research Council for the financial support within the Biocer Eng, Project No. 205509.