

Abstract
Policy makers have called for a 'fair and ambitious' global climate agreement. Scientific constraints, such as the allowable carbon emissions to avoid exceeding a 2 °C global warming limit with 66% probability, can help define ambitious approaches to climate targets. However, fairly sharing the mitigation challenge to meet a global target involves human values rather than just scientific facts. We develop a framework based on cumulative emissions of carbon dioxide to compare the consistency of countries' current emission pledges to the ambition of keeping global temperatures below 2 °C, and, further, compare two alternative methods of sharing the remaining emission allowance. We focus on the recent pledges and other official statements of the EU, USA, and China. The EU and US pledges are close to a 2 °C level of ambition only if the remaining emission allowance is distributed based on current emission shares, which is unlikely to be viewed as 'fair and ambitious' by others who presently emit less. China's stated emissions target also differs from measures of global fairness, owing to emissions that continue to grow into the 2020s. We find that, combined, the EU, US, and Chinese pledges leave little room for other countries to emit CO2 if a 2 °C limit is the objective, essentially requiring all other countries to move towards per capita emissions 7 to 14 times lower than the EU, USA, or China by 2030. We argue that a fair and ambitious agreement for a 2 °C limit that would be globally inclusive and effective in the long term will require stronger mitigation than the goals currently proposed. Given such necessary and unprecedented mitigation and the current lack of availability of some key technologies, we suggest a new diplomatic effort directed at ensuring that the necessary technologies become available in the near future.
Export citation and abstract BibTeX RIS

Content from this work may be used under the terms of the Creative Commons Attribution 3.0 licence. Any further distribution of this work must maintain attribution to the author(s) and the title of the work, journal citation and DOI.
Introduction
Climate negotiations are intensifying as the next deadline for a new international climate agreement fast approaches in Paris (December 2015). It is likely that a core mitigation component of a future agreement will include the Intended Nationally Determined Contributions (INDCs). The INDCs are national pledges that contribute to meeting the objective of the United Nations Framework Convention on Climate Change (UNFCCC) to achieve 'stabilization of greenhouse gas concentrations in the atmosphere at a level that would prevent dangerous anthropogenic interference with the climate system' (United Nations 1992). However, the INDCs are not coordinated between parties and hence analysis is required to determine whether the global sum of all INDCs is consistent with the objectives of the UNFCCC.
The 'Lima Call for Climate Action' requested countries to show that their INDC 'is fair and ambitious, in light of its national circumstances, and how it contributes towards achieving the objective of the (UNFCCC)' (UNFCCC 2014a). However, there is no information on how to measure 'fair and ambitious', and there is no unique or agreed way to do this. We draw on the cumulative emissions framework (Allen et al 2009, Friedlingstein et al 2014) and a recent approach to sharing the resulting allowed global emissions between nations (Raupach et al 2014) to provide a possible framework for how to assess 'fair and ambitious'. For illustrative purposes, we compare two ways to share carbon emissions: (i) sharing emissions based on current population (denoted simply as 'equity') and (ii) sharing based on the current national fractions of global emissions (denoted simply as 'inertia').
Previous studies have assessed ambition (e.g., UNEP 2014) and many sharing principles have been proposed (e.g., Meyer 2000, den Elzen et al 2005, Böhringer and Welsch 2006, Baer et al 2008, Höhne et al 2013), but there are few analyses on the trade-off between ambition and fairness. The IPCC Fifth Assessment Report (AR5) provides an assessment of fairness and ambition (Clarke et al 2014, figures 6.28 and 6.29), but the combination of scenarios and sharing approaches used make it difficult to isolate the effect of sharing. Our analysis takes an alternative approach by basing ambition on cumulative carbon emissions and consequently assessing fairness, albeit with the limitation that this is done only through CO2 emissions.
The cumulative carbon emissions concept was highlighted in the IPCC AR5, appearing prominently in the Summary for Policy Makers of Working Group I (IPCC 2013) and the Synthesis Report (IPCC 2014). While the cumulative emissions concept has many attractive features (Frame et al 2014), an important limitation is that it does not explicitly consider non-CO2 gases at the country level, complicating its application in climate policy. Many non-CO2 emissions are linked to agriculture, posing different mitigation challenges and further complicating comparisons with CO2. The cumulative emissions concept does, however, make the task of sharing emissions significantly more tractable (e.g., WBGU 2009, Anderson and Bows 2011, Raupach et al 2014). Further, cumulative carbon depicts the constraints on the long-term warming, since non-CO2 agents are expected to become less important relative to CO2 by the end of the century. As we will show, the cumulative emissions approach allows a rapid and transparent analysis of the fairness and ambition of the INDCs.
Countries have already started submitting their INDCs (UNFCCC 2015), and some countries have given aspirational goals to emission levels in 2050. We focus our analysis on the three largest emitters, the European Union, USA, and China, to demonstrate the applicability of the cumulative emissions framework and to provide an initial assessment of fairness and ambition. We then build on this analysis to discuss the advantages and disadvantages of the cumulative emissions approach, as well as the implications for climate policy.
Method
Defining ambition
Recent scientific research assessed in the IPCC AR5 highlighted the powerful near-linear relationship between increases in global average temperature and cumulative carbon dioxide emissions (IPCC 2013). This relationship allows the probability of exceeding a given temperature target to be translated into the total amount of CO2 emitted into the atmosphere in the past and in the future. To have a 'likely' (>66%) chance of holding global warming to less than 2 °C requires that no more than about 3670 billion tonnes of carbon dioxide (GtCO2) are emitted in total, from 1870 until well into the future (IPCC 2013). The probability associated with this statement reflects the best current knowledge of uncertainties in the climate system. The total allowable emissions can be adjusted for past and future emissions of non-CO2 forcing agents, historical emissions from fossil-fuel combustion and industrial processes (FFI), and past and future emissions of land-use change (LUC), to give the remaining allowable FFI CO2 emissions to stay below 2 °C (figure 1) (IPCC 2013, Friedlingstein et al 2014). The remaining allowable emissions are for CO2 only, which has both advantages and disadvantages (see discussion). Non-CO2 forcing agents contribute 10%–30% of the total forcing across scenarios, and affect the cumulative carbon budget by about 15% for the set of scenarios considered (Friedlingstein et al 2014).
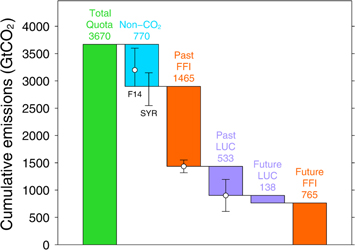
Figure 1. The total allowable carbon emissions for a likely (>66%) chance to keep global average temperature less than 2 °C above pre-industrial levels ('total quota'), showing the adjustments leading to the total remaining carbon emissions from fossil fuels and industrial processes ('Future FFI'). For the non-CO2 adjustment we show the IPCC WG1 value (used in our analysis) together with the 5%−95% range used by Friedlingstein et al (2014, 'F14') and the IPCC Synthesis Report (IPCC 2014; 'SYR'). The 5%–95% uncertainty range in past FFI is ±8% and LUC is ±55%.
Download figure:
Standard image High-resolution imageOur focus here is on a >66% chance of staying below a 2 °C increase in global average temperature, the goal accepted by a broad range of countries, but our framework applies equally for other temperature limits and probabilities. The allowable emissions would increase with acceptance of either a higher temperature level (e.g. 3 °C), or a lower probability of attaining that goal (e.g. >50% probability), or both (IPCC 2013). As an example, decreasing the probability of staying below 2 °C from >66% to >50% increases the allowable emissions to 4440 GtCO2. We discuss and include results for 2 °C with a >50% chance, and 3 °C with a >66% chance in the supporting material.
To estimate the remaining allowable emissions from the total allowable emissions of 3670 GtCO2 (figure 1) we first subtract non-CO2 emissions of 770 GtCO2-equivalent (IPCC 2013). We then deduct estimates of historical emission of FFI (1465 GtCO2 ± 8%, 5%–95% range) and LUC (533 GtCO2 ± 55%, 5%–95% range) up to 2014 from the cumulative allowance. We take historical emissions from CDIAC (Boden et al 2015), but for the years 1990–2012 we overwrite CDIAC's estimates using the official UNFCCC Annex I country CO2 emissions from the respective national inventory reports to the UNFCCC (UNFCCC 2014b). Using the UNFCCC data ensures our analysis is consistent with national reporting, and therefore more policy relevant. Because BP data provide the most recent estimates by country, we follow Le Quéré et al (2015) by applying energy consumption growth rates by fuel type from BP to extend our time series for non-Annex I countries to 2014. Recognizing that there remains considerable uncertainty in Chinese emissions data (Liu et al 2015), in the supporting material we repeat the analysis with China's fossil-fuel emissions as estimated by BP, which are at the high end of available estimates. We finally deduct an estimate of future LUC emissions assuming they diminish linearly to zero by 2100, broadly consistent with the LUC emissions from the RCP scenarios used in the AR5 (Ciais et al 2013, Raupach et al 2014). These adjustments can be expressed as

The main source of uncertainty in the allowable emissions quota for a given temperature target is the non-CO2 adjustment (figure 1), which depends on a choice of scenarios. The IPCC AR5 WGI used the non-CO2 emissions (hence forcing) from RCP8.5 (remaining quota 2900 GtCO2), while Friedlingstein et al (2014) used the non-CO2 emissions from Working Group III's scenarios (remaining quota 2900–3600 GtCO2, 5%–95% range), and the AR5 Synthesis Report used only the subset of the WGIII scenarios that are likely to stay below 2 °C (remaining quota 2550–3150 GtCO2, 5%–95% range) (IPCC 2014). In our analysis, we focus on the IPCC AR5 WGI value as our central value. For a given temperature level, the next largest sources of uncertainty in the allowable remaining quota are the past LUC emissions followed by the past FFI emissions.
The cumulative emission allowance provides a framework for setting a level of global ambition and thereby bounds on future emission pathways (Friedlingstein et al 2014, Raupach et al 2014). There is limited leeway to increase this number: only accepting a higher temperature level (e.g., from 2 °C to 3 °C), reducing the probability of staying below that level (e.g., from >66% to >50%), assuming a lower climate sensitivity, or lower forcing from non-CO2 agents (at least for the near term, noting that the long-term climate depends primarily on CO2). Negative-emission technologies would allow more CO2 to be emitted in the near future (Fuss et al 2014), but the cumulative allowance would be unchanged.
Comparing fairness
Given the concept of allowable global carbon emissions (referred to here as 'quota'), the question of how it could be shared among nations has been widely discussed (e.g., Meyer 2000, den Elzen et al 2005, Böhringer and Welsch 2006, Baer et al 2008, Höhne et al 2013). Here we follow the method of Raupach et al (2014), employing an 'equity' approach that divides the global quota among nations based on population, and an 'inertia' approach that divides based on the current shares of global emissions. Raupach et al (2014) find that a strict division of the global quota based on population leads to infeasible transitions in some countries (which are either close to reaching, or have already exceeded their allotted quota under such a scheme), while a strict division based on current emissions is widely seen as unfair since some countries currently emit far more per capita than others. These two alternatives act as bounds to a range of blended options, and demonstrate how national quotas can be allotted using any mix of the two alternatives, e.g. using a sharing parameter suggesting a 'middle ground'.
Raupach et al (2014) show how the national quotas obtained from the sharing parameter could be used to generate smooth pathways between countries' present emissions, f0, to near-zero emissions in the future. This concept of the interpolation is based on a decaying exponential, with decay constant  to represent mitigation. This exponential is modified to allow a smooth transition from the current pathway (represented by recent rate of change of emissions,
  resulting in an idealized composite emission pathway:

The decay parameter,  is determined such that the area under the curve is equal to the quota allocated to each country based on the sharing parameter. In the unusual situation that emissions are already decreasing at a rate faster than the required mitigation rate, no solution exists for
  that will produce the required quota. In such cases, Raupach et al (2014) revert to a simple exponential decay,

As a result of the smooth transition, the realized mitigation rate is given by

The realized mitigation rate is a function of time. It may be negative at the start for countries with increasing emissions (emissions continue to grow for a period), but ultimately converges over time to a mitigation rate of  as the effect of the transition function diminishes.
EU, US, and Chinese pledges
As described above, our analysis only applies to CO2 emissions from fossil-fuel combustion and industry (FFI). We take the EU, US, and Chinese INDC submissions directly, but supplement them with longer-term pledges from the EU and US to demonstrate a longer-term analysis.
For the EU, we take their INDC of a 40% reduction below 1990 levels, and a stated aspirational target of an 80% reduction from 1990 by 2050 (European Commission 2011). For the US, we take a 17% reduction below 2005 levels in 2020 from their Copenhagen pledge, a 26%–28% reduction below 2005 levels in 2025 from their INDC, and an aspirational 83% below 2005 levels from the Copenhagen Pledge (UNFCCC 2009). The EU and US targets are for total greenhouse gas emissions, but we assume the same reductions apply for CO2. This weakness of the cumulative emissions approach is elaborated further in the discussion.
Rather than present an intended absolute emissions reduction, China's INDC is specified in terms of an emissions intensity reduction of 60%–65% below 2005 levels by 2030. As a result, any estimate of the future emissions pathway depends on an estimate of future growth of GDP. We use forecasts recently made by the OECD that project China's GDP growth to gradually decline from today's levels to about 3.5%/yr in 2030 (OECD 2015). The choice of interpolation method between emissions intensity now (2014) and in 2030 directly determines whether and when an estimated emissions pathway will peak before 2030. We use an exponential decay function that best fits historical data over 2005–2014 and passes through both the most recent data year and the stated target (supporting material). Using this method gives an emissions peak of about 11.4 GtCO2 in 2026 before declining slightly to 11.3 GtCO2 in 2030 for a 60% reduction in emissions intensity, and a peak in 2021 at 10.5 GtCO2 before declining to 9.9 GtCO2 in 2030 for a 65% reduction. While this approach gives smooth trajectories, the possibility of substantial deviations from the pathway are not discounted. In our analysis we use the more optimistic, lower emissions pathway in the remaining analysis.
Our analysis is of the targets expressed in the INDCs, with no assumptions about the policies that may be used by countries to achieve the stated targets. In practice, it is unclear whether the stated targets will be met, and various circumstances may influence emissions along with any particular policy decisions. For example, some of the emissions reductions that have already occurred in the EU were a consequence of the collapse of Eastern Europe (Peters et al 2013), while some of those in the US were due to the Global Financial Crisis (Feng et al 2015), and it is unclear whether the slowdown in Chinese emissions growth in 2014 was due to economic challenges or long-term structural changes. Further, countries may meet their targets by displacing emissions to other countries with the help of structural changes in international trade (Peters et al 2011). We show results in the supporting material for additional temperature targets to examine a range of future outcomes.
Our framework can be applied to INDCs from other countries.
Results
Figure 2 shows the recent EU, US, and Chinese pledges, extended based on announcements of future targets, and compared with a >66% probability of staying below 2 °C adopting each of the two illustrative definitions of sharing. We include CO2 emissions from fossil-fuel combustion and industrial processes only. The US and EU emission pledges can be viewed as being broadly in line with a global ambition of avoiding 2 °C of warming only when applying the 'inertia' principle, whereby the remaining global quota is shared based on the current distribution of emissions. Because the USA and EU represent a considerably smaller fraction of current total world population than they do of current global carbon emissions, substantially deeper mitigation rates would be required if the global emissions allowance is shared according to equity based on current national populations (lower bounds of the ranges in figure 2).

Figure 2. Estimated historical FFI emissions from 1990 to 2014, formal and informal pledges, and pathways consistent with 2 °C spanning a range from 'inertia' to 'equity' for the EU, USA, and China. Note the different vertical axis limits.
Download figure:
Standard image High-resolution imageThe emissions pathway resulting from our interpretation of the Chinese pledge (figure 2(c)) remains a long way from either of the sharing measures used here. A key issue for China compared to the US and EU, irrespective of the allocated carbon quota, is that China has recently had high positive emissions growth. This emissions growth would need to be overcome if China were to move onto a pathway consistent with the emissions pathways presented here. In contrast, the EU and USA are already decarbonizing, and thus to meet a pathway consistent with 2 °C only requires further accelerating the current rates of decarbonization. Since China is the largest emitter of CO2 emissions, it receives the largest emission quota for any country based on 'inertia'. Despite this, China would still need to peak emissions by around 2017 before starting a rapid decarbonization of the economy to more than 80% emissions reductions by 2050 if 2 °C is to be avoided and considering the 'shares' of others. It is notable that China already has high per capita emissions (40% above the global average and 9% above the EU average, see figure 4 below), meaning that China actually has a smaller remaining quota based on current population. Thus, when sharing emissions by population ('equity'), China would have to have an earlier, almost immediate, peak in emissions and a more rapid decarbonization.
Given remaining allowable emissions from 2015 and our global emissions pathway (figure 3, generated using equation (1)), global emissions would need to peak before 2020, although net-negative emissions would allow a later peak (Fuss et al 2014). Figure 3 shows that over the period 2015–2050, the combined EU, US and Chinese pledges allow very little room for other countries to emit carbon if the global temperature increase is to stay below 2 °C with >66% probability. By 2030, emissions from the EU, USA and China amount to 16.2 GtCO2/yr, 79% of the global emissions compatible with a 2 °C target. It is also clear from figure 3 that the combined pledges from EU, US and China implies extremely large mitigation for the rest of the world (emissions having to decrease from 17.5 GtCO2 in 2014 down to 4.4 GtCO2 in 2030, i.e. about 9% per year). In other words, more rapid mitigation by the EU, USA, and China would be needed to allow more room for other countries to emit.

Figure 3. The combined emissions from these three counties compared to global emissions, with the thick solid line representing a global pathway consistent with 2 °C.
Download figure:
Standard image High-resolution imageThe cumulative emissions over the period 2015–2050 allow an estimate of how much of the remaining global quota is used by the EU, USA, and China, and thereby what remains for other countries (table 1). By 2030, the EU, USA, and China combined would already have emitted 37% (285 GtCO2) of the remaining global quota (765 GtCO2). Cumulative emissions for the Chinese pledge over the period 2015–2030 account for 22% of the remaining quota while corresponding values for the USA and EU are 10% and 6%.
Table 1. The cumulative emissions over different time periods from figure 2 (GtCO2). Note that 'Rest of the World' includes statistical differences and international bunker fuels.
| Historical cumulative | Remaining quota 2015–∞ | Future cumulative emissions as deduced from current pledges | ||||
|---|---|---|---|---|---|---|
| 1870–2014 | Equity | Inertia | 2015–2020 | 2015–2030 | 2015–2050 | |
| USA | 379 | 34 | 123 | 31 | 74 | 120 |
| EU | 332 | 53 | 73 | 19 | 46 | 79 |
| China | 170 | 144 | 219 | 62 | 165 | — |
| Rest of the World | 584 | 534 | 350 | — | — | — |
| Global | 1465 | 765 | 765 | 214 | 480 | 694 |
When compared to their allowed emissions, the USA would exceed its equity quota in 2020 and inertia quota very soon after 2050 (unless zeroing emissions at that time), the EU would exceed its equity quota in 2032 and inertia quota in 2044, and China would exceed its equity quota in 2027 and inertia quota sometime after 2030. If the EU, USA, and China followed lower pathways (figure 2), the emissions available for other countries would be significantly higher.
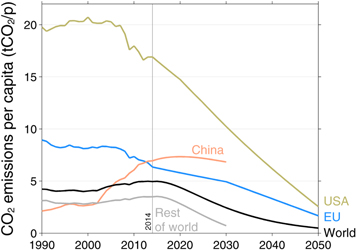
Figure 4 and table 2 show the EU, US, Chinese, the Rest of the World, and global past and future pledges on a per-capita basis. The current US per capita emissions are more than twice as high as the Chinese and EU average, while the Chinese pledge leads to a peak of per capita emissions at about 7.3 tCO2/p in 2020, declining to 6.8 t/p in 2030, at which time it would be about 38% above that of the EU with the US still about twice that of the EU. The EU, US, and Chinese pledges together with a 2 °C global temperature limit imply that the rest of the world's collective per capita emission in 2030 would have to be about 0.7 t/p (obtained by deducting the global quota and the country pledges in figure 3), compared to the current level of 3.5 t/p, and compared to 2030 values of 4.9 in the EU, 10.2 in the USA, 6.8 in China. When added together, the 'fair and ambitious' pledges proposed by EU, USA and China imply that China's per capita emissions would be between those of the US and the EU by about 2030, and the per capita emissions of all other countries will have to be 7 to 14 times lower than for these three top emitters (table 2).
Figure 4. Historical and future per-capita emissions. Historical emissions data are described in the text. Future emissions for USA, EU, and China are based on INDCs and other stated targets, while World is based on a 2 °C (>66%) carbon quota, and Rest of world is calculated as a residual. Population data are from the UN's median predictions (United Nations 2014).
Download figure:
Standard image High-resolution image
Table 2. Per capita emissions based on the pledges together with a 2 °C (>66%) temperature limit (tCO2/capita).
| 2014 | 2020 | 2030 | 2050 | |
|---|---|---|---|---|
| USA | 16.9 | 14.7 | 10.2 | 2.5 |
| EU | 6.4 | 5.8 | 4.9 | 1.7 |
| China | 6.9 | 7.3 | 6.8 | — |
| Rest of the World | 3.5 | 2.8 | 0.7 | — |
| Global | 5.0 | 4.4 | 2.4 | 0.5 |
It is clear from our analysis that the EU, US, and Chinese INDCs are not consistent with the 2 °C goal. If the INDCs are not strengthened in the near future, then even if the INDCs are met, they should be expected to lock the world into a higher long-term temperature increase based on the best current scientific understanding and without negative emissions (carbon removal). Under these assumptions, we find that the EU, US, and Chinese INDCs are more consistent with a temperature increase of 3 °C with a >66% chance (supporting material).
Discussion
Methodological aspects
The cumulative emissions approach provides a powerful framework for comparing ambition and fairness, but it is not without its weaknesses. The main weakness is the treatment of non-CO2 gases in the analysis. The IPCC showed that cumulative emissions of CO2 largely determine global mean warming by the late 21st century and beyond (IPCC 2013), and hence cumulative carbon is critical for the long-term attainment of any selected climate target. Non-CO2 emissions are expected to make larger contributions in the near term, and lead to increased warming for a given amount of cumulative carbon across the scenarios assessed in IPCC. We accounted for non-CO2 forcing when estimating the remaining global quota (Rogelj et al 2015), but we did not attempt to estimate non-CO2 pledges at the country level. However, most INDCs, or pledges in general, cover more than CO2. Including country-level non-CO2 into the analysis, using the cumulative emissions framework, would require some form of weighting of non-CO2 components (Myhre et al 2013). A challenge with using standard emission metrics, such as the Global Warming Potential, is that the fixed time horizon becomes less relevant when one is nearing a temperature target (Shine et al 2007). One approach could be to share the 'remaining' temperature to reach 2 °C, but then countries would be given a difficult task of how to allocate the temperature quota over time and amongst different greenhouse gases. If the cumulative emissions framework is not used, then analysis of non-CO2 contribution is more straightforward (UNEP 2014).
We have not included LUC in our sharing, but instead removed future LUC from the remaining quota, assuming that future LUC emissions would linearly decline. While the inclusion of LUC is technically straightforward, the main challenge is country-level LUC data that is consistent over time and between countries. The EDGAR data, for example, does not have full coverage of LUC and is inconsistent with other datasets (Tubiello et al 2015). The Global Carbon Project does not provide LUC by country (Le Quéré et al 2015). The IPCC only estimated regional LUC for the five IPCC regions (Blanco et al 2014). Others have made attempts to include LUC by country (den Elzen et al 2013). Due to a lack of reliable historical data at the country level, we have not included LUC in our current analysis.
Policy aspects
Current negotiations have focussed on country pledges of emission reductions, and the agreement between China and the US has been hailed as a major first step on a long road. Issues such as adaptation and loss and damage are particularly important to a large number of developing countries. It is clear that if 2 °C is to set the level of global ambition, commitment to deep, long-term mitigation must also be a core component of a Paris agreement, implying a radical transformation of the global energy system.
Even though the EU and US commitments are not too far removed from the inertia fairness measure, it is clear that the EU and USA would require much more ambitious targets to meet a wider range of fairness measures (e.g. equity). As an emerging economy, it will be challenging for China to balance economic growth within a 2 °C temperature limit. China accounted for 27% of global 2014 emissions and has relatively high per capita emissions, values that remain high even after adjusting China's emissions for exports and imports of goods and services (Le Quéré et al 2015). China's INDC is a long way from both measures of fairness used here. Incorporating other measures of fairness such as historical contributions would make the task for China easier, but harder for some other countries (Raupach et al 2014). Alternatively, under a higher temperature level of 3 °C with a >66% chance (supporting material) China's INDC may become fair and ambitious.
Regardless of the (implicit or explicit) method of sharing applied, the same global emission reductions are necessary if 2 °C is to be avoided. It could be argued that a push for greater ambition can reduce the credibility of pledges and erode political capital. By any measure, the global challenge is immense, requiring a technology revolution (Hoffert et al 1998, Galiana and Green 2009) and a complete decarbonization of the global economy by the second half of this century (Clarke et al 2014). The need for deep mitigation highlights the importance of zero-carbon energy sources (Hoffert et al 2002, Caldeira et al 2003, Davis et al 2013) and technologies that remove carbon from the atmosphere (Fuss et al 2014). The rapid scale up of renewable-energy technologies is critical, but the recent IPCC report highlights (Clarke et al 2014) the essential role of large-scale deployment of Carbon Capture and Storage (CCS) and bioenergy linked to CCS (BECCS). These technologies are immature (CCS) or untested (BECCS), but are the foundation of most scenarios consistent with 2 °C (Fuss et al 2014).
Our analysis suggests that a critical ingredient that is missing from current negotiations is the need for a greatly increased focus on advancing research and development on low-, zero- and negative-carbon energy sources (Barrett 2009). A limited number of countries are responsible for a large fraction of global energy innovation (Victor 2011); among these are the US, EU, and China. Pledges by those countries and others toward research and development (R&D) efforts would be a unique long-term contribution to global climate goals. Further, research indicates that a greater focus on technology development may facilitate negotiations (Schmidt 2015) and partially compensate for non-optimal climate policies (Bertram et al 2015). We believe a Paris agreement that is fair and ambitious needs to reflect deep mitigation in INDCs, strong agreements on adaptation and loss and damage in view of the high risk of exceeding 2 °C given current trends, and a companion set of pledges on technology research and innovation.
Acknowledgments
GPP and RMA were supported by the Research Council of Norway projects 236296 and 209701. SS was supported by the Ellen Swallow Richards Professorship at MIT. PF was supported by the European Commission's 7th Framework Programme (EU/FP7) under Grant Agreements 282672 (EMBRACE) and 603864 (HELIX).