


Abstract
Fire is one of the most prevalent disturbances in the Earth system, and its past characteristics can be reconstructed using charcoal particles preserved in depositional environments. Although researchers know that fires produce charcoal particles, interpretation of the quantity or composition of charcoal particles in terms of fire source remains poorly understood. In this study, we used a unique four-year dataset of charcoal deposited in traps from a native tallgrass prairie in mid-North America to test which environmental factors were linked to charcoal measurements on three spatial scales. We investigated small and large charcoal particles commonly used as a proxy of fire activity at different spatial scales, and charcoal morphotypes representing different types of fuel. We found that small (125–250 μm) and large (250 μm–1 mm) particles of charcoal are well-correlated (Spearman correlation = 0.88) and likely reflect the same spatial scale of fire activity in a system with both herbaceous and woody fuels. There was no significant relationship between charcoal pieces and fire parameters <500 m from the traps. Moreover, local area burned (<5 km distance radius from traps) explained the total charcoal amount, and regional burning (200 km radius distance from traps) explained the ratio of non arboreal to total charcoal (NA/T ratio). Charcoal variables, including total charcoal count and NA/T ratio, did not correlate with other fire parameters, vegetation cover, landscape, or climate variables. Thus, in long-term studies that involve fire history reconstructions, total charcoal particles, even of a small size (125–250 μm), could be an indicator of local area burned. Further studies may determine relationships among amount of charcoal recorded, fire intensity, vegetation cover, and climatic parameters.
Export citation and abstract BibTeX RIS
1. Introduction
Fire is a major force in Earth systems and has played a significant role in ecosystem functioning (Bowman et al 2009) since Paleozoic times (Scott and Glasspool 2006) with documented evidence since Mesozoic times (Keeley et al 2011). Particularly since the mid-Tertiary period, the combination of grasses and frequent fires helped create open vegetation structures (Bond and Wilgen 1996) and maintained them over millennia (e.g. Cheney and Sullivan 2008). The natural frequency of grassland fires can range from annual to multi-decadal (Whelan 1995), and knowing this historical fire return interval is essential for determining current management practices, which can include both fire suppression and prescribed fire (Chandler et al 1983, Reichman 1987). Typically, characteristics of fire regimes from century to millennial timescales are reconstructed from fire-scars on trees or from charcoal particles produced by fires and deposited in sediments. However, interpreting charcoal particles to reconstruct fire return interval as well as other characteristics of fire regimes is not straightforward (Iglesias et al 2015). With fire regimes possibly changing under future climate conditions (Westerling et al 2006, Bowman et al 2009), researchers need to study past and present fire events and to calibrate charcoal production, notably in grassland systems.
Paleofire reconstructions require a robust method for analyzing high-resolution charcoal series in lake or peat sediments (Whitlock and Anderson 2003). In forested areas, charcoal stratigraphy is often decomposed into peak and background components, such that peaks indicate fire episodes (Higuera et al 2011). However, charcoal amount does not reflect fire history per se; thus correlating the charcoal signal to the fire activity may be inconsistent and potentially biased by environmental parameters acting on charcoal production, transport, and deposition (Patterson et al 1987). Fire-history reconstructions in non-forested ecosystems such as grasslands or savannas are based on variations in overall charcoal abundance (e.g. Brown et al 2005, Nelson et al 2006, Behling et al 2007). Because non-forested areas burn frequently, with fire return intervals from <1 year to 12 years reported for tropical grasslands, temperate grasslands and scrublands (Archibald et al 2013), it is almost impossible to separate charcoal peaks from background influx (Clark et al 2001, Brown et al 2005). Indeed, sampling resolution in sediment cores is often lower than the fire return interval in many grassland systems, which prevents detection of individual fire events (Nelson et al 2012).
Although grassland ecosystems represent 40.5% of terrestrial area (White et al 2000), long-term fire history in these ecosystems remains poorly understood because fire frequency in these ecosystems is sometimes too high to be detected in paleo-records. For these reasons, initial calibration studies in the South African savanna (Duffin et al 2008) and in tropical ecosystems in Central Africa, hereafter Afrotropics (Aleman et al 2013), highlighted a relationship between charcoal amount and fire area, intensity, and fuel sources from sedimentary charcoal records but not fire frequency. The relationship between charcoal and fire activity in these subtropical systems might not be applicable to all non-forested environments due to variation in vegetation cover, species richness, biomass productivity, and climatic conditions (White et al 2000). To our knowledge, no calibration studies between fire events and charcoal production exist for North American grasslands.
Natural wildfire occurrence in the midcontinent is associated with surface frontal weather systems that occur during the northern hemisphere spring season (Brotak and Reifsnyder 1977). The lack of precipitation and strong low-level winds associated with these fronts can produce large and fast-moving fires. Prescribed fires occur under a restricted set of precipitation, temperature, and wind conditions. Prescribed fires are an important part of management practice for North American grasslands, based on the assumption that high frequency and low intensity fires have characterized the fire regime of temperate grassland ecosystems for millennia (Knapp et al 1998). Most of the information about historical fire return interval in grassland ecosystems comes from fire scars on trees at the edge of prairie (Allen and Palmer 2011). These dendrochronological records are not generally of sufficient duration to assess the millennial dynamics of fire history of those ecosystems. To fill this gap of knowledge, researchers need to better understand how charcoal can reconstruct fire history from high-resolution sedimentary records (Grimm et al 2011).
Here, we present results from a unique, 4-year fire monitoring dataset in the northern Flint Hills ecoregion, in central North America, specifically eastern Kansas, to investigate the amount, size, and composition of charcoal particles produced by grassland fires in this region. We analyzed a variety of predictive environmental and fire variables to explain the charcoal particle abundance recorded in these mixed fuel-source landscapes. Our objective is to improve methods to interpret charcoal data in sedimentary paleorecords of non-forested regions, especially tallgrass prairie. A better understanding of the long-term fire history of this ecosystem could provide useful tools to help stakeholders manage and restore the tallgrass prairies of central North America, as well as other temperate grasslands.
2. Data and methods
2.1. Study site and Tauber traps
2.1.1. Study site
The Flint Hills ecoregion (37°17'00''N 96°40'31''W, figure 1) is the largest remaining contiguous tallgrass prairie ecosystem in North America, encompassing over 50 000 km2 throughout much of eastern Kansas from near the Kansas–Nebraska border south into northeastern Oklahoma. The region has shallow soils developed on limestone and shale that prevented agricultural land use and these edaphic conditions preserved the tallgrass prairie, despite being grazed by bison and cattle. The current climate conditions provide enough moisture to support woody plants such as Quercus, Celtis, and Juniperus, and grassland is frequently and extensively burned throughout the region to maintain open conditions (Reichman 1987). The study site of Konza Prairie (39°05 'N, 96°35'W, figure 1) is in the Flint Hills region of northeastern Kansas (hereafter, 'Konza'). Konza is a 3500 hectare native tallgrass prairie preserve, dominated by perennial C4 grasses, such as Andropogon gerardii, Sorghastrum nutans, Panicum virgatum and Schizachyrium scoparium. However, woody species have been increasing dramatically in abundance during past decades, both at Konza and in the Flint Hills region in general (Briggs et al 2005, Middendorf et al 2009, Flint Hills National Wildlife et al 2010). A replicated watershed experiment at Konza (figure 1) explicitly incorporates the major factors influencing mesic grasslands, specifically fire return interval and grazing by the native herbivore, bison (appendix 1, Reichman 1987).

Figure 1. Map of the Konza Prairie study site and experimental design. The Flint Hills tallgrass ecoregion in United States, and the Konza Prairie Biological Station within the Flint Hills region are also shown. The 28 Tauber traps are represented with black dots; dashed rings around traps correspond to a 500 m radius distance; color of watershed corresponds to the fire return interval (expressed in years between fires) calculated from fire events archives since 1972 (see appendix 1 and table S1).
Download figure:
Standard image High-resolution imageContrary to the region, which is mostly flat and characterized by shallow soils, the Konza Prairie is topographically complex (320–444 m asl) with soil type and depth varying with topographic position. In general, lowland soils are silty clay loams of thick colluvial and alluvial deposits extending up to 2 m deep while hillside and upland soils are much shallower. These soils overlay as many as ten distinct layers of alternating limestone and shale, contributing to the site's complex subsurface hydrology.
2.1.2. Tauber traps
Twenty-eight modified Tauber pollen traps were deployed in October 2008 at the end of the growing season (figure 1) primarily to collect airborne pollen, spores, and dust (Tauber 1974). In this study, we focused on the charcoal particles trapped in these collectors for the period 2011–2014 (table 1). We determined where to place the traps, at least 500 m apart, using a randomized GIS algorithm balancing accessibility (i.e. proximity to roads), elevation, equal coverage of grazed and ungrazed locations, and even distribution throughout the watersheds. The position of the traps at different elevations, in different vegetation assemblages, fire frequencies, and grazing activities allowed us to test the role of the landscape configuration, vegetation, fire and grazing activity on the amount, type and size of charcoal particles recorded. Moreover, the different seasons of prescribed burns, and the four-year duration of the charcoal record allowed us to test the role of climate conditions during the fire activity on the charcoal particles recorded.
Table 1. Data set used in analyses: charcoal measurements, fire parameters, vegetation surrounding the traps, landscape situation of the trap and climatic data.
|
Note: by trap and by year columns indicate if the data are available per year, per trap or both. Lines colored in gray correspond to non-numerical parameters, text colored and in bold correspond to parameters for the random forest analysis. For more explanation on data acquisition and transformation refer to appendix 1.
2.2. Charcoal data
We collected trap contents annually at the end of October from 2011 to 2014 and sieved them, with 1 mm mesh to eliminate large fragments of plants, insects, and rocks. The filtrate was then passed through a 125 μm sieve and a 250 μm sieve. Each sample was treated with H2O2 for 24–72 h to increase the visibility of black charcoal pieces.
In this study, we analyzed both the smallest charcoal pieces (125–250 μm) and the largest (250 μm–1 mm), considered in the literature as a proxy of regional or local fire history, respectively (appendix 1). We also calculated total charcoal pieces from 125 μm to 1 mm, as is very commonly measured in lacustrine sediments (table 1, appendix 1). Additionally, because of the presence of both herbaceous and woody fuel sources at this site, we identified the morphotype of each charcoal piece according to Jensen et al (2007) and Tweiten et al (2009), looking for six charcoal morphotypes: dark, branched, porous and sponge reflect woody fuels, and fibrous and cellular reflect herbaceous fuels (appendix 1). The herbaceous types (non arboreal morphotypes) were lighter and thinner than the woody types (arboreal morphotypes) particularly the dark morphotype, which was dense and blocky (Jensen et al 2007). We also calculated non arboreal charcoal amount (NA) and a ratio of non arboreal to total (NA/T) charcoal pieces (table 1, appendix 1). Notably, these charcoal morphotypes have been identified in forested areas, with different herbaceous species, in the north-middle portion of the United States (Jensen et al 2007, Tweiten et al 2009), and so may not perfectly match the morphotypes produced by tallgrass prairie species. Although charcoal morphology classification needs more work, specifically in biomes outside of the midwestern United States, it is a powerful tool to assess fuel sources, and has been used in numerous recent studies (e.g. Courtney Mustaphi and Pisaric 2014, Morris et al 2014).
2.3. Environmental data and fire parameters
We collated all fire parameters available, relating to both spatial and temporal scale, to compare with our different charcoal measurements (table 1, appendix 1). Records of fire history have been kept locally at Konza since 1972, and regionally in the Flint Hills since 2010, and both areas are managed with prescribed fires. Prescribed burns at Konza are conducted at the watershed level first as a function of the time since last fire (i.e. 1, 2, 4, 10 or 20 years, or alternatively three consecutive years of burn followed by three of no burn) or the amount of rainfall (120% of the normal amount) (Reichman 1987). In contrast, Flint Hills prescribed burns are conducted by landowners based on information about weather conditions (ksfire.org), including wind speed (8–20 km h−1), relative humidity (40%–70%), temperature (12 °C–25 °C ± 5 °C), and cloud cover (clear to 70%). Most prescribed burns are conducted in the spring season, during late March through early May. The duration of a single prescribed burn event is usually short, ranging from a few hours up to a few days.
Climatic data came from Konza Prairie Meteorological Station (39°04'56''N, 96°34'6''W, http://www.konza.ksu.edu) and consisted of a daily report of the maximum and minimum air temperature (measured at 2 m above ground), the maximum and minimum soil temperature (average of measurements at 5 and 10 cm below ground), the wind speed maximum (averaged of maximum wind speed measured at 2 m and 10 m above ground), the relative humidity (measured at 2 m above ground), precipitation (cumulative), the solar radiation (accumulated global incoming radiation) and the evapotranspiration (hereafter ETo) (appendix 1). These variables at the time of fire initiation have been shown to influence fire behavior in other studies, and they are available for the entire four-year study period. The maximum distance from the meteorological station to any Tauber trap location is 6 km. The minimum distance is 0.5 km.
Because no long-term records of fire intensity or severity exist, we estimated the fuel burned (hereafter, fuel burn estimation), which reflected the quantity of fuel near each trap and thus the potential proportion of vegetation burned (appendix 1). We measured vegetation composition surrounding each trap in 2012, compiled climatic parameters for each fire event during the four years of charcoal records, and assessed the physical position of the traps (table 1, appendix 1) because these factors have a potential role (direct or indirect) on charcoal production, transport, or deposition (appendix 1).
2.4. Data analysis
We used multivariate analyses to visualize the relationships among environmental parameters, fire parameters, and charcoal measurements. Because our dataset included both quantitative and qualitative variables (table 1), we used a Hill and Smith analysis (Hill and Smith 1976) to identify a specific set of variables that avoid redundancy. We also used a principal component analysis (PCA) to visualize the relationships among charcoal measurements, with the exception of the NA/T ratio, which is simply calculated from NA types and total amount.
We used correlations to quantify potential linear relationships (i) between charcoal pieces from 125 to 250 μm and from 250 μm to 1 mm and (ii) between total charcoal pieces, NA or NA/T, and three fire parameters (area burned within 500 m radius distance of traps, fuel burn estimation, and time since last fire).
Next, we used random forest analyses (Breiman 2001) to assess the importance of non-redundant parameters (bold in table 1) in predicting total charcoal pieces and NA/T ratio. Random forest is a decision-tree based method that allows for both continuous and categorical variables. It consists of a large set of decision trees, using a bootstrapped set of samples for each tree, permitting an assessment of the predictive skill of the overall forest by estimating the values of the out-of-bag samples. In addition, in each tree, splits in the dataset are made using only a random subset of samples. Thus, any given variable's importance can be estimated as the reduction in predictive skill for trees that do not use that variable. For regression trees, where the outcome variable is continuous, importance is calculated as the percentage increase in mean squared error (MSE) for trees without that variable. Thus, large positive MSE values indicate the variable is predictive, whereas zero or negative importance values identify variables not predictive (either they are not predictive as a random variable, or they decrease prediction ability). The random forest analysis was run on trees with the regression method, with four variables randomly sampled as candidates for each split and five permutations of the data out-of-bag per tree for assessing variable importance.
3. Results
3.1. Multivariate analyses reveal redundancy in parameters
3.1.1. Fire, vegetation, and climate parameters
The Hill and Smith analysis identified two main axes of variation and identified several redundant variables (figure 2). Of the original 42 variables, 18 of them related to environmental parameters, 14 were fire parameters, and 10 were charcoal measurements. To identify the variables most likely to predict charcoal data, and to avoid repetitive information, we reduced the number of environmental and fire parameters from 32 to 20 (table 1, bold colored parameters). Additionally, to keep one set of parameters per trap and/or per year (appendix 1), we did not further consider information related to the Konza watersheds.
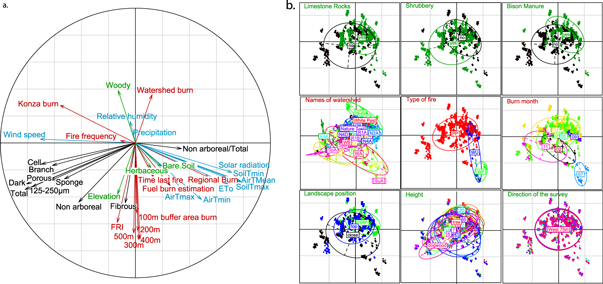
Figure 2. Ordination plots of charcoal measurements and environmental parameters. (a) Hill and Smith multivariate analysis of numerical data. Black text and arrows correspond to different charcoal measurements vectors, red to fire parameters, green to vegetation or soil cover (environmental variables), and blue to climatic parameters (table 1). (b) Nine non-numerical environmental variables comprising several modalities (e.g. yes/no). Each variable modality is represented by point class defined by the mean and the standard deviation values of numerical data distribution (dots) on the Hill and Smith axes ordination plot (table S1). Landscape position: top = trap situated on the top of a hill, close = in a closed watershed, open = in an open watershed. Type of fires: PP = prescribed burn planned, WU = wildfire burn unplanned for a given year, WP = wildfire burn planned for a given year. Direction corresponds to vegetation survey (North, South, East, West at 25, 50, 75 and 100 m for each trap).
Download figure:
Standard image High-resolution imageAxis 1 (explanatory variance of λ = 7.1%) was mainly explained by climatic parameters and charcoal measurements, whereas axis 2 (λ = 5.3%) was more representative of fire, vegetation, and landscape parameters (figures 2(a) and (b)). The low explanatory percentage cannot suggest the relationship between variables; however, the ordination plots highlighted highly correlated and redundant information. For example, some numerical parameters were clearly grouped together, such as area burned within 100–500 m radii of each trap, and a group of temperature variables including solar radiation, soil temperature, and air temperature (figure 2(a)).
The utility of the qualitative parameters also varied. Variables positioned at the intersection of both axes (figure 2(b)), such as height or direction of the survey, provided little useful information, whereas the four field survey parameters (limestone rocks, shrubbery, bison manure, and landscape position) varied significantly among the traps. The fire parameters may explain the type of burn categories, which showed that wildfires (WU and WP, the two categories of unplanned wildfires) are well-segregated from prescribed burns (PP). However, the wildfires are not suppressed when they occur during the fire season scheduled. Few watersheds were planned to burn during the summer (SuA and SuB, table S1), which differentiated them from the rest of the watersheds.
3.1.2. Charcoal measurements
We examined co-variation amongst the 10 charcoal variables using PCA and found two main axes of variation (figure 3(a)): (i) total and 125–250 μm charcoal correlated with three woody charcoal morphotypes (dark, sponge and branched) and (ii) non arboreal charcoal correlated with herbaceous morphotypes (cellular and fibrous) and the porous morphotype. The number of non arboreal charcoal pieces was independent of the total count, 125–250 μm fraction, and dark form. Therefore, we decided to keep the total charcoal and the non arboreal count of charcoal as representative of the charcoal variations in our record. Because many studies use counts of 125–250 μm charcoal (Whitlock and Larsen 2002, Higuera et al 2007) and because the non arboreal/total ratio indicates the portion of non arboreal charcoal types, we also chose to keep these two metrics for further analyses.

Figure 3. Comparison between charcoal measurements including charcoal morphotypes, and number of charcoal pieces (total amount of charcoal pieces and 125–250 μm range size). (a) Principal component analysis of charcoal measurements. Axis 1 of the PCA (PCA 1) explained 49% of the data and axis 2 (PCA 2) 17%. Non arboreal charcoal morphotype corresponds to the sum of fibrous, porous, and cell charcoal types. (b) Boxplots of charcoals measurements represent the median, first, and third distribution quartiles of charcoal amounts. (c) Linear regression (red line) between 125–250 μm and 250 μm–1 mm charcoal pieces size range (black dots) with 90% of confidence intervals (dashed lines).
Download figure:
Standard image High-resolution imageThe dark morphotype, which reflects woody fuel sources, represented 80% of the total amount of charcoal record in the traps compared to non arboreal charcoal morphotypes, which constituted only 19% (figure 3(b)). Other woody fuel source morphotypes (porous, branched and sponge) had values close to zero (figure 3(b)) suggesting that woody fuels were mainly represented by dark morphotype values, as well as in the total charcoal category and the 125–250 μm fraction. These three types had the most abundant variables with a median from 1000 to 1500 pieces (figure 3(b)). Meanwhile, non arboreal counts had much lower abundance values (median from 100 to 500 pieces, figure 3(b)), but represented other variations in the data.
We were not able to include the largest charcoal range size (250 μm–1 mm) in the analyses, as this was not collected in 2012. However, the 125–250 μm and the 250 μm–1 mm size ranges were strongly positively correlated (r2-adjusted = 0.67, p-value < 0.001, Spearman correlation ρ = 0.88, figure 3(c)), indicating that small and large charcoal particles co-varied and likely provide similar information.
3.2. No correlation exists between charcoal count and fire parameters
To explore the complex relationship between charcoal amount and fire regime parameters, we tested relationships among charcoal measurements and fire parameters at the scale of 500 m radius around each trap. At this fine scale, data were available per trap and per year, which constituted sufficient points to test a linear relationship. For each of the three retained charcoal variables, i.e. total amount of charcoal pieces, non arboreal charcoal morphotypes, and NA/T ratio, we tested a linear relationship with (i) the area burned (a spatial component of fire regime), (ii) the time since last fire, (a temporal component of the fire regime) and (iii) the severity of fire on vegetation by the fuel burn estimation reflecting the potential proportion of vegetation burned. We also tested the linear relationship between the three charcoal variables and the fire frequency, another temporal component of the fire regime (figure not shown). None of the charcoal variable was significantly correlated to any of the fire parameters within a 500 m radius distance, i.e. the area burned (figures 4(a)–(c)), the proportion of vegetation burn (figures 4(d)–(f)), or the two temporal parameters of the fire regime (time since last fire, figures 4(g)–(i), or fire frequency figure not shown).

Figure 4. Correlation plots between charcoal measurements and fire parameters. Charcoal measurements are on the y-axis: total number of charcoal pieces (a), (d), (g); non arboreal charcoal type corresponding to the sum of cell, porous and fibrous morphotype amounts (b), (e), (h) and the ratio of non arboreal to total charcoal (c), (f), (i). Fire parameters are on the x-axis: the burn area in the 500 m radius distance of each trap (a), (b), (c); the fuel burn estimation (the number of years since the last fire multiplied by the area burn in the 500 m radius around a given trap) (d), (e), (f) and the time since last fire corresponding to the number of years since the last fire in the 500 m radius distance of a given trap (g), (h), (i).
Download figure:
Standard image High-resolution image3.3. Importance of variables for predicting charcoal count
Analysis of variable importance using the random forest method with total charcoal amount as the outcome identified four explanatory variables with a large increase in MSE when removed (figure 5): regional burn (14%, corresponding to the Flint Hills burned area per year), Konza burn (12%, representing the Konza Prairie burned area per year), elevation of trap (10%), and presence of bison manure (8%). The partial dependency plots show the response changes in a given explanatory variable with other variables held constant. Total charcoal showed little variation for most values of the regional Flint Hills burn area, but increases sharply when regional area burned drops below 3000 km2 (figure 5(b)). That means that the more an area is burned regionally, the fewer charcoal pieces are in traps. In contrast, total charcoal increased sharply when the local Konza burn increased beyond 19.5 ha (figure 5(c)), which means the larger the local area burned, the higher the number of charcoal pieces. Both of these parameters varied annually, which indicates that total charcoal pieces are better predicted by temporal parameters, which vary annually, than by spatial parameters, which vary between traps. Indeed, total charcoal was not an indicator of fire parameters at a scale <500 m and was relatively insensitive to environmental or climate variables (figure 5(a)). Moreover, the elevation where the trap was placed was positively linked to the total amount of charcoal, which indicates that the traps placed at high elevations collect a large amount of charcoal (figure 5(d)). On the other hand, if bison were reported in the 500 m radius of traps (as indicated by bison manure), charcoal pieces were less abundant (figure 5(e)). Analysis of the 125–250 μm size range charcoal count as an outcome variable displayed the same results (figure not shown).

Figure 5. Explanatory proportion of relevant variables for the total charcoal. (a) The percentage of importance of each variable for the total charcoal count. Variables presenting a partial dependence over 5% of importance (vertical line) have been plotted on the right side (b), (c), (d) and (e). The y-axis of the partial dependent plot represents the number of charcoal pieces, and the x-axis the values corresponding to the explanatory variable taken into account, i.e. the regional burn area is expressed in km2, the Konza burn area in hectares, the elevation in meters, and the bison manure as a presence/absence. AirTMean = 8 days averaged of air temperature after a fire event; the fuel burn estimation = the number of years since the last fire multiplied by the area burn for watershed in the 500 m radius around a given trap.
Download figure:
Standard image High-resolution imageThree parameters showed high variable importance scores, which explained variation in the NA/T ratio (figure 6(a)): local Konza burn (18% increase in MSE), regional Flint Hills burn (16% increase in MSE), and mean air temperature (6% increase in MSE). Partial dependency plots showed the relationship with the local Konza burn to be negatively correlated above 19.5 °C and positively correlated with the regional Flint Hills burn when this variable was less than 4000 km2. Also, the relationships with regional and local burn showed opposite trends compared to the results for total charcoal count and the regional Flint Hills area burned displayed a higher importance score than the local Konza area burned (14% and 12% increase MSE, respectively). However, similar to the results for the total charcoal, the NA/T ratio was better predicted by annual variations than by spatial variations among traps (figure 6(a)). In contrast, regional burn and NA/T were positively correlated, and local burn and NA/T were negatively correlated (figures 6(b) and (c)).

Figure 6. Explanatory proportion of relevant variables for the ratio of non arboreal to total charcoal. (a) the percentage of importance of each variable. Variables presenting a partial dependence over 5% of importance (vertical line) have been plotted on the right side (b), (c) and (d). The y-axis of the partial dependent plot represents the ratio values, and the x-axis shows the values corresponding to the explanatory variable taken into account, i.e. the Konza burn area is expressed in hectares, the regional burn area in km2, and the mean air temperature in °C. AirTMean = 8 days averaged of air temperature after a fire event; the fuel burn estimation = the number of years since the last fire multiplied by the area burn for watershed in the 500 m radius around a given trap.
Download figure:
Standard image High-resolution image
The relationship with air temperature (AirTMean), showed a threshold with little variation below approximately 10 °C, but variation increased linearly beyond 10 °C (figure 6(d)). This increase of NA/T beyond 10 °C indicates that high air temperature led to more charcoal pieces recorded.
Finally, none of the variables had high importance scores (<5%) in the random forest analysis to explain variation in non arboreal charcoal count.
4. Discussion
This study highlights the main variables acting on charcoal production in the tallgrass prairie of North America, a grassland ecosystem that frequently burns. No direct relationships between charcoal production and fire variables <500 m around the trap were found, as indicated by non-significant correlations (i) between different measurements of charcoal and (ii) between total, non arboreal charcoal or NA/T ratio and fire parameters (burn area at 500 m distance from the trap, fuel burn estimation, fire frequency and time since last fire). Ultimately, results from the random forest analyses show that total charcoal or NA/T ratio are most strongly predicted using fire parameters at a larger spatial scale and with environmental variables, both of which varied during each of the four years of the study.
4.1. Relevant charcoal measurements to study grassland fire regimes
In forested settings of the western US, large charcoal pieces (>125 μm) have been shown to originate from local fire events, and small charcoal pieces (>60 μm) from regional fire events (Whitlock and Larsen 2002). Because herbaceous fuels produce smaller charcoal pieces, some studies in grassland or savanna ecosystems have measured even smaller charcoal pieces, ca. 50–60 μm (e.g. Chang Huang et al 2006, Lupo et al 2006). Specifically, in African savanna ecosystems, 50 μm seems to be a threshold where charcoal count reflects fire proximity and intensity (Duffin et al 2008). In our study, we considered the smallest charcoal particle size to be 125 μm, following studies in temperate forests of North America that used this size (Jensen et al 2007, Tweiten et al 2009), and the widespread use of this size for fire regime reconstructions, even in non-forested ecosystems (Lynch et al 2004, Aleman et al 2013). Although the Tauber trap collection device is different from that for lake sediments, the 125 μm–1 mm charcoal size provides the best estimate of area burned.
Although small (125–250 μm) and large (250 μm–1 mm) charcoal particles were believed to reflect different spatial scales of fire events, we found a strong correlation (ρ = 0.88, figure 3(c)) between the two sizes. These two fractions seem to have similar aerodynamic behavior and to come from the same source area. Notably, the larger size range (250 μm–1 mm) is not present in many lake sediment samples, suggesting little transport of large charcoal particles from fire events (Higuera et al 2007). Many paleofire reconstructions based on lake sediment analysis measured either the 125–250 μm fraction or particles over 125 μm (Lynch et al 2004, Forbes et al 2006). In our record, the larger fraction (250 μm–1 mm) is present in all samples, but represents on average only 27% of total charcoal particles. Consequently, in the grassland environment, both total charcoal particles and the 125–250 μm fraction appear to be the most practical and useful charcoal parameters.
Interpretations of charcoal morphotypes have recently been developed, and appear especially applicable to mixed fuel source fire regimes (Morris et al 2014, Mueller et al 2014). Although our study site is considered a grassland, the most abundant morphotype in all samples was the dark one, which reflects woody fuel sources. This morphotype represents 80% of the total amount of charcoal particles in the traps, and the total non arboreal charcoal morphotypes constitute only 19% (figure3(b)). Pure herbaceous grassland covers 65% of Konza Prairie and, although forest constitutes only 6% of the landscape, other woody species, such as shrubs, form a significant land cover of 29% (Briggs et al 1997). The results suggest that either charcoal produced by herbaceous species are not well sampled by the traps, or that woody species produce a disproportionately high quantity of charcoal relative to their abundance in the landscape. Further, although the prescribed burns at Konza are conducted at the watershed level, possibly significant spatial heterogeneity of the burned material occurs.
Charcoal morphotypes, particularly the ratio of non arboreal to total charcoal, do not appear to be a direct indicator of available fuel sources. Again, major uncertainties manifest in the precise vegetation cover in each watershed, in how woody and herbaceous fuels actually burn during fire events, and in how charcoal is produced from these fires in proportion to the woody or herbaceous fuel burned. Further calibration of fire events, fuel sources, and charcoal morphotypes would be useful, similar to existing work in temperate forests (Jensen et al 2007, Tweiten et al 2009). Another morphological metric of charcoal particles, such as the elongated ratio (Umbanhowar and Mcgrath 1998) could help researchers distinguish fuel sources. Finally, burned phytoliths (silica pieces produced by vegetation) are also a good indicator of herbaceous fuel sources in grassland fires (Cordova et al 2011).
4.2. Total charcoal count reveals the local area burned
Total charcoal counts apparently link to variation in area of burned land on both local (Konza Prairie, figures 5(a) and (c)) and regional (Flint Hills, figures 5(a) and (b)) scales. Recent studies indicate that biomass burning can be reconstructed from background charcoal influx to sediment records from regional to global scales (Marlon et al 2008). However, the spatial relationships on the scale of our study showed the opposite trend and suggest that total charcoal is related to local area burned and not regional area. In South African savanna, Duffin et al (2008) demonstrated that larger fires produced more charcoal, they also showed that fire intensity was an important covariate. In the Afrotropics, Aleman et al (2013) correlated charcoal accumulation rate with biomass burned in the 5 km radius around a lake. Fire intensity was not measured in our study, thus we are not able to discuss this point, however, our results seem to confirm the results in the tropical areas that charcoal count is a function of local area burned. In contrast, charcoal morphotypes were predicted by the spatial scale of the regional burned area. In addition, in years with a large regional burned area, the non arboreal component increased; thus the NA/T ratio reflects the herbaceous fuel coming from the Flint Hills burns. This may reflect differences in vegetation composition on different scales: a third of Konza Prairie vegetation cover is woody, whereas the Flint Hills have larger, pure grassland areas.
The spatial scale of charcoal particles produced and deposited during grassland fires seems to be under 5 km. The relevant source area of charcoal is between 0 and 5 km for charcoal pieces >50 μm in the South African savanna (Duffin et al 2008) and for charcoal pieces >160 μm in the Afrotropics (Aleman et al 2013). In forested areas, charcoal particles >160 μm reflect a closer source area of fire, <1 km (Clark et al 1998, Lynch et al 2004). Here, our results demonstrate that the quantity of charcoal pieces >125 μm is well predicted by local fire, <5 km (Konza Prairie area = 35 km2), but that extremely local fires (within 500 m of the trap) are not reflected in charcoal counts. However, NA/T ratio represents mainly herbaceous fuel and correlates with the regional burn, >100 km (Flint Hills area = 50 000 km2). In addition, non arboreal morphotypes of charcoal, especially fibrous type, are lighter and thinner than arboreal morphotypes. The increase in NA/T ratio explained by the regional burning history could reflect a component of long-distance transport of charcoal.
4.3. Charcoal record is not sensitive to landscape, climate, or local vegetation variables
Landscape variables such as topographic position are important to fire behavior and charcoal production in several studies (Carcaillet et al 2007, Higuera et al 2010). Mechanisms by which landscape variables can influence charcoal production include local fire intensity, aerodynamics, and quantity of fuel. However, we found limited evidence of these factors in charcoal production at Konza. Two factors that did influence charcoal count were elevation of the traps and presence/absence of bison manure (figure 5(a)). High-elevation traps could record charcoal transport mainly by wind, whereas rain episodes can bring charcoal to lower elevation traps. Also, three factors could potentially reduce fuel load and so were measured within 100 m of the traps: bare soil, limestone rocks, and bison presence. Of these three factors, only the presence of bison within 100 m radius of the traps negatively influences total charcoal count (figure 5(e)), presumably through reduced biomass from grazing (Collins and Wallace 1990).
It is difficult to explain the lack of influence of climatic parameters on either total charcoal or NA/T ratio. Climate parameters such as temperature, precipitation, and relative humidity have proven important for fire activity through ignition, fuel quantity, and fuel condition (Whelan 1995, Bond and Wilgen 1996). However, because Konza and the Flint Hills are managed with prescribed fires, these fires took place within a specific set of weather conditions conducive to fires, limiting wind speed, relative humidity, temperature, and cloud cover. Conversely, prescribed fires in Konza are conducted according to a strict fire return interval independent of annual climatic factors (Reichman 1987). Thus, different temperature, precipitation, or relative humidity could have acted on the charcoal amount. Despite variation in cumulative annual precipitation from 478 to 754 mm over the four year study period, which could strongly influence biomass production (Knapp and Smith 2001), total charcoal seems not to be sensitive to those parameters (figures 5(a) and 6(a)). One climate variable did seem to influence charcoal production: high air temperature from the day of fire to the 8th day following the date of burn led to higher NA/T ratios. The range of temperatures leading to a prescribed burn, i.e. 12–25 °C ± 5 °C, matches with the increase in NA/T ratio (figure 6(d)).
Finally, the random forest analysis shows that woody vegetation is not an important variable to explain variations in total charcoal (4.41%, figure 5(a)), or NA/T ratio (1.48%, figure 6(a)). Thus, the local vegetation cover within 100 m of the trap did not predict NA/T ratio or total charcoal pieces. This result occurred despite considerable variation in vegetation composition, with woody cover ranging from 0% to 100%. Conversely, in the Afrotropics, Aleman et al (2013) reported a higher amount of charcoal in savanna than in forested areas, interpreted as preferential transport of small-size particles above the riparian forest. However, charcoal recorded in lake sediments is influenced by transport, dispersal, deposition/redeposition within the lake, and sediment mixing (Lynch et al 2004, Higuera et al 2007) while Tauber traps are considered to represent local source areas for the proxies that have been tested, including pollen (Hicks et al 2001) and spores (Gill et al 2013). Ultimately, we conclude that the charcoal collected in traps is primarily deposited by Aeolian processes, and that vegetation and fire conditions within 100–500 m distance of the traps are not reflected.
4.4. Implications for paleofire reconstructions in temperate grassland ecosystems
While most paleofire reconstructions are from forested areas (98% in the global charcoal database), it is important to understand the history of grassland fire regimes due to so much of Earth's surface being covered by grasslands, the frequency of fires in this biome, and the importance of fire in determining forest/grassland boundaries (Bond et al 2005). We have identified several metrics that may be useful in reconstructing these fire regimes as well as important limitations of traditional charcoal methods.
First, two different spatial scales are represented with different charcoal metrics: (i) total charcoal as well as charcoal from 125 to 250 μm clearly reflect fire within the <5 km scale area, and (ii) NA/T ratio mostly reflects the regional burned area >100 km. Thus, in sedimentary records of temperate grassland ecosystems, the amount of charcoal could be an indicator of the area burned, based on different spatial scales according to the measurement chosen.
Second, fire proximity <500 m and temporal variables of the fire regime (i.e. fire frequency and time since last fire) have very low predictive power for both charcoal counts and morphotypes. Consequently, variations in these charcoal variables should not be used as indicators of a change of fire frequency or to determine time since last fire in a grassland ecosystem.
Third, the version of the charcoal morphotype technique that we used does not directly correspond to available fuel sources as reflected in the landscape. While woody cover comprises 32% of Konza Prairie, woody charcoal morphotypes were >80% of the total amount of charcoal. However, NA/T ratio does seem to correspond with long-distance charcoal transport, reflecting a mostly herbaceous fuel source of the Flint Hills burns. We further suggest that the width to length of charcoal particles may provide a promising alternative to categorical morphotypes (Aleman et al 2013).
Fourth, total charcoal and NA/T ratio are relatively insensitive to climate conditions during a fire or vegetation types immediately surrounding the traps. Thus, the amount of charcoal cannot be interpreted directly either as an indicator of warmer and/or drier climate or as type of vegetation burned. However, the time scale of our study (four years) is very short compared to that of paleorecords. On multi-millennial timescales, changes in climate could be much larger and more important than those occurring in the few years of our record, thereby influencing charcoal parameters. While more work is necessary to calibrate fire events and charcoal production in grassland ecosystems, we suggest that at this point, paleoecological studies can effectively use total charcoal, even the small size of charcoal pieces (>125 μm), as a proxy of area burned.
There are diverse interpretations of grassland charcoal records ranging from changes in fire activity, fire frequency, area burned or climate. Although our dataset does not contain every potential fire variable, we have assembled a robust and large set of 27 predictor variables that capture much of the variation in charcoal production. Therefore, our study is an important quantitative step that demonstrated relationships between charcoal metrics and area burned, as well as variables that did not explain the charcoal record (fire frequency, environmental and climate parameters) for grassland environments.
Acknowledgments
We thank Julie Commerford for significant field, laboratory, and cartographic contributions. Also, many undergraduate and graduate students helped collect Tauber trap contents. We are grateful to the Konza Long-Term Ecological Research program for maintaining the burn treatments, historical records, and meteorological data. We thank E G Towne for helpful discussion and D Goodin for discussion of Flint Hills land cover. M Reekie and two anonymous reviewers provided helpful feedback that improved the manuscript. BL was supported by NSF DEB-1145815 to KM JM and SM were supported by NSF BCS-0955225 to KM. Publication of this article was funded by the Kansas State University Open Access Publishing Fund.