

Abstract
At present 4 of 10 dedicated rainfall observing satellite systems have exceeded their design life, some by more than a decade. Here, we show operational implications for flood management of a 'collapse' of space-based rainfall observing infrastructure as well as the high-value opportunities for a globally coordinated portfolio of satellite missions and data services. Results show that the current portfolio of rainfall missions fails to meet operational data needs for flood management, even when assuming a perfectly coordinated data product from all current rainfall-focused missions (i.e., the full portfolio). In the full portfolio, satellite-based rainfall data deficits vary across the globe and may preclude climate adaptation in locations vulnerable to increasing flood risks. Moreover, removing satellites that are currently beyond their design life (i.e., the reduced portfolio) dramatically increases data deficits globally and could cause entire high intensity flood events to be unobserved. Recovery from the reduced portfolio is possible with internationally coordinated replenishment of as few as 2 of the 4 satellite systems beyond their design life, yielding rainfall data coverages that outperform the current full portfolio (i.e., an optimized portfolio of eight satellites can outperform ten satellites). This work demonstrates the potential for internationally coordinated satellite replenishment and data services to substantially enhance the cost-effectiveness, sustainability and operational value of space-based rainfall observations in managing evolving flood risks.
Export citation and abstract BibTeX RIS

Content from this work may be used under the terms of the Creative Commons Attribution 3.0 licence. Any further distribution of this work must maintain attribution to the author(s) and the title of the work, journal citation and DOI.
1. Introduction
There is broad scientific consensus that floods are likely to increase in their severity and frequency at many locations across the globe, often impacting countries with limited capacity to adapt (Intergovernmental Panel on Climate Change 2014). Acceptable runoff predictions for operational forecasting and management of flood risk depend on satellite rainfall products in many portions of the world. Managing current and future flood risks requires a portfolio of space-based measurements that comprehensively cover the globe and reliably provide rainfall observations at high temporal resolution (National Research Council 2007, Hou et al 2008, National Research Council 2008, National Aeronautics and Space Administration 2010, National Research Council 2012a, b). This data challenge is of direct concern to any efforts supporting adaptation to evolving global flood risks. For example, the United States' (US) SERVIR program (National Aeronautics and Space Administration 2012), jointly led by the National Aeronautics and Space Administration (NASA) and the US Agency for International Development, is operationalizing the use of satellite precipitation data in flood management in global regions including East Africa, Southern Africa, Himalaya, and Mesoamerica. The SERVIR program is a key focus of NASA's direct support for climate services and adaptation (National Aeronautics and Space Administration 2010, National Research Council 2012b). These types of initiatives are growing in scope as the US Climate Data Initiative seeks to promote multi-agency information services that support climate adaptation and resilience (DATA.GOV 2014).
At present 4 of 10 dedicated rainfall observing satellite systems have exceeded their design life, some by more than a decade (National Research Council 2012b). This study explores the operational implications for flood management of a 'collapse' (National Research Council 2012b) of space-based rainfall observing infrastructure as well as the high-value opportunities for a globally coordinated portfolio of satellite missions and data services. Currently, there is not a sufficient understanding of how to prioritize and sustain international investments in observation systems that maximize the ability of vulnerable countries to protect themselves from floods. Global flood risk management poses a severe challenge, since many countries lack the economic resources and institutions (Moser 2009) needed to support operational forecasting (Ebert et al 2007, Lawford et al 2013) (e.g., comprehensive networks of ground-based observations, state-of-the-art radar, river forecasting centers, etc). International coordination and curation of rainfall products derived from space-based observations are critical to documenting and managing evolving hydrologic risks as well as facilitating global climate change adaptation (Ebert et al 2007, National Research Council 2009, National Aeronautics and Space Administration 2010, National Research Council 2012a, Intergovernmental Panel on Climate Change 2014).
This study provides a quantitative baseline for the space-based rainfall observations that are needed to maintain acceptable operational flood forecasting capabilities. Building on this baseline, we demonstrate even for a perfectly coordinated single rainfall data product from all current rainfall-focused missions (i.e., the full portfolio) significant data deficits vary across the globe that could preclude climate adaptation in locations vulnerable to increasing flood risks. Moreover, removing satellites that are currently beyond their design life (i.e., the reduced portfolio) dramatically increases data deficits globally and could cause entire high intensity flood events to be unobserved. Finally, we demonstrate that internationally coordinated replenishment of as few as 2 of the 4 lost satellite systems beyond their design life, yields rainfall data coverages that outperform the current full portfolio (i.e., an optimized portfolio of eight satellites can outperform ten satellites). The replenished portfolio demonstrates the potential value associated with internationally coordinating satellite portfolio planning and integrated multi-mission data services. These results quantitatively demonstrate that broader international coordination and investment in multi-mission design and information services can and should be explored to ensure that the global portfolio of space-based Earth rainfall observations are sufficient to manage the potential increased flood risks posed by climate change.
2. Data and methodology
The results presented here draw on three core methodological components: (1) a sensitivity analysis of the global variable infiltration capacity (VIC) hydrology model (Liang et al 1994 see supplementary figures SF1 and SF2, available at stacks.iop.org/ERL/10/024010/mmedia, Liang et al 1996, Cherkauer et al 2002), (2) astrodynamics simulations of the coverage performance of alternative portfolios of satellite missions, and (3) multi-objective optimization of the replenished portfolio. These respective methodological components are briefly summarized below in sections 2.1–2.3. Additional information is provided in the supplementary materials for this paper.
2.1. Global-scale hydrology sensitivity analysis
This study provides global estimates of the space-based rainfall data demands for attaining acceptable flood forecasts. The data demands are computed using a sensitivity analysis drawn from a 1000 member Monte Carlo ensemble of plausible parameter sets of the VIC global hydrologic model. Each plausible VIC parameter set ensemble member is used to simulate the hydrology within the model's 1° land grid cells. The initial 1000 member Monte Carlo VIC ensemble was conditioned using the Global Runoff Data Centre's observed annual mean runoff at each 1.0° grid cell to attain acceptable levels of error (Fekete et al 2002 see supplementary figure SF2). Across 7264 VIC grid cells, an average of 5% of the Monte Carlo VIC ensemble members were found to be behavioral. It is assumed that the reduced set of acceptable VIC ensemble members, termed the behavioral ensemble, provides a sufficient level of model fidelity to evaluate the satellite-based rainfall data requirements The Tropical Rainfall Measuring Mission (TRMM) multi-satellite precipitation analysis 3B42V7 data product (50 S–50 N) (Huffman et al 2007) and the Princeton global forcing data product (below 50 S and above 50 N) (Sheffield et al 2006) provided a virtual representation of the spatial and temporal dynamics and statistical structure of global precipitation. Multiple versions of the precipitation dataset were generated by successively sampling the precipitation observations over longer periods to simulate temporal resolutions for rainfall observations. The behavioral VIC ensemble members were subsequently forced by the succession of increasingly coarser rainfall datasets. For each behavioral VIC ensemble member the sensitivity to the temporal resolution of the rainfall data was computed as the Nash Sutcliffe efficiency (NSE) (Nash and Sutcliffe 1970) between the baseline surface runoff prediction attained with the maximum resolution precipitation forcing and the resultant predictions for the cases with reduced temporal efficiencies in every 1° grid cell. This calculation seeks to minimize the difference between the maximum data case and the subsequently reduced temporal resolutions. Each VIC model cell has multiple potential Nash Sutcliffe performance measures that result from the alternative plausible parameter sets corresponding to each of the behavioral ensemble members. The required rainfall temporal resolutions reported in our results represent the coarsest temporal resolution rainfall data possible while maintaining a 0.8 NSE relative to the full precipitation data baseline (see supplementary figure SF2).
2.2. Astrodynamics mission simulations
The astrodynamics simulations of alternative rainfall focused satellite portfolios exploit the Spacecraft High-fidelity Astrodynamics Resource Kit (SHARK) simulation (Vallado 2001, Montenbruck and Gill 2005, Ferringer et al 2014), which predicts the satellites' motion as a function of time. These low earth orbit missions are intermittent coverage constellations, which have complex distributions of data gaps (Hou et al 2008). Consequently, Earth coverage is not an easily characterized statistically distributed parameter (Lo 1999) (e.g., it is non-Gaussian). It is necessary to accumulate the satellite overpasses or gaps into metrics that allow for the evaluation of the quality of coverage. The Revisit software (Ferringer et al 2007, Ferringer et al 2014) uses the position vector information from the SHARK simulation to determine visibility to ground locations and computes coverage statistics for multi-sensor, multi-constraint satellite constellation architectures. Several of the most common metrics are maximum revisit time, average revisit time, maximum coverage gap, mean coverage gap, percent coverage, daily visibility time and mean response time. In this study, we are seeking to minimize global worst case data gaps, computed as, the worst case maximum revisit time within each VIC cell in the 1° global grid.
2.3. Multi-objective replenishment optimization
The actual multi-objective optimization was accomplished using a massively parallel multi-objective evolutionary algorithm that has proven effective for a variety of challenging applications, including satellite constellation design (Reed et al 2008, Ferringer et al 2009). Our multi-objective analysis explored two primary objectives: (1) minimize the number of satellites required in the replenishment and (2) minimize the global maximum coverage deficit. The term coverage deficit represents the difference between the required rainfall observation period attained in VIC sensitivity experiment and the Revisit-based estimate of the worst case temporal data gaps that result across the globe for a particular satellite portfolio (see illustrated example coverage deficit in supplementary figure SF3). The VIC and Revisit measures are computed independently. The maximum temporal data gaps occur due to the visibility limits implicit to the orbital dynamics of the ten current precipitation missions. This coverage deficit is computed for each grid cell in the 1° global grid used for the hydrologic sensitivity analysis described in section 2.1. It should be noted that this data gap analysis is optimistic in that it only accounts for satellite visibility constraints and neglects other potential sources of data loss such as data communication failures, sensor constraints, and the conflicting requirements for individual mission agencies. Efforts to reduce coverage deficits would serve to increase the temporal resolution of rainfall observations as well as reduce unwanted gaps or variation in the data.
3. Results and discussion
Figure 1 shows the required temporal resolution for satellite-based rainfall observations to maintain acceptable model-based flood predictions. These results are drawn from a large scale computational sensitivity analysis (see figures SF1 and SF2) that quantifies how quickly predictions of surface water runoff degrade with reductions in the temporal resolution of satellite rainfall data. Acceptable runoff predictions require satellite rainfall products that comprehensively cover the globe and reliably provide rainfall observations at high temporal resolution. The results in figure 1 indicate that operational flood management requires reliable access to high temporal resolution rainfall data (i.e., minimal gaps and/or minimal variability in data availability). The rainfall data requirements in figure 1 also provide a baseline for evaluating whether the current global portfolio of rainfall missions (see table 1) can reliably provide this temporal resolution for maintaining acceptable runoff predictions.
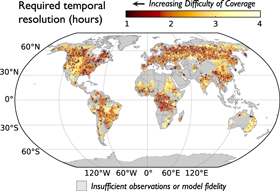
Figure 1. The required temporal resolution of satellite precipitation. The color gradient from white to dark brown indicates global locations that require higher temporal resolution (in hours) satellite-based precipitation observations to maintain acceptable flood predictions. The gray portions of the map represent locations where either the hydrologic model lacked acceptable performance relative to historical streamflow observations or a lack of historical data prevented assessments.
Download figure:
Standard image High-resolution imageTable 1. Summary of rainfall focused satellite missions. Determination of those missions beyond design life assume 2013 as the baseline analysis year(Heavens-Above.com 2014, North American Aerospace Defense Command 2014).
| Spacecraft | Launch date | Design life | Past design life |
|---|---|---|---|
| GPM Core | 2/27/2014 | 3 | |
| MetOpB | 9/17/2012 | 5 | |
| NPP | 10/28/2011 | 7 | |
| Megha-Tropiques | 10/12/2011 | 5 | |
| NOAA18 | 5/20/2005 | 2 | ✓ |
| NOAA19 | 2/6/2009 | 2 | ✓ |
| GCOMW1 | 5/18/2012 | 5 | |
| DMSPF17 | 11/4/2006 | 5 | ✓ |
| DMSPF18 | 10/18/2009 | 5 | |
| TRMM | 8/1/1997 | 3 | ✓ |
Figure 2 explores an optimistic scenario termed the full portfolio, which assumes perfectly coordinated multi-mission sensing and data services from all ten current rainfall dedicated satellites. The temporal resolution of the resulting global rainfall data for the full portfolio is assumed only to be constrained by the satellites' ability to observe specific locations on Earth (i.e., orbital dynamics). The idealized full portfolio represents a theoretical upper bound on the temporal observation resolutions for a satellite-based rainfall product derived from all current missions. Recall that the term coverage deficit represents the difference between the required rainfall observation period (figure 1) and the maximum temporal data gaps that result for a particular satellite portfolio. The maximum temporal data gaps occur due to the visibility limits implicit to the orbital dynamics of the ten current precipitation missions. We emphasize again that this data gap analysis is extremely optimistic in that it only accounts for satellite visibility constraints and neglects other potential sources of data loss such as data communication failures, sensor constraints, and the conflicting requirements for individual mission agencies. Minimizing coverage deficits requires an increase in the temporal resolution of rainfall observations while reducing unwanted gaps or variation in the data.
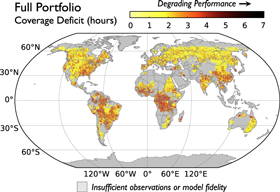
Figure 2. The full portfolio's coverage deficits. The color gradient from yellow to dark brown represents increasingly large worst case data gaps (in hours) that are sufficiently large to degrade surface runoff predictions. The 1° global coverage deficits result from a combination of temporal data resolution requirements for the hydrological predictions of surface runoff and constraints on Earth visibility that result from the orbital dynamics. The orbital dynamics are based on the full portfolio of the ten current rainfall focused satellite missions. The gray portions of the map represent locations where either the hydrologic model lacked acceptable performance relative to historical streamflow observations or a lack of historical data prevented assessments.
Download figure:
Standard image High-resolution imageMost of the coverage deficits illustrated for the full portfolio in figure 2 vary between 2 and 4 h across the globe. The differences are due to local dominant storm characteristics, drivers of runoff generation, uncertainty in the hydrologic model, and latitudinal variation in the density of satellite visits. The most significant deficits of concern occur in South America, Central and Eastern Africa, and throughout Asia where the potential for vulnerable populations is high (Intergovernmental Panel on Climate Change 2014). In reality, the actual coverage deficits would be far worse than those shown in figure 2 given the institutional challenges for providing integrated multi-mission data services in real time (ideally 1–3 h) (Kidd and Levizzani 2011). The required temporal resolution for operational flood protection would not be possible using the full portfolio's idealized multi-mission rainfall product, especially for regions with the larger coverage deficits illustrated in figure 2.
Shifting from the optimistic full portfolio, figure 3 illustrates the reduced portfolio case, which quantifies the coverage deficits that could occur if the four satellite systems that are currently beyond their design life are lost (see table 1). The resulting coverage deficits increase by between 200% to more than 400% over the globe, with a majority of grid cells exceeding a coverage deficit of 8 h. The variability of satellite rainfall data availability poses obvious concerns if data gaps result in a loss of the rainfall observations at critical periods and degrade forecasts of high impact flood events that threaten loss of life or significant property damage. More generally, high variability in rainfall data availability degrades the fidelity of hydrologic predictions, yielding the potential for a strong accumulation of forcing errors across space and time (Ebert et al 2007, Kidd and Levizzani 2011). These forcing errors could be addressed by expanding international investments in coordinated mission portfolio planning. These investments could pose both a significant benefit and potential risk for vulnerable countries that face increasing flood risks with climate change (Intergovernmental Panel on Climate Change 2014), since investments in their operational forecasting and adaptive flood risk management institutions are fundamentally dependent on sustained access to high temporal resolution rainfall information (as shown in figures 1–3) provided by other countries.
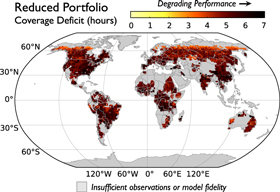
Figure 3. The reduced portfolio's coverage deficits. The color gradient from yellow to dark brown represents increasingly large worst case data gaps (in hours) that are sufficiently large to degrade surface runoff predictions. The 1° global coverage deficits result from a combination of temporal data resolution requirements for the hydrological predictions of surface runoff and constraints on Earth visibility that result from the orbital dynamics. The orbital dynamics are based on the loss of 4 of the 10 current rainfall focused satellite missions that arec currently beyond their design life. The gray portions of the map represent locations where either the hydrologic model lacked acceptable performance relative to historical streamflow observations or a lack of historical data prevented assessments.
Download figure:
Standard image High-resolution imageDespite the obvious importance of improved space-based rainfall observations, multi-mission satellite portfolio design analyses remain largely non-existent (Lo 1999, Neeck and Oki 2007, Wang and Andersson 2012, Group on Earth Observations 2014). Figure 4 illustrates the value of an internationally coordinated satellite portfolio analysis, which seeks to optimally recover from reduced portfolio's coverage losses. The multi-objective tradeoff analysis captured in the figure shows the worst case global coverage deficit and number of satellites used for the full portfolio, the reduced portfolio, as well as for optimally coordinated candidate missions seeking to recover from the loss of four satellites. In simple terms, the optimal replenishment tradeoff shown in figure 4 represents those satellites portfolios where any decrease in worst case global coverage deficit requires an increase in the number of satellites. Likewise, the tradeoff highlights 'dominated' portions of the space where portfolios are worse in both measures. Figure 4 clearly demonstrates that carefully adding two additional satellites to the six satellites in the reduced portfolio case can significantly reduce coverage deficits. The resulting eight satellite replenished portfolio exploits globally coordinated satellite portfolio planning to optimally address the coverage deficits.

Figure 4. Detailed multi-objective tradeoffs for replenishing the reduced portfolio. Each point represents a portfolio of rainfall observation investments with a number of satellites (x-axis) that achieves a certain maximum coverage deficit (y-axis). Both objectives are to be minimized. The (2 h, five satellite) combination in lower-left corner of the plot is the ideal point. The points shown in black are the full and reduced portfolios, while the green points represent the tradeoff solutions identified via multi-objective optimization. Starting from the reduced portfolio, in theory decision makers can choose any of the green points, which provide additional satellites assuming full coordination of all missions. Note the full portfolio is completely inferior or worse in both objectives relative to the eight or nine satellite replenishment case.
Download figure:
Standard image High-resolution imageAs in the prior cases, the replenished portfolio assumes a fully coordinated multi-mission rainfall data service (i.e., a single rainfall product drawn from the eight component satellites). The replenished portfolio demonstrates (figure 4) that understanding the performance tradeoffs between cost and performance can yield design insights that strongly improve the temporal resolution and spatial coverage of rainfall observations relative to the reduced portfolio case. Figure 5(a) illustrates that the replenished portfolio's coverage deficits are reduced dramatically over the whole globe with an overall average value of less than 2 h. Interestingly, a comparison of the full and replenished portfolios (figure 5(b)), shows that resulting eight satellite replenished portfolio outperforms the full ten satellite case. In fact, the only areas where the eight satellite replenished portfolio is inferior to the full case lie at high latitudes where the majority of precipitation is likely to be in the form of snow and has less direct relevance to floods. In combination, figures 4 and 5 serve as a quantified example of the broadly expressed concern (National Research Council 2012b) that one-at-a-time, ad hoc development of the global portfolio of space-based Earth observations is not cost-effective or sufficient to address growing operational data demands. The replenished portfolio demonstrates the potential value associated with internationally coordinating satellite portfolio planning and integrated multi-mission data services.

Figure 5. (a) The replenished portfolio's coverage deficits. The color gradient from yellow to dark brown represents increasingly large worst case data gaps (in hours) that are sufficiently large to degrade surface runoff predictions. The 1° global coverage deficits result from a combination of temporal data resolution requirements for the hydrological predictions of surface runoff and constraints on Earth visibility that result from the orbital dynamics. The orbital dynamics are based on the loss of 4 of the 10 current rainfall focused satellite missions that are currently beyond their design life, followed by the addition of two satellites optimized to reduce coverage deficits. (b) The percent difference in coverage deficit from the full portfolio to the replenished portfolio. Blue indicates that the replenished portfolio (eight satellites) performs better than the current full portfolio (ten satellites); red indicates the opposite.
Download figure:
Standard image High-resolution image
4. Conclusion
Broadly, flood risk adaptation efforts are themselves fundamentally vulnerable to poor international coordination in precipitation mission planning, failures to sustain satellite infrastructure investments, the technical hurdles associated with providing high fidelity data services, and the institutional challenges that could limit operational use of the data services in flood forecasting(Intergovernmental Panel on Climate Change 2014). Overcoming these issues must be a central focus of climate change adaptation research and policy. There is strong evidence that the full suite of Earth science focused satellite infrastructure is trending towards collapse (National Research Council 2007, National Research Council 2012b), despite the general consensus that these systems are critical to understanding and managing a broad range of societal risks. Avoiding this collapse will require that the global community support internationally coordinated investments in satellite services that are cost-effective, sustained over the long term, and that maximize the operational value of space-based observations.
Our results in this study show that the current full portfolio of rainfall missions fails to meet operational data needs for flood management, even when assuming a perfectly coordinated single rainfall data product from all current rainfall-focused missions. Moreover, removing satellites that are currently beyond their design life dramatically increases data deficits globally and could cause entire high intensity flood events to be unobserved. It should be noted that this data gap analysis is purposely optimistic in that it only accounts for satellite visibility constraints and neglects other potential sources of data loss such as data communication failures, sensor constraints, and the conflicting requirements for individual mission agencies. The implication is that even in the most optimistic analysis our current space-based rainfall observations are deficient for supporting operational flood management and highly vulnerable. Longer lead time forecasts of surface runoff processes need high resolution (in space and time) forcing. Although the soil moisture active passive (SMAP), the surface water ocean topography (SWOT) and the Gravity Recovery and Climate Experiment II (GRACE II) missions (National Research Council 2012a) have significant complimentary value in understanding key water cycle fluxes and storages, they are not sufficient to offset the potential rainfall observation deficits highlighted in this study. There is a clear need for a global dialog on how internationally coordinated satellite portfolio management and data services pose fundamental needs if the international community is going to sustain or enhance the value of space-based rainfall observations in managing evolving flood risks.
Acknowledgments
The authors of this work were partially supported by the US National Science Foundation under the Petascale Resource Allocation entitled 'Collaborative Research: Petascale Design and Management of Satellite Assets to Advance Space-Based Earth Science' under grant OCI-1144212. Any opinions, findings, and conclusions or recommendations expressed in this paper are those of the authors and do not necessarily reflect the views of the US National Science Foundation. Additionally, this research is part of the Blue Waters sustained-petascale computing project, which is supported by the National Science Foundation (award number ACI 1238993) and the state of Illinois. Blue Waters is a joint effort of the University of Illinois at Urbana-Champaign and its National Center for Supercomputing Applications.