

Abstract
Heat waves (HWs) are projected to become more frequent and last longer over most land areas in the late 21st century, which raises serious public health concerns. Urban residents face higher health risks due to synergies between HWs and urban heat islands (UHIs) (i.e., UHIs are higher under HW conditions). However, the responses of urban and rural surface energy budgets to HWs are still largely unknown. This study analyzes observations from two flux towers in Beijing, China and reveals significant differences between the responses of urban and rural (cropland) ecosystems to HWs. It is found that UHIs increase significantly during HWs, especially during the nighttime, implying synergies between HWs and UHIs. Results indicate that the urban site receives more incoming shortwave radiation and longwave radiation due to HWs as compared to the rural site, resulting in a larger radiative energy input into the urban surface energy budget. Changes in turbulent heat fluxes also diverge strongly for the urban site and the rural site: latent heat fluxes increase more significantly at the rural site due to abundant available water, while sensible heat fluxes and possibly heat storage increase more at the urban site. These comparisons suggest that the contrasting responses of urban and rural surface energy budgets to HWs are responsible for the synergies between HWs and UHIs. As a result, urban mitigation and adaption strategies such as the use of green roofs and white roofs are needed in order to mitigate the impact of these synergies.
Export citation and abstract BibTeX RIS

Content from this work may be used under the terms of the Creative Commons Attribution 3.0 licence. Any further distribution of this work must maintain attribution to the author(s) and the title of the work, journal citation and DOI.
1. Introduction
HWs are excessively hot periods that last for several days or longer. They are one of the most important regional and global causes of weather-related mortality (Harlan et al 2006, Kovats and Hajat 2008, Anderson and Bell 2011, Petkova et al 2014, Wu et al 2014). For example, the 1995 Chicago heat wave caused more than 800 deaths (Changnon et al 1996) and the 2003 European heat wave was estimated to have killed 70 000 people (Robine et al 2008). In addition to human health, HWs also have significant impacts on ecosystem productivity (Ciais et al 2005), animal production (West 2003), labor capacity (Dunne et al 2013), and energy/water consumptions (Sailor and Pavlova 2003).
Observational data indicate that the frequency of HWs has increased over the past few decades (Hansen et al 2010, Coumou and Rahmstorf 2012, Coumou et al 2013, Peterson et al 2013). In addition, numerous studies using advanced global climate models have demonstrated that HWs are very likely to become more frequent, last longer, and affect larger land areas in the late 21st century (Meehl and Tebaldi 2004, Lau and Nath 2012, Coumou and Robinson 2013, Lau and Nath 2014), as concluded by the Fifth Assessment Report of the Intergovernmental Panel on Climate Change (IPCC 2013). As a result, managing the risks associated with HWs is becoming increasingly important under a warming climate.
HWs typically result from stagnant, high-pressure systems that produce a positive temperature anomaly over a large area (Meehl and Tebaldi 2004, Loikith and Broccoli 2012). Urban areas are particularly vulnerable to HWs due to the pre-existing or background UHI effect; that is, urban areas are typically hotter than the rural areas even under non-HW conditions (Oke 1982, Grimmond 2007). Since its first documentation by the British meteorologist Luke Howard in 1833 (Mills 2008), the UHI phenomenon has been studied extensively all over the world using theoretical, experimental, and numerical approaches (see e.g., Arnfield 2003 for a review). Key meteorological factors that control the UHI effect have been identified, including wind speed and cloud cover (Arnfield 2003), both of which are strongly affected by HWs. A recent modeling study over the Baltimore–Washington Metropolitan area in the United States shows that the UHI effect is intensified under HW conditions, implying that HWs not only enhance urban and rural temperatures, they also exaggerate the contrast between urban and rural temperatures (Li and Bou-Zeid 2013). This synergistic interaction between HWs and UHIs was attributed principally to the lack of surface moisture in urban areas using a simple analytical model (Li and Bou-Zeid 2013).
An important yet unanswered question is how the synergistic interaction between HWs and UHIs is related to the different responses of urban and rural surface energy budgets to HWs. To address this question, this study investigates the responses of various components in the urban and rural surface energy budgets to HWs using observational data collected over the Beijing Metropolitan area in China. By examining changes in the urban and rural surface energy budgets under HW conditions as compared to under non-HW conditions, the mechanism behind synergistic interactions between HWs and UHIs is to be elucidated. The paper is organized as follows: section 2 documents the methodology and the observational data; section 3 presents and discusses the main results; and section 4 summarizes the work.
2. Methodology and data
The surface energy budget of a canopy without significant horizontal advection can be expressed as:

where Rn is the net radiation calculated from Rn = SWin + LWin − SWout − LWout and SWin, LWin, SWout, and LWout are the incoming shortwave radiation, incoming longwave radiation, outgoing shortwave radiation, and outgoing longwave radiation, respectively. The anthropogenic heat (AH) flux is generally more significant in urban areas than in rural areas (Sailor 2011). Estimating AH in urban environments remains a challenge, but many recent studies have attempted to quantify the spatiotemporal characteristics of AH using multi-method and multi-scale approaches (see e.g., Chow et al 2014, Nie et al 2014). H is the sensible heat flux, which is the major source for heating the atmosphere (when H > 0), and LE is the latent heat flux into the atmosphere resulting from soil evaporation and/or plant transpiration (when LE > 0). These two components are commonly referred to as turbulent fluxes and their sum is called the available energy. G includes the heat flux into the ground (or into the buildings for urban areas) and the heat stored in the canopy (when G > 0).
The data used in this study are collected from two flux towers, one located in North Beijing (39.97°N, 116.37°E) and the other located at Xianghe (39.78°N, 116.95°E), which is a rural area adjacent to Beijing. The analysis focuses on the summer season (June–August) in 2009 and 2010. The locations of the two flux towers, the topography, and the land-use map are shown in figure 1. The Beijing flux tower is 325 m high and includes turbulence measurements at three levels (47, 140, and 280 m) using combinations of three-dimensional sonic anemometers (Campbell Scientific CSAT3, USA) and open-path gas analyzers (LICOR-7500, USA) from which 30 min turbulent fluxes can be calculated following Li and Bou-Zeid (2011) and Wang et al (2014b). These flux data have been analyzed extensively in previous studies (Al-Jiboori et al 2002, Al-Jiboori and Hu 2005, Al-Jiboori 2008, Li et al 2010, Miao et al 2012, Wang et al 2014a, Wang et al 2014b). Incoming and outgoing radiation are also measured at the three levels using CNR1 radiometers at hourly intervals. In this study, the averaged radiative and turbulent fluxes from the three levels are used but we note that our conclusions are not changed when data from one of the three levels are used given the similar magnitude of fluxes at the three levels (Wang et al 2014a). Results using data measured at a single level are presented in the Supplementary Materials (stacks.iop.org/ERL/10/054009/mmedia). Other instruments include hourly air temperature and relative humidity measurements at various levels, as shown in Yu et al (2013). In this study, only air temperatures measured at 8 m and 32 m above the ground are used.
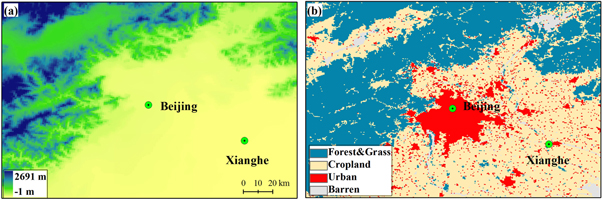
Figure 1. The locations of the two flux towers (urban: Beijing, rural: Xianghe). (a) the topography and (b) the land-use map.
Download figure:
Standard image High-resolution imageThe Xianghe flux tower includes turbulence measurements at two levels (32 m and 64 m) using three-dimensional sonic anemometers (Gill, UK) and open-path gas analyzers (LICOR-7500, USA). Similarly, turbulent fluxes are calculated using an averaging interval of 30 min (Wang et al 2014a) and the averaged turbulent fluxes from these two levels are used in this study. Incoming shortwave and longwave radiation are measured at the surface also at hourly intervals. Summing the direct and diffuse components, which are measured by an Eppley Normal Incidence Pyrheliometer and a black-and-white radiometer, respectively, yields the incoming shortwave radiation. The incoming longwave radiation is measured using an Eppley Precision Infrared Radiometer. Additional information about the instruments and data quality control can be found in Xia et al (2007). Hourly air temperature and relative humidity are also available at various levels (Yu et al 2013) and only those at 8 m and 32 m above the ground are used in this study.
It is clear from figure 1 that the Beijing tower is mainly surrounded by urban surfaces, while the Xianghe tower is surrounded by croplands that are irrigated regularly. Wang et al (2014a) analyzed the land-use compositions within the footprints of the Beijing and Xianghe flux towers using the Finer Resolution Observation and Monitoring of Global Land Cover (FROM-GLC) dataset (Gong et al 2012). In their analyses, impervious surface and cropland are the two most important land-cover types around the two flux towers, which is consistent with figure 1. At the Beijing flux tower, the fractions of impervious surfaces are 82, 74, and 65% in the three footprints corresponding to the three levels of turbulence measurements, respectively; cropland is the second most important surface type with fractions of 12, 18, and 29% for the three footprints, respectively. At the Xianghe flux tower, the fractions of cropland are 74% and 75% for the two footprints corresponding to the two levels of the Xianghe flux tower, while the fractions of impervious surface are 22% and 21%, respectively.
Identifying HW periods requires a long-term time series of air temperature measurements, which is taken from the 35 year air temperature observational data at the Beijing International Airport. There are many definitions of HWs (Robinson 2001, Smith et al 2013) and the one used by Meehl and Tebaldi (2004) is adopted in our study. By introducing two thresholds for daily maximum air temperature (Tmax): T1 the 97.5th percentile and T2 the 81st percentile, a HW is defined as the longest period satisfying the following three conditions: (1) Tmax exceeds T1 for at least 3 days, (2) the average of Tmax over the entire period is higher than T1, and (3) Tmax exceeds T2 for each day of the period. This definition yields a total of 5 HW events or 44 HW days over the Beijing Metropolitan area during 2009–2010 (see table S1 of the Supplementary Materials for detailed periods, available at stacks.iop.org/ERL/10/054009/mmedia). The definition used in our study has also been used in many other studies with minor alterations in the selection of T1 and T2 (Lau and Nath 2012, 2014). Note other definitions of HWs have been used in the literature (Smith et al 2013) and exploring the differences between these definitions is beyond the scope of this study. We also note that there are debates about the attribution of increasing temperature extremes (e.g., HWs) to the shift of mean and/or the change of variance of the temperature distribution (Schar et al 2004, Simolo et al 2011, Hansen et al 2010, Rhines and Huybers 2013), which are outside of the scope of this study.
The turbulent fluxes, radiative fluxes, and air temperatures measured under HW days (44 days) and under non-HW days (140 days) are then separated, which are termed as 'heatwave' and 'background' hereafter. The averaged 'heatwave' results are compared to the averaged 'background' results in order to understand the impacts of HWs on the UHI effects and the urban/rural surface energy budgets.
3. Results
Figures 2(a) and (b) show the averaged diurnal cycles of air temperatures measured at 8 m (T8) and 32 m (T32), respectively, under HW and non-HW (or background) conditions. It is clear that urban temperatures are always higher than rural temperatures for both T8 and T32, implying positive UHIs over the Beijing Metropolitan area. Under HW conditions, both urban and rural temperatures are significantly increased as compared to their counterparts under background conditions. When the UHIs are considered, as shown in figures 2(c) and (d), it is also evident that the UHIs are enhanced under HW conditions as compared to under background conditions; namely, urban temperatures are increased more significantly than rural temperatures, suggesting there are positive or synergistic interactions between HWs and UHIs.
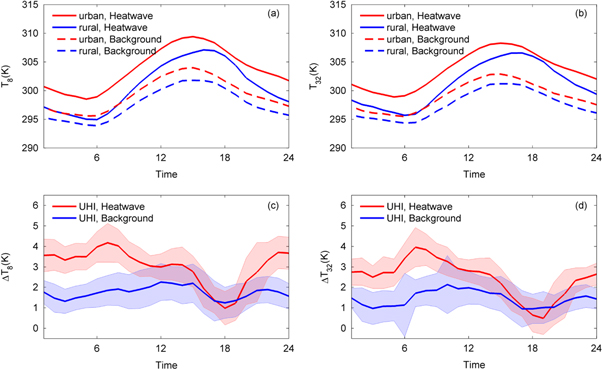
Figure 2. The averaged diurnal cycles of air temperatures (unit: K) measured at (a) 8 m (T8) and (b) 32 m (T32) above the ground and their differences (c), (d) between the urban site and the rural site. In (a), (b), the urban site and the rural site are indicated by the red color and the blue color, respectively. In (c), (d), heatwave and background conditions are indicated by the red color and the blue color, respectively. Shaded areas in (c), (d) denote one standard deviation. Local standard time is used here and throughout the study.
Download figure:
Standard image High-resolution imageIt is pointed out here that under background summer conditions, the diurnal cycle of UHIs at 8 m shows two peaks, one in the early afternoon and the other at night. Interestingly, the UHIs under HW conditions are much higher during the nighttime and reach the maxima in the early morning. As a result, synergistic interactions between HWs and UHIs occur mostly during the nighttime and are almost absent in the late afternoon (around 18:00) when the background UHIs are also the lowest. The existence of nighttime maximum in UHIs under both background and HW conditions is consistent with many previous studies (e.g., Oke 1982, Arnfield 2003).
To understand the impacts of HWs on the urban and rural surface energy budgets, figures 3 and 4 examine changes in the incoming radiation (shortwave and longwave) and the turbulent fluxes (sensible and latent), respectively. As can be seen from equation (1), incoming radiation is the radiative input into the surface energy budget. Figures 3(a) and (b) show that the incoming shortwave and longwave radiation are increased under HW conditions, as compared to under background conditions, for both urban and rural sites. The increases in the incoming shortwave radiation occur throughout the daytime with maxima at noon for both urban and rural sites, which is consistent with the fact that HW days are typically clear days with little cloud cover (Black et al 2004). Interestingly, under HW conditions, increases in the incoming shortwave radiation from background to HW conditions at the urban site are larger than those at the rural site (figure 3(c)). As a result, differences in the incoming shortwave radiation between the urban site and the rural site are strongly diminished and the two sites have very similar diurnal cycles of incoming shortwave radiation under HW conditions (figure 3(a)).

Figure 3. The averaged diurnal cycles of (a) incoming shortwave radiation (SWin) and (b) incoming longwave radiation (LWin) and their differences (c), (d) between heatwave and background conditions. In (a)–(d), the urban site and the rural site are indicated by the red color and the blue color, respectively. In (a), (b), heatwave and background conditions are indicated by the lines and dashed lines, respectively. Shaded areas in (c), (d) denote one standard deviation. The urban fluxes are averaged over three levels (i.e., 47, 140, and 280 m) and the rural fluxes are averaged over two levels (i.e., 32 m and 64 m). Results using fluxes measured at a single level at both sites are shown in the supplementary material, available at stacks.iop.org/ERL/10/054009/mmedia (figure S1).
Download figure:
Standard image High-resolution image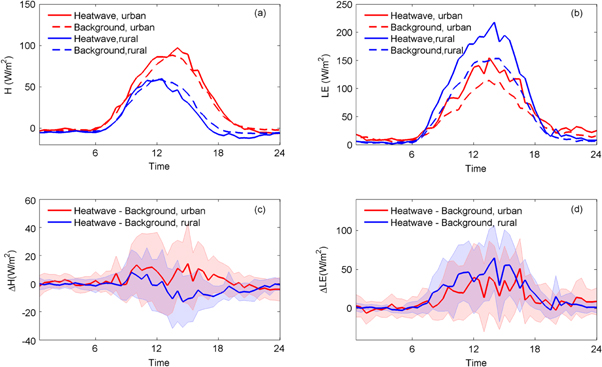
Figure 4. The averaged diurnal cycles of (a) sensible heat flux (H) and (b) latent heat flux (LE) and their differences (c), (d) between heatwave and background conditions. In (a)–(d), the urban site and the rural site are indicated by the red color and the blue color, respectively. In (a), (b), heatwave and background conditions are indicated by the lines and dashed lines, respectively. Shaded areas in (c), (d) denote one standard deviation. The urban fluxes are averaged over three levels (i.e., 47, 140, and 280 m) and the rural fluxes are averaged over two levels (i.e., 32 m and 64 m). Results using fluxes measured at a single level at both sites are shown in the supplementary material, available at stacks.iop.org/ERL/10/054009/mmedia (figure S2).
Download figure:
Standard image High-resolution imageDifferent from the incoming shortwave radiation, increases in the incoming longwave radiation under HW conditions primarily occur in the late afternoon (figure 3(b)), which is due to increases in air temperatures in the late afternoon (Brutsaert 1982). In addition, the increase in the incoming longwave radiation is slightly more significant at the urban site (figure 3(d)), especially during the afternoon, owing to the higher sensitivity of incoming longwave radiation to perturbations in the air temperature ( where
where  is the emissivity of the atmosphere,
  is the Stefan–Boltzmann constant, and Ta is the air temperature) at higher air temperature Ta.
Changes in the partition of available energy over urban and rural sites diverge strongly. Under background summer conditions, the urban site has higher sensible heat fluxes and lower latent heat fluxes than the rural site (figures 4(a) and (b)) owing to the lack of green space and the use of impervious materials in urban areas (Oke 1982). The urban site shows slight increases while the rural site shows slight decreases in sensible heat fluxes from background to HW conditions (figure 4(c)). The slight increases in sensible heat fluxes at the urban site are found to be a result of increases in the wind speed (figure S3(a)). However, this decreases in the vertical temperature gradient (figure S3(b)) under HW conditions as compared to under background conditions. The slight decreases in sensible heat fluxes at the rural site are due to insignificant changes in the wind speed (figure S3(a)) and potential decreases in the vertical temperature gradient (figures S3(b) and S3(c)).
On the other hand, both urban and rural sites show significant increases in latent heat fluxes, which is consistent with the theoretical analysis of Bateni and Entekhabi (2012), showing that evaporation increases more efficiently compared to sensible heat flux as the air temperature increases (i.e., as HWs come) in the presence of sufficient water availability. However, unlike that increases in sensible heat fluxes are slightly larger over the urban site, increases in latent heat fluxes over the rural site are slightly larger (figure 4(d)), again owing to the limited water availability in urban areas. As such, it is demonstrated here that HWs affect the urban and rural surface energy budgets differently: sensible heat fluxes increase more over the urban site, while latent heat fluxes increase more over the rural site, resulting in an intensification of the UHIs. These results are broadly consistent with the theoretical and modeling analyses of Li and Bou-Zeid (2013).
It is clear from equation (1) that the outgoing radiation, the AH, and heat storage (G) are important components of the surface energy budget. In particular, a larger heat storage during HWs results in a longer period of hot conditions since the stored heat is slowly released and re-heats the atmosphere after HWs (Li and Bou-Zeid 2013). Figure 5 shows that the heat storage term minus the anthropogenic heat flux (G − AH) increases significantly at the urban site from background to HW conditions. Was the AH not changed due to HWs, this would imply that more heat is stored in the urban canopy during the daytime while more heat is released into the atmosphere during the nighttime under HW conditions as compared to under background conditions. Given that the AH is expected to increase under HW conditions due to the surge in cooling loads such as air conditioning and water chilling (Stone 2012), it further indicates that even more heat is stored in the urban canopy during the daytime and even more heat is released into the atmosphere during the nighttime, as compared to the situation where no change in AH was assumed.
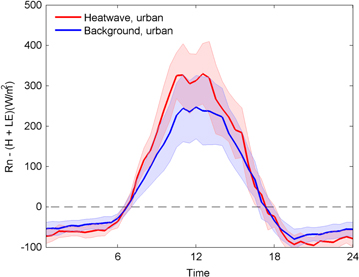
Figure 5. The averaged diurnal cycles of Rn–H–LE = G–AH in the urban area under heatwave and background conditions. Shaded areas denote one standard deviation.
Download figure:
Standard image High-resolution imageAlthough changes in heat storage at the rural site are unknown due to unavailable outgoing radiation measurements, it is conjectured that changes in heat storage are less substantial in rural areas given the more significant synergistic interactions between HWs and UHIs in the nighttime, as shown in figure 2. Hence, as a result of larger heat storage, urban areas experience longer hot conditions than rural areas. Future studies involving direct comparisons of heat storage between urban and rural areas under HW and background conditions are needed given the importance of heat storage in modulating UHIs in post-HW periods.
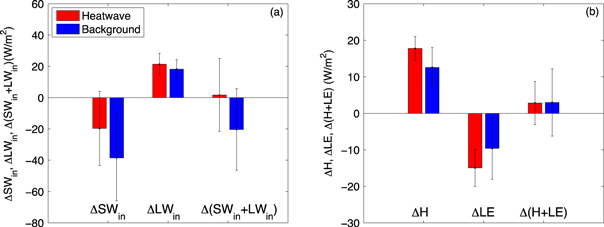
To further examine the urban–rural contrast in terms of different components in the surface energy budget, figure 6 shows the differences in incoming shortwave radiation (ΔSWin), incoming longwave radiation (ΔLWin), total incoming radiation (Δ(SWin + LWin)), sensible heat flux (ΔH), latent heat flux (ΔLE), and available energy (Δ(H + LE)) between the urban site and the rural site under HW and background conditions. It is clear that under background summer conditions, the urban site receives less incoming shortwave radiation than the rural site and hence ΔSWin is negative. As shown in Wang et al (2014a), this is neither completely explained by the differences in the aerosol optical depth nor by the differences in the cloud fraction. However, a comparison between HW and background conditions might offer some new insights. It is clear that the urban–rural contrast in the incoming shortwave radiation (ΔSWin) is strongly reduced under HW conditions, suggesting that aerosols are not the primary contributor to the urban–rural contrast in the incoming shortwave radiation, since aerosols would have enhanced or maintained the urban–rural contrast in the incoming shortwave radiation under HW conditions (i.e., when the atmosphere is stagnant). As a result, the urban–rural contrast of incoming shortwave radiation is probably more caused by the elevated cloud fraction in urban areas, which is hence diminished under HW conditions when both urban and rural areas have clear sky. Cloud fractions under HW and background conditions estimated from satellite observations are presented in the supplementary materials, available at stacks.iop.org/ERL/10/054009/mmedia (figure S4). It can be seen from figure S4 that the urban–rural contrast of cloud fraction is consistent with the urban–rural contrast of incoming shortwave radiation: the cloud fraction at the urban site is slightly higher under background conditions but is comparable to the cloud fraction at the rural site under HW conditions, which is in agreement with that SWin at the urban site is lower under background conditions, but is comparable to SWin at the rural site under HW conditions (see also figure 3(a)).
Figure 6. The averaged differences in (a) incoming shortwave radiation (ΔSWin), incoming longwave radiation (ΔLWin), total incoming radiation (Δ(SWin + LWin)), (b) sensible heat flux (ΔH), latent heat flux (ΔLE), and available energy (Δ(H + LE)) between the urban site and the rural site. The heatwave conditions and the background conditions are indicated by the red color and the blue color, respectively. The error bars denote one standard deviation.
Download figure:
Standard image High-resolution image
The urban–rural contrast in the incoming longwave radiation is slightly increased, which is partially due to the enhanced UHI effect under HW conditions. Given  an increase in ΔTa will result in an increase in ΔLWin. The comparisons in terms of the incoming shortwave radiation and longwave radiation suggest that the total radiative energy received increases more significantly at the urban site under HW conditions (see figure 6(a)).
The increases in the radiative energy are partially transferred into the increases in sensible heat fluxes, as can be seen from figure 6(b). This is particularly the case considering that latent heat fluxes at the urban site decrease relative to those at the rural site. A combination of these two effects (i.e., increases in sensible heat fluxes and decreases in latent heat fluxes at the urban site relative to the rural site) leads to the intensification of UHIs under HW conditions, thereby partly explaining the synergistic interactions between HWs and UHIs shown in figure 2. It is also interesting to observe that the urban–rural contrast of available energy, or the sum of sensible and latent heat fluxes (H + LE), does not change much due to HWs, which is consistent with the results of the analytical model in Li and Bou-Zeid (2013). The analytical model predicts that the synergies between HWs and UHIs are much more sensitive to the urban–rural contrast of available water for evapotranspiration than the urban–rural contrast of available energy. As can be seen from figure 6(b), changes in the urban–rural contrast of available energy due to HWs are much smaller than changes in the urban–rural contrast of latent heat fluxes, implying that changes in the available energy are less important than changes in the partition of available energy into sensible and latent heat fluxes.
The fact that the urban–rural contrast of total incoming radiation is increased while the urban–rural contrast of available energy is maintained at the same level under HW conditions again suggests that the urban–rural contrast of heat storage increases under HW, particularly considering the AH flux is also likely increased more in urban areas under HW conditions. This is also consistent with the maximal intensifications of UHIs during nighttime shown in figure 2. However, a direct comparison of urban and rural heat storage, which is not possible here due to the lack of measurements of outgoing radiation at the rural site and the AH flux, is needed in future studies to verify this conjecture.
4. Summary and implications
This study investigates the different responses of urban and rural surface energy budgets to HWs in order to elucidate the mechanism for synergistic interactions between HWs and UHIs observed over the Baltimore–Washington Metropolitan area (Li and Bou-Zeid 2013) and the Beijing Metropolitan area. It is shown here that as compared to those under background summer conditions, the incoming shortwave radiation and longwave radiation increase at both urban and rural sites under HW conditions, leading to larger radiative inputs into the surface energy balances. However, there are significant differences between the urban and rural surface energy budgets. First of all, the urban site receives more incoming shortwave radiation and longwave radiation under HW conditions as compared to the rural site. Second, changes in turbulent heat fluxes also diverge strongly for the urban site and the rural site: latent heat fluxes increase more at the rural site because of abundant available water, while sensible heat fluxes increase more at the urban site. In spite of no direct comparison of heat storage, it is conjectured that increases in heat storage are more substantial in urban areas under HW conditions, given the more significant synergistic interactions between HWs and UHIs during the nighttime and also the fact that the urban–rural contrast of total incoming radiation increases while the urban–rural contrast of available energy is maintained at the same level. These comparisons explain the observed synergies between HWs and UHIs; that is, the urban temperature increases more significantly than the rural temperature under HW conditions.
Previous studies have examined the different responses of forests and grasslands to HWs experimentally (Teuling et al 2010) and numerically (Stap et al 2014). It was found that grasslands were heated less in the initial phase due to the increased evaporation; ultimately, however, grasslands were heated more in the later phase due to the depletion of soil moisture while the conservative water use strategy allows forests to keep evaporating over a much longer period, thereby mitigating the impact of long-lasting HWs. In this study, we are restricted to the initial phase for grasslands/croplands due to irrigation at the rural site. That being said, drought conditions are also not considered in this study. We point out that droughts are sometimes associated with HWs and under drought conditions, rural areas do not have much water for evapotranspiration and hence, the synergies between UHIs and HWs might be diminished or completely absent. In addition, we also note that the number of HW events and the number of HW days are still limited here due to data availability. Future investigations focusing on comparisons between urban and forest rural sites, the effects of long-lasting HWs and droughts, and using even longer observational datasets might reveal different and interesting features.
The results presented here have important implications. First of all, urban residents, especially the elderly and those who do not have access to air conditioning, are facing higher health risks because of the synergies between HWs and UHIs. The health risks faced by urban residents under HW conditions are higher than a simple addition of those from the background UHI effects and those from HW effects. Second, the results indicate that the lack of water for evapotranspiration in cities is largely responsible for the synergistic interactions between HWs and UHIs as the increased radiative input in urban areas is then transformed into sensible heat fluxes and possibly heat storage. Consequently, mitigation and adaption strategies that aim to increase the water availability in cities, such as the use of green roofs and planting trees (e.g., Gaffin et al 2010, Georgescu et al 2014, Stone et al 2014), are strongly needed in order to reduce these synergistic interactions. These strategies also have other environmental and socio-economic benefits such as improving air quality (e.g., Yang et al 2008), managing storm-water (e.g., Berndtsson 2010, Yang et al 2014), and reducing energy use (e.g., Jim and Peng 2012). White roofs that increase the reflection of incoming shortwave radiation (Akbari et al 2001, Synnefa et al 2008, Akbari et al 2009, Krayenhoff and Voogt 2010, Oleson et al 2010, Akbari et al 2012, Jacobson and Ten Hoeve 2012) can also be helpful given that the incoming shortwave radiation is found to be increased under HW conditions. Examining the impacts of these mitigation and adaptation strategies (particularly the use of green and white roofs) using regional and global climate models has been the subject of research recently (Oleson et al 2010, Jacobson and Ten Hoeve 2012, Georgescu et al 2014, Li et al 2014, Stone et al 2014), which is partly attributed to advances in urban modeling (Taha 2008a, 2008b, 2008c, Grimmond et al 2010, Chen et al 2011, Grimmond et al 2011, Best and Grimmond 2014) and development of more sophisticated green roofs (Sailor 2008, Sun et al 2013, Yang and Wang 2014) and irrigation modules (Vahmani and Hogue 2014). However, studies focusing on the impact of these strategies under HW conditions (see e.g., Li et al 2014) are still limited and are thus recommended. In particular, the soil moisture needs to be maintained (for example by irrigation) at a high level in order for green roofs to be effective under HW conditions (Sun et al 2014). Hence, the potential cost of irrigation needs to be taken into account when considering the effectiveness of green roofs under HW conditions.
Acknowledgments
DL acknowledges support from the NOAA (US Department of Commerce) grant NA08OAR4320752 and the Carbon Mitigation Initiative at Princeton University, sponsored by BP. The statements, findings, and conclusions are those of the authors and do not necessarily reflect the views of the NOAA, the US Department of Commerce, or BP. TS acknowledges the support from NSFC under grant nos. 51190092 and 51409147. LW and ZG acknowledge support from the NSFC under grant nos. 41405018 and 41275022. The authors thank Bo Guo from Princeton University for insightful discussions. The two anonymous reviewers are also acknowledged, whose comments led to significant improvement of this paper.