

Abstract
In the semiarid Southwestern United States, prolonged drought conditions since the early 2000s have resulted in widespread declines of the vegetation productivity in this water-constrained ecosystem, as revealed by analyses of the Normalized Difference Vegetation Index (NDVI). However, the spatial pattern of the NDVI response to dry years is not uniform: a divergent response of NDVI to precipitation is observed between the low-lying desert and the high montane forests at elevations above 2,500 meter. We analyzed relationships between 15 years of Moderate Resolution Imaging Spectroradiometer (MODIS) NDVI and gridded climate data (PRISM) along elevation gradients at scales from regional to local. Our elevation-explicit analysis captures the transition from water-limited to temperature-limited ecosystems, with a sign-reversal in the correlation coefficient between precipitation and NDVI observed at about 2,500-3,000m altitude. We suggest warmer temperatures and less snow cover associated with drier years as explanations for high elevation gains in vegetation productivity during dry years.
Export citation and abstract BibTeX RIS

Original content from this work may be used under the terms of the Creative Commons Attribution 3.0 licence. Any further distribution of this work must maintain attribution to the author(s) and the title of the work, journal citation and DOI.
1. Introduction
Variability of precipitation and recurring droughts characterize the semi-arid climate of the Southwestern United States (SW US from here on) (Sheppard et al 2002, Woodhouse et al 2010). However, the extreme and prolonged droughts coupled with rising temperatures that have plagued the region since the late 1990s, as well as their ecological consequences, have garnered national attention as harbingers of changes we might expect under future climate scenarios (Seager et al 2007, Cook et al 2015): dwindling snowpack and resulting water deficits (AghaKouchak et al 2014), forest die-back and tree mortality (Allen and Breshears 1998, Adams et al 2009, Allen 2009, Allen et al 2010, McDowell et al 2015a), bark beetle infestations (Betancourt et al 1993, Swetnam and Lynch 1993, Breshears et al 2005), and wildfires (Swetnam and Betancourt 1990, Westerling et al 2006). These climatic changes, together with anthropogenic disturbances, and their immediate and long term consequences are reshaping the ecosystems of the SW US (Hanson and Weltzin 2000, Knapp et al 2008, Swetnam and Betancourt 2010).
Since the late 1990s, the Four Corner States (AZ, NM, CO, UT) have been experiencing a prolonged period of dryness, interrupted by an abnormally wet winter in 2004/2005 region-wide (Woodhouse et al 2010, Ferguson and Crimmins 2009), and smaller-scale wet anomalies in 2006 and 2013. California has suffered a severe precipitation deficit since 2012, which was particularly significant in 2014 and 2015 (Griffin and Anchukaitis 2014, AghaKouchak et al 2014, Diffenbaugh et al 2015). Unlike the 1950s drought, which had also affected a large part of the Southwest, this recent drought period has been exacerbated by relatively higher annual temperatures (Breshears et al 2005, Weiss et al 2012, AghaKouchak et al 2014). As a result, soil moisture deficits have been more pronounced, and evapotranspirational demand greater, in this recent drought compared to historical ones (Weiss et al 2009, Williams et al 2015).
Studies in North America and Europe have suggested that the vegetation response to drought and heat waves is not uniform, but rather modulated by topography and elevation (Allen and Breshears 1998, Jolly et al 2005). Elevation gradients are a widely used tool in ecology for elucidating species shifts and terrain-dependent vegetation responses to climate along transects (Gitlin et al 2006, Kelly and Goulden 2008, Crimmins et al 2009 and 2010). Few studies (Jolly et al 2005, Piao et al 2011), however, have investigated the spatial patterns of elevation-dependent vegetation response to climate at a regional scale. The question of sensitivity of vegetation to drought stress is an important one in light of climate projections predicting declining precipitations and rising temperatures for the SW US in the coming decades (Seager et al 2007, Cook et al 2015, Williams et al 2015).
In this study we analyzed time series of fifteen years of moderate resolution imaging spectroradiometer (MODIS) normalized difference vegetation index (NDVI) and PRISM climate data in order to (1) characterize the response of the vegetation productivity to dry and relatively wet years in the SW US and (2) examine the complexity of this response with respect to elevation and to climatic drivers.
2. Data and methods
2.1. Study area
Our study focuses on the Southwest region of the United States, including the States of New Mexico, Colorado, Arizona, Utah, California and Nevada. This area, with the exception of the humid Northwestern California, encompasses a diverse mix of arid to semi-arid ecosystems, with heterogeneous topography, climate, soil, and land cover. The SW US is characterized by seasonal cycles of precipitation, which range from a winter precipitation maximum on the West Coast to a summer monsoonal maximum in the Sonoran and Chihuahuan Deserts (Comrie and Glenn 1998). Plant growth in these ecosystems is primarily constrained by water (Nemani et al 2003), and consequently plants are vulnerable to droughts. Most of the area has been experiencing severe drought conditions throughout the past 15 years, with few years of above normal precipitation (Hoerling et al 2013).
In addition to spanning 11° of latitude, the study area comprises elevation gradients from sea level to over 4000 m, with climatic conditions ranging from hot desert with average summer temperatures of >35 °C to subarctic conditions in the montane zone with long periods of sub-freezing temperatures in the winter. The vegetation sequence along this elevation gradient mimics the latitudinal gradient from the arid tropics towards the poles, albeit much compressed in space, shifting from desert scrub to grasslands, woodlands, forest and tundra (Brown 1982, Muldavin et al 1996). The highest elevations include peaks of the Rocky Mountains in Colorado and Utah, the Californian Sierra Nevada range, and the isolated Madrean Sky Islands rising from the deserts of Arizona and New Mexico to well above 2500 m. These montane ecosystems are significant for their ecological, economic and recreational values and will be the primary focus of this study.
2.2. Remote sensing data and preprocessing
Gridded monthly precipitation and temperature time series data were compiled from the 4 km monthly PRISM data record, which incorporates networks of station data and interpolates grid values based on elevation. Although station data are sparse above 3000 m elevation and hence data limitations arise at high elevations, PRISM remains the most widely used dataset for spatial climate studies in North America (Diaz and Eischeid 2007, Daly et al 2008, Crimmins et al 2011). Vegetation dynamics and their response to climate were characterized by time series of 16-day NDVI composites from the MODIS MOD13Q1 collection 5 at 250 m spatial resolution (Didan and Huete 2006, Huete et al 2002). While compositing is successful at eliminating cloudy observations and particularly poor quality data (Holben 1986), other subpixel atmosphere contaminants and aerosols tend to impact the remaining data and need further screening during post processing. The pixel reliability, a composite measure of quality assurance of the observation, was used to screen for snow, cloud, and other data contaminants, providing a simple and direct metric for data filtering in order to reduce noise in the time series. Elevation data were acquired from the shuttle radar topographic mission at 90 m resolution (Farr et al 2007). Land cover data were provided by the Gap Analysis Program at 30 m resolution (USGS GAP 2011).
All gridded data were subsetted or mosaicked to the extent of the study area and resampled to the 250 m MODIS resolution in the geographic projection, using a nearest neighbor approach. Based on the GAP land cover information, only pixels with natural vegetation cover (ranging from desert and semi-desert to grassland, shrubland, woodland, forest and polar high montane vegetation) were included in the subsequent analysis; open water, agricultural vegetation, and urban or otherwise developed land were excluded.
For each pixel, MODIS NDVI and PRISM data were temporally aggregated into mean values, as proxies for annual vegetation productivity. In order to account for the undesired impact of snow on the NDVI signal during the winter season, only NDVI data from day of year 60 to 306 were averaged to obtain annual (i.e., growing season) mean values. Within this time window, only high quality data, filtered by the pixel reliability parameter, were included. While limiting data to this window eliminates most of the winter snow over the southern and central parts of the study area, seasonal and perennial snow cover may still be present at the highest elevations. However, narrowing the window further would have excluded important parts of the growing season in the majority of the study area. PRISM precipitation time series were aggregated to total cumulative precipitation over the hydrological year (October 1–September 30), whereas the mean PRISM temperature was averaged for the same seasonal time window as the mean NDVI.
2.3. Analysis methods
In order to characterize temporal dynamics in climatic variables and NDVI response, percentiles were calculated relative to the period of study 2000–2014. Percentiles are a way to rank a dataset, indicating the percent of observations in the dataset that fall below each particular value, the median being equal to the 50th percentile. As rainfall is skewed to dryness in semiarid climates, with a larger number of below-average precipitation years balancing out few above-average years, such a measure that is not sensitive to the mean is preferable for characterizing dynamics in these environments (Katz and Glantz 1986).
Relationships between NDVI and the climate variables precipitation and temperature, modulated by elevation, were analyzed at different spatial scales from regional to local. Since the data of these variables are not normally distributed and analyses were based on their percentiles rather than absolute values, the non-parametric Spearman rank correlation coefficient was chosen as an appropriate measure of association. Spearman rank correlation coefficients between time series of percentiles of NDVI and percentiles of precipitation, as well as between time series of percentiles of NDVI and percentiles of temperature, were calculated per pixel for the entire study area.
Because the study area is large and complex, with different parts experiencing dry and wet periods in different years, the area was subsequently subdivided into smaller sub-regions of analysis using an isodata clustering algorithm, an unsupervised pattern recognition procedure that iteratively clusters data using minimum distance techniques (Tou and Gonzalez 1974). Clustering was based on time series of percentiles of precipitation and resulted in four sub-regions of similar temporal patterns of dry and wet years between 2000 and 2014 (figure 1). For each sub-region of analysis, the climatic drivers (precipitation and temperature), as well as the NDVI response, were averaged spatially for nine 500 m elevation classes from sea level to 4500 m (figure 2). Because lower and medium elevation dominate the study area—only about 8% of the total study area is higher than 2500 m—twelve smaller subsets of 100 × 100 km were selected for further analysis, in a way that the elevation gradient within each subset was maximized and the presence of perennial snow minimized. With 20% of the total subset area above 2500 m, the subsets constitute a more balanced representation of the range of elevations present and together span the latitudinal and longitudinal gradients of the study area (figure 1).
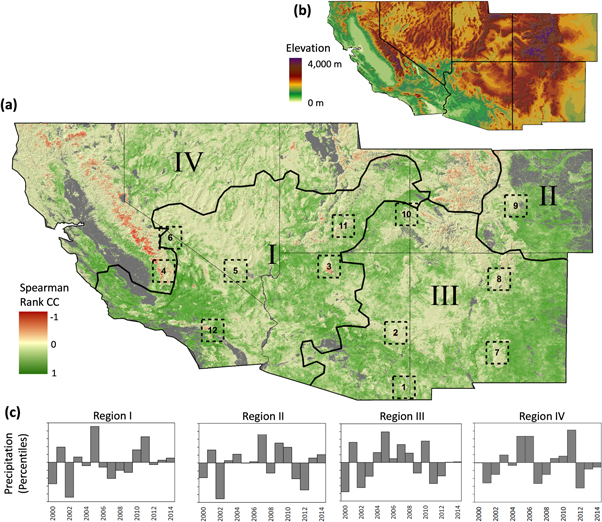
Figure 1. (a) Spearman rank correlation coefficient between annual average MODIS NDVI and annual total PRISM precipitation (2000–2014) draped over shaded relief map of the SW US. Four sub-regions of analysis (clusters with similar rainfall dynamics) are delineated by thick continuous borders and Roman numerals. The locations of 12 subsets selected for detailed analysis are shown by dashed boxes. Pixels not included in the analysis based on their land cover are grayed out. (b) Elevation map of the SW US (c) interannual precipitation variability shown for each sub-region of analysis (expressed as percentiles of precipitation per hydrological year with respect to the 2000–2014 period, averaged for each sub-region).
Download figure:
Standard image High-resolution image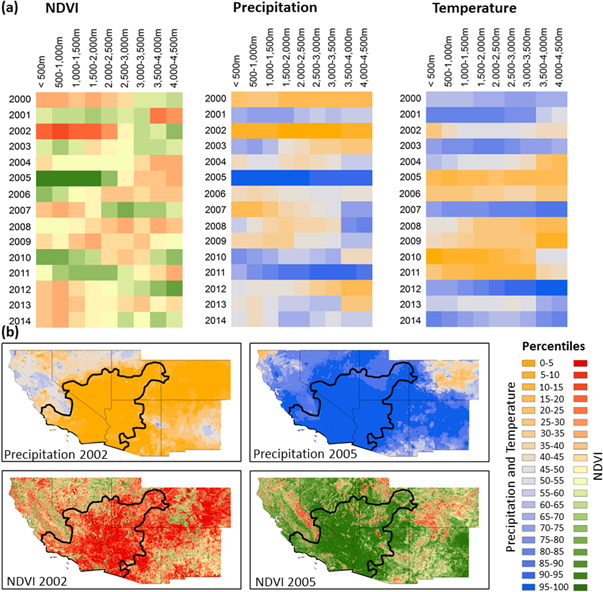
Figure 2. (a) Color matrix representation of average percentiles of NDVI, precipitation and temperature respectively by elevation zone in 500 m increments for Region I, highlighting the uniformity of dry anomalies in 2000 and 2002 and wet anomalies in 2005 and 2011 across all elevations. By contrast, the NDVI shows a divergent pattern between lower (<2500 m) and higher (>2500 m) elevations. (b) A juxtaposition of the spatial patterns and extent of dry anomalies in 2002 and wet anomalies in 2005 contrast the spatial uniformity of precipitation in those years in Region I (bold outline) with the elevation modulated patterns of NDVI.
Download figure:
Standard image High-resolution imageThe relationships between (1) the Spearman rank correlation coefficient of precipitation and NDVI and (2) elevation of each pixel were extracted and visualized for each subset (figure 3). The potential influence of snow cover on these relationships was taken into consideration by dividing pixels into five classes based on the average number of MODIS periods with snow cover in the predefined DOY 60–306 growing season for the analysis period 2000–2014. Snow cover information was obtained from the pixel reliability parameter, which is directly derived from the MOD10 MODIS snow/ice product suite (Hall et al 2002). The classes are: no snow cover, up to one MODIS period with snow cover out of 15, above one and up to two periods of snow cover, above two and up to four periods of snow cover, and above four periods of snow cover.

Figure 3. Scatterplots of the Spearman rank correlation coefficient between precipitation and NDVI (x-axis) and elevation (y-axis) for 12 subsets of 100 × 100 km each (160 000 pixels). Data points are color-coded based on the average number of periods with snow cover within the growing season DOY 60–306: black = 0; red = above 0 and up to 1; green = above 1 and up to 2; blue = above 2 and up to 4; yellow = above 4.
Download figure:
Standard image High-resolution imageLastly, we analyzed relationships of NDVI at low and high elevation with precipitation, temperature and the incidence of snow for the twelve subsets, using Spearman rank correlation coefficients (figure 4). To this end, we extracted all variables for the lowest and highest 500 m vegetation class present in each subset with a minimum of 100 pixels. In order to minimize the influence of substantial snow cover, only pixels with an average of no more than two periods of snow cover during the DOY 60-306 window were included in this analysis. The potential impact of this residual snow on the NDVI-precipitation correlations was addressed in an ad-hoc sensitivity analysis, which is included in the supplementary material.
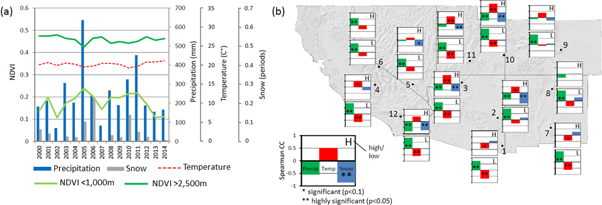
Figure 4. Temporal patterns of climate and vegetation variables and their relationships: (a) temporal profiles of annual precipitation, mean annual temperature, snow periods as well as mean annual NDVI at low (<1000 m) and high elevation (>2500 m) for subset12. Precipitation, temperature, and snow counts were averaged over the entire area of the subset (after exclusion of pixels with more than two periods of snow cover in the DOY 60-306 window), whereas NDVI is differentiated by elevation. (b) Map graphic contrasting correlations between NDVI and climate variables at low and high elevations for the 12 subsets. Spearman rank correlation coefficients between NDVI and the climate variables (annual precipitation (green), mean annual temperature (red), number of MODIS periods with snow cover (blue)) were averaged for the lowest and highest elevation class in each subset containing at least 100 pixels. For exact spatial extent of the subsets, see figure 1.
Download figure:
Standard image High-resolution image
3. Results and discussion
In the predominantly semi-arid climate of the SW US, the vegetation greenness index NDVI and precipitation are expected to co-vary (Nemani et al 2003). Our results confirm this tight coupling between rainfall and NDVI dynamics (figure 1). About two thirds of the study area show significant (p < 0.1) positive correlation between percentiles of annual NDVI and precipitation. In less than 3% of the study area, the two variables are significantly (p < 0.1) negatively correlated. There is no significant relationship between NDVI and precipitation in the remaining one third of the study area. Spatially, NDVI and precipitation are weakly correlated or negatively correlated mostly at higher elevations, whereas in the low and middle elevations, as expected, strong positive correlations between the two variables predominate. Analysis with temperature instead of precipitation as the driving climate variable, corroborates a reverse relationship of primarily water limited ecosystems (lowland deserts) and temperature controlled ecosystems (high montane forests) (not shown at the regional level).
This elevation-regulated divergent response of the vegetation productivity to climatic drivers is illustrated in figure 2(a), which represents the interannual dynamics of NDVI, precipitation and temperature by elevation class for Region I. Maps of percentiles of precipitation and NDVI in figure 2(b) provide a spatial visualization of patterns of precipitation and NDVI in the dry year 2002 and the relatively wet year 2005.
Region I, covering western Arizona, Southern California, Southern Nevada and Southern Utah, most compellingly illustrates the divergent vegetation response, with its pronounced drought years (in the 10th to 15th percentile of precipitation) in 2000 and 2002, and relatively wet years (above the 80th percentile) in 2005 and 2011 years. These dry and wet years occurred region-wide and are uniform across all elevation classes. Dry years tended to be accompanied by above average temperatures and vice versa for wet years. The NDVI, by contrast, shows a divergent response in these years, at around 2500 m. Below 2500 m, dry years were associated with below average vegetation productivity; above 2500 m, the response of the vegetation to below normal precipitation was positive. This positive response coincided with relatively high mean temperatures in 2000. During relatively wet years (2005 and 2011), we observed the opposite patterns of less productivity at higher elevation and more productivity at low elevation in response to precipitation (figure 2(a)).
At the level of the twelve subsets, the scatterplots in figure 3 show predominantly positive Spearman correlation coefficients between NDVI and precipitation at elevations below 2000–2500 m, which consistently give way to negative correlations at higher elevations. The majority of pixels with negative NDVI-precipitation correlations are made up of the GAP classes forest and woodland (87%), followed by shrubland and grassland (8%), semi-desert (3%), and non-vascular sparse vegetation (2%). The sign reversal of the correlations is observed across the latitudinal and longitudinal gradients of the study area and can therefore be considered robust. It indicates a divergent response of montane ecosystems to precipitation and captures the transition from water limited to temperature limited ecosystems. The latter experience increased productivity in years with lower precipitation, due to reduced cloudiness, which translates into more sunlight and warmer temperatures typically associated with dry years (Weiss et al 2012). A similar phenomenon was postulated to have contributed to a greening up of the Amazon rainforest during the short 2005 drought (Nemani et al 2003, Saleska et al 2007).
The scatterplots also indicate that, for some pixels in some of the subsets, snow cover likely plays a role in the negative response of NDVI to precipitation at higher elevations. Even though areas of perennial snow cover were avoided in the selection of subsets, it was inevitable that a minority of the pixels in the subsets are still affected by ephemeral snow cover for part of the time window DOY 60–306. Some of these pixels represent tundra equivalent ecosystems above the treeline that are dominated by non-vascular and sparse vascular rock vegetation and hence are characterized by very low vegetation productivity to begin with. Other snow-affected pixels are found in the montane forest zone. In years with less precipitation, less snow cover is expected in those pixels, with two compounding effects on the NDVI: (1) reduced snow cover means more opportunities for foliar growth due to more insolation and a longer period of photosynthesis (Nemani et al 2003, Weiss et al 2012); (2) reduced snow cover exposes more green vegetation to the satellite sensor, thus resulting in a higher NDVI value without necessarily a change in vegetation productivity (see supplementary material indicating that these effects do not change the overall correlation patterns). Differences in the NDVI-precipitation relationships at equal elevations might be explained by land cover type and terrain topography, such as slope and aspect, which modulate water stress by affecting site moisture (Gitlin et al 2006).
To better elucidate the vegetation productivity response, the following results were obtained after excluding pixels with an average of more than two periods of snow cover from the analysis. Figure 4(a) illustrates the divergent response of vegetation to dry and wet years at the example of one of the subsets. In particular, the dry year of 2002 and the relatively wet years of 2005 and 2011 stand out. As expected, wet years are accompanied by an increase, and dry years by a decrease, of NDVI at low elevations. At high elevations, which are characterized by denser and more productive vegetation, as indicated by an overall higher NDVI curve compared to the lower elevation NDVI, the NDVI response to precipitation is reversed. Thus, a marked decline in NDVI at high elevations occurs in the wet year of 2005, whereas high elevation NDVI appears above average in the dry year of 2002. Slight decreases in temperature are associated with the wet years, and vice versa. The occurrence of pixels flagged as snow remains low overall as a result of having excluded heavily snow-affected areas from the analysis, and variable from year to year.
As shown in figure 4(b), the divergence in NDVI response between low and high elevations is quite pronounced in most subsets. Positive correlations between NDVI and precipitation in the lowest elevation class present in each subset are all highly significant (see also green color in figure 1); for the highest elevation class, the correlations between both variables are either insignificant or negative (see also yellow and red colors in figure 1), with the exception of Subset 6 (White Mountains of California/Nevada). The directions of the correlations are largely maintained, though their significances weakened, when attempting to correct for the potential effects of residual snow (table S1). By contrast, temperature and NDVI are correlated negatively or do not show any significant correlation in the lowest elevation class; in the highest elevation class, higher temperatures are mostly associated with higher NDVI, with the exceptions of Subset 1 (Chiricahua Mountains) and Subset 7 (Sierra Blanca Mountains), where significant negative correlations between temperature and NDVI persist even in the highest elevation class. Both subsets are among the southernmost, where heat stress rather than cold temperature limitations prevails at all elevations. While pixels heavily affected by snow had been excluded from the analysis, the remaining incidence of snow, negligible at low elevations, showed significantly negative correlations with NDVI at high elevations in half of the subsets. The presence of disturbances from fire or pest infestations (McDowell et al 2015b) might weaken the observed correlations between climate and vegetation productivity.
A number of studies have documented heat- and drought-induced tree mortality (Breshears et al 2005, Gitlin et al 2006, van Mantgem et al 2009, Allen et al 2010) and uphill (Kelly and Goulden 2008, Crimmins et al 2009 and 2010) as well as downhill (Crimmins et al 2011) species shifts in response to changes in the hydroclimatic conditions in the SW US. The results of our study, by contrast, show broad vegetation productivity response patterns, regardless of species composition. Thus, the increasing montane vegetation productivity at high elevation during drought years does not exclude the possibility of a simultaneous shift in species composition, as different species are affected differently by mortality and different bioclimatic niches open (Mueller et al 2005).
Although the indicator NDVI used in this study provides an integrative measure of overall photosynthesis and productivity, additional information about vegetation composition and species-specific dynamics would further elucidate fine-scale responses. Nevertheless, our analysis does quantify a counterintuitive increase in productivity during warmer drought periods in some high elevation locations. These episodes may drive rapidly expanding or shifting bioclimatic niches and may contribute to both losses and increases in biodiversity along topographic gradients rather than an even and upward shift of species in response to a warming climate (Crimmins et al 2011). The complex, species level response to the precipitation and productivity patterns that are described in this study warrant further and more detailed examination to understand its implications within a changing climate (McDowell et al 2015b). Regardless, this study illustrates the importance of topoclimatic variability and its potential implications for ecosystem functions across the SW US.
Our findings corroborate the high elevation increase in vegetation growth documented earlier in the European Alps during the heat wave of 2003 (Jolly et al 2005, Leonelli et al 2011), as well as in the high latitude boreal forests of the northern hemisphere (Myneni et al 1997, Beck et al 2011). Unlike the 1950s drought, which had not been associated with warmer than average temperatures (Breshears et al 2005, Weiss and Overpeck 2005, Weiss et al 2012), the 2000s drought is characterized by concurrent above-average temperatures. This co-occurrence of two extremes, which makes drought impacts worse at lower elevations (i.e., the majority of the SW US) (AghaKouchak et al 2014), might actually be benefitting plant productivity in a very small portion of the Southwest ecosystem, the high elevation montane forests, which constitute 5.8% of our study area.
4. Conclusions
We analyzed the relationship between NDVI and climate drivers along an elevation gradient across the SW US at scales from regional to local. Our analyses show divergent responses of SW US ecosystems to dry and wet years at different elevations, with high elevation forests experiencing increases or no significant change in productivity during drought years as measured by NDVI, while the large low lying areas of the region suffer productivity declines. The elevation-explicit analysis captures the transition from water-limited to temperature-limited ecosystems, which often co-exist within a short distance along the pronounced elevation gradient of the SW US. The gains in vegetation productivity during drought years at high elevations could be the result of warmer temperatures as well as the decline in snow cover, which impacts remotely sensed NDVI in two ways, by: (1) more opportunity for photosynthetic activity and by (2) exposure of more green vegetation to the sensor view.
As climate change is expected to intensify drought severity and frequency as well as increase temperatures in the SW US (Seager et al 2007, Cook et al 2015), hotter droughts are bound to become more common, with potential impacts on the region's ecosystem composition, structure and function. While these trends could mean temporary benefits for vegetation productivity at high elevations, as this and previous studies (Jolly et al 2005, Crimmins et al 2009, Leonelli et al 2011) suggest, higher evaporative demand and decreasing moisture supply are likely to outpace these benefits in the longer term, as has already been observed in the higher latitudes (Barber et al 2000, Verbyla 2008, Zhao and Running 2010). Moreover, the reduction or loss of the snowpack, while spurring vegetative growth in the immediate neighborhood of the diminishing snow cover, has negative effects on vegetation productivity downhill, where lack of runoff from the snowpack reduces water availability (Trujillo et al 2012). Thus, the high elevation vegetation productivity gains in warm drought years, could be both temporary and overshadowed by the larger losses at the regional scale.
Acknowledgments
This work was supported by NASA EOS-MODIS grant number NNX14AI74G and NASA S-NPP-VIIRS cooperative agreement number NNX14AP69A (K Didan, PI). We thank the three anonymous reviewers for their valuable comments, which helped improve the quality of the manuscript.