

Abstract
Recent droughts and heatwaves showed the vulnerability of the electricity sector to surface water constraints with reduced potentials for thermoelectric power and hydropower generation in different regions. Here we use a global hydrological-electricity modelling framework to quantify the impacts of recent drought and warm years on hydropower and thermoelectric power usable capacity worldwide. Our coupled modelling framework consists of a hydrological model, stream temperature model, hydropower and thermoelectric power models, and was applied with data of a large selection of hydropower and thermoelectric power plants worldwide. Our results show that hydropower utilisation rates were on average reduced by 5.2% and thermoelectric power by 3.8% during the drought years compared to the long-term average for 1981–2010. Statistically significant (p < 0.01) impacts on both hydropower and thermoelectric power usable capacity were found during major drought years, e.g. 2003 in Europe (−6.6% in hydropower and −4.7% in thermoelectric power) and 2007 in Eastern North America (−6.1% in hydropower and −9.0% in thermoelectric power). Our hydrological-electricity modelling framework has potential for studying the linkages between water and electricity supply under climate variability and change, contributing to the quantification of the 'water-energy nexus'.

Original content from this work may be used under the terms of the Creative Commons Attribution 3.0 licence. Any further distribution of this work must maintain attribution to the author(s) and the title of the work, journal citation and DOI.
1. Introduction
Droughts can impact electricity supply, in terms of both water availability for hydropower generation and cooling water usage for thermoelectric (e.g. nuclear, fossil-, biomass-fuelled) power generation. At present, hydropower and thermoelectric power contribute 17% and 81% of world's total electricity generation, respectively (EIA accessed 2015). Recent droughts and heat waves showed the vulnerability of the electricity sector to surface water constraints with reduced potentials for thermoelectric power (Förster and Lilliestam 2010) and hydropower generation (Kuusisto 2004). This has shown to be problematic in particular when peak electricity demands are high (e.g. from air conditioning). Potential increases in the severity of streamflow droughts (e.g. Prudhomme et al 2014, Trenberth et al 2014) and heatwaves (e.g. Christidis et al 2015) under changing climate will therefore directly impact energy security.
Impacts of recent droughts on the hydropower and thermoelectric power sector have mainly been studied for parts of the United States (e.g. NETL 2009a, 2009b) and for European countries (e.g. Fink et al 2004, IAEA 2004, Rübbelke and Vögele 2011), showing a reduced reliability of the power supply system. Limited power supply combined with increased generation costs during droughts and heatwaves can have substantial economic impacts, such as significant rises in electricity prices (Boogert and Dupont 2005, Mcdermott and Nilsen 2014, Pechan and Eisenack 2014). Most of these studies focused on individual countries or states, while the geographic distribution of droughts and heatwaves often exceeds country and state levels. Therefore large-scale studies and modelling tools to perform such assessments are needed to understand the impacts of water constraints on water-dependent power generation.
While integrated assessment models (IAMs) are powerful tools for large-scale energy studies (e.g. GEA 2012, van Vuuren et al 2012), most IAMs are developed for scenario analyses, providing output at coarse spatial and temporal resolutions and do not yet include detailed processes that incorporate regional or local impacts of water constrains on power supply (Clarke et al 2014). At present, coupled hydrological-electricity modelling approaches are therefore more suitable for studying the impacts of water constraints during historical and future droughts and warm events (e.g. Pereira-Cardenal et al 2014). However, a limited number of studies have analysed these impacts on electricity supplies at the large scale.
Here we show the impacts of recent drought and warm years on both hydropower and thermoelectric power usable capacity in regions worldwide. We used a hydrological-electricity modelling framework which was applied to 24 515 hydropower plants and 1427 thermoelectric power plants worldwide (section 2.1). We identified critical years with streamflow drought and high water temperature and quantified to what extent hydropower and thermoelectric power usable capacity were impacted during these drought, warm years in different regions (sections 2.2 and 3). In addition, we discuss the main uncertainties and usability of these results for large-scale management of the electricity sector (section 4).
2. Methodology
2.1. Hydrological-electricity modelling
We used a coupled hydrological-electricity modelling framework consisting of a hydrological model, stream temperature model, hydropower and thermoelectric power models, which is described in van Vliet et al (2016). This modelling framework focuses on the physical impacts of water constraints under climate variability on power plant usable capacities. Impacts of land use changes and economic feedbacks of the assessed water constraints (e.g. supply demands portfolio, electricity prices) are not modelled. The hydrological component consists of the variable infiltration capacity (VIC) model (Liang et al 1994), which is a grid-based macro-scale hydrological model that solves both the surface energy and water balances. The reservoir scheme of Haddeland et al (2006) which is combined with the routing model of Lohmann et al (1998) was used to include reservoir impacts on streamflow. This scheme assumes that reservoir operations follow simple operational rules based on the purpose(s) of dams (Haddeland et al 2006). The water temperature component of our modelling framework consist of the physically based stream temperature river basin model (RBM), which solves the 1D-heat advection equation (Yearsley 2009, 2012). RBM was previously modified for application on a worldwide level and to include effects of heat effluents from thermoelectric power plants and reservoir impacts on water temperature (van Vliet et al 2012a, 2012b).
Hydropower usable capacity for each hydropower plant was simulated based on regulated streamflow simulations from VIC, hydraulic head, total efficiency of the power generating unit, density of fresh water and the gravitational acceleration (see supplementary section 1). Thermoelectric power usable capacity was quantified using the model of Koch and Vögele (2009), which was modified as described in van Vliet et al (2012b). This model simulates the required water demand for cooling and usable capacity based on, amongst others, simulated streamflow and water temperature at the thermoelectric power plant site, both the total efficiency and electric efficiency, various parameters related to the cooling system type and environmental limitations for cooling water use (i.e. maximum river temperature (increase) and fraction of streamflow to be withdrawn). The model equations for calculating hydropower usable capacity and thermoelectric power usable capacity are presented in the supplementary section 1. For details of the coupled modelling framework and input datasets we refer to the supplementary information of van Vliet et al (2016).
We used the global Watch Forcing Data Era Interim meteorological dataset (Weedon et al 2014) as input into the VIC hydrological model and RBM stream temperature model to produce simulations of daily streamflow and water temperature on 0.5° × 0.5° spatial resolution worldwide for the period of 1979–2010 (including two years spin-up period). The modelling estimates of streamflow and water temperature were evaluated using observed station records of daily streamflow and water temperature worldwide, which showed a realistic representation of the observed conditions (see supplementary information of van Vliet et al (2016) for a general overview of the model performance and supplementary figure S1 for more detailed results for selected stations).
We applied the hydropower and thermoelectric power models on the plant individual level and extracted daily simulated streamflow and water temperature for 1981–2010 for the grid cell in which each power plant is situated. An evaluation of the impacts of biases (uncertainties) in simulated streamflow and water temperature on usable power plant capacity showed moderated impacts for most of the hydropower plants and thermoelectric power plants included in the uncertainty analysis (see supplementary section 2.3, supplementary table S1 and supplementary figures S3–S5).
We obtained information of power plant characteristics from the World Electric Power Plant Database (WEPPD) version 2013 (UDI 2013). The latitude and longitude of each power plant, hydraulic head for hydropower plants and water temperature limitations for thermoelectric power plants were derived as described in the supplementary information of van Vliet et al (2016) along with a quantification of the uncertainties in deriving these parameter estimates. For hydropower, we focused on conventional plants. For thermoelectric power we selected plants with availability of information on cooling system type, installed capacity, source of fuel, and use of river water for cooling. In total 24 515 hydropower plants and 1427 thermoelectric power plants are included (figure 1), which contribute to 78% of the installed hydropower capacity and 28% of the installed thermoelectric power capacity worldwide as reported by the Energy Information Administration (EIA accessed 2015). This smaller percentage for thermoelectric power is because more information for power plant characteristics (e.g. related to cooling system) is needed to parametrise the thermoelectric power model than for the hydropower model. The geographic distribution and age distribution of the selected plants was found to be representative for the full thermoelectric and hydropower power plant portfolio (see supplementary information of van Vliet et al 2016). Simulations of hydropower and thermoelectric power were previously evaluated using observed records on the country level for 1981–2010 (EIA accessed 2015). This showed that the interannual variability was slightly overestimated for some African countries, but for most countries worldwide the observed trends were realistically represented (see supplementary information of van Vliet et al (2016) for a general overview of the model performance and supplementary figure S2 for simulated and observed time series of selected countries).

Figure 1. Spatial distribution of hydropower plants (blue) and thermoelectric power plants (red) from WEPPD and 12 subregions (grey-scale) for analysis of impacts of drought and warm years on hydropower and thermoelectric power usable capacity. Subregions were defined by Giorgi and Francisco (2000) and adapted by Sheffield and Wood (2007). Full names of selected subregions and number of hydropower plants and thermoelectric plants per subregion are listed in table 1.
Download figure:
Standard image High-resolution image2.2. Hydropower and thermoelectric power during recent drought and warm years
We used the gridded simulations of streamflow and water temperature to identify critical years with streamflow drought and high water temperature over 1981–2010. We quantified on a gridcell basis the mean number of days per year with streamflow smaller than the 10-percentile streamflow value, which is a widely used index for extreme low flow (Smakhtin 2001, Tharme 2003, Pyrce 2004). For water temperature, we quantified the number of days per year with values higher than the 90-percentile water temperature over the period 1981–2010. In addition, we calculated the number of days that both low flow and high water temperature coincide. As streamflow droughts and high water temperature events overall occur on a smaller geographic level than continental scale, we aggregated results over all gridcells per subregion to identify critical drought and warm years. We used the subregions defined by Giorgi and Francisco (2000) and adapted by Sheffield and Wood (2007). We focused our analyses of impacts of recent drought and warm years on 12 subregions with the highest number of hydropower and thermoelectric power plants and installed capacity according to the used plant dataset (figure 1). These 12 subregions together comprise 90% of the hydropower plants (n = 22 141) and 93% of the thermoelectric power plants (n = 1321) of the plant dataset.
For hydropower we identified recent critical years by selecting the three years with the highest number of days with streamflow drought in each subregion. In a similar way, we identified critical years for thermoelectric power by selecting the three years with highest number of days that both streamflow drought and high water temperature coincided. We focused on the three most critical years to show the impacts of drought and warm years with an average reoccurrence of about once every ten years in each subregion, and to compare impacts on this reoccurrence level between different subregions. In a next step, we quantified to what extent the usable capacity of all power plants per subregion deviated during these critical drought years compared to the average situation for 1981–2010. To eliminate the impacts of increasing trends in usable capacity due to increases in installed capacity over 1981–2010, we calculated annual average utilisation rates by dividing simulated usable capacity by installed capacity of each power plant and for each year. These utilisation rates of hydropower and thermoelectric power were subsequently aggregated over all power plants per subregion. Non-parametric Wilcoxon rank sum tests (Wilcoxon 1945) were then used to quantify to what extent hydropower and thermoelectric power utilisation rates deviated significantly during these drought and warm years compared to the average for 1981–2010. In addition, we quantified impacts of drought and warm years on plants at the individual level to explore the spatial variability in response of hydropower and thermoelectric power plants within the same subregion.
3. Results
3.1. Identification of streamflow drought and high water temperature years
Annual time series with the mean number of days with streamflow drought and high water temperature are shown for the 12 subregions with the largest number of hydropower and thermoelectric power plants (figure 2). Aggregating results over all gridcells per subregion (solids lines) or only over gridcells where hydropower and thermoelectric power plants are situated (dotted, dashed lines) had overall very limited impacts on the identification of the critical years with streamflow drought (for hydropower) and critical years with both streamflow drought and high water temperature (thermoelectric power).

Figure 2. Identification of streamflow drought and high water temperature years. Mean number of days per year were quantified with streamflow drought (blue), high water temperature (red), and days that streamflow drought and high water temperature coincide (black) for 1981–2010.
Download figure:
Standard image High-resolution imageMost severe streamflow droughts for hydropower and thermoelectric power were detected in northern Europe (2003) and in southern Africa (1992) with almost 100 days of streamflow drought (i.e. values lower than the 10-percentile streamflow). Most severe high water temperature years were found for the Amazon region (1998, 2010) with more than 100 days of high water temperature (i.e. values higher than the 90-percentile water temperature) (figure 2).
Comparison of these time series shows that detected years with streamflow drought and high water temperature highly differ between subregions. However, some streamflow drought and high water temperature events exceed the boundaries of subregions during some critical years. This was found for example for 1988 in North America (WNA, CNA, ENA), 2003 in Europe (NEU, MED) and 2007 in the eastern United States (CNA, ENA) with large regions with streamflow drought for more than 100 days and high water temperature for more than 50 days (figure 3; left and middle panel). Boundaries of subregions were also exceeded for example for 2009 in Asia (CAS, EAS, SAS) and 2010 in South America (AMZ, SSA) with large areas of more than 100 days of high water temperature (figure 3; middle panel). Areas where streamflow drought and high water temperature coincided for more than 50 days are rather small and are mainly located in central Europe (2003), the most northern part of India (2009) and the northern part of South America (2010) (figure 3; right panel).

Figure 3. Regional patterns with number of days in the given year with streamflow drought (left), high water temperature (middle), and that both events coincide (right). Results are presented for a selection of critical years with both streamflow drought and high water temperature. Scale for right figure panels (streamflow drought and high water temperature) differs from the scale of the left (streamflow drought) and middle (high water temperature) panels.
Download figure:
Standard image High-resolution imageTable 1 shows an overview of the three most severe streamflow drought years (for hydropower) and the three most severe years with streamflow drought and high water temperature (thermoelectric power) for each subregion for 1981–2010. While the critical years for hydropower and for thermoelectric power do not necessary coincide, we found for all subregions (except East Asia) at least one (out of the three) similar critical years for both hydropower and thermoelectric power (see years indicated in bold in table 1).
Table 1. Overview of critical years with streamflow drought and high water temperature per subregion.
| Region name | Region abbre-viation | n hydro- power plants | n thermo- electric power plants | Critical years hydropower | Critical years thermo- electric power |
|---|---|---|---|---|---|
| North America | |||||
| Western North America | WNA | 1193 | 102 | 1988, 2001, 2002 | 1981, 1988, 2002 |
| Central North America | CNA | 980 | 212 | 1987, 1988, 1989 | 1988, 2000, 2006 |
| Eastern North America | ENA | 2071 | 184 | 1998, 2001, 2007 | 1995, 2002, 2007 |
| South America | |||||
| Amazon | AMZ | 1317 | 12 | 1992, 2007, 2010 | 1983, 1998, 2010 |
| Southern South America | SSA | 1078 | 19 | 1981, 1999, 2006 | 1986, 1999, 2006 |
| Europe | |||||
| Northern Europe | NEU | 4281 | 218 | 1983, 1989, 2003 | 1990, 1991, 2003 |
| Mediterranean | MED | 6479 | 169 | 1985, 1986, 2003 | 1994, 2003, 2009 |
| Africa | |||||
| Southern Africa | SAF | 181 | 15 | 1982, 1992, 1995 | 1983, 1984, 1992 |
| Asia | |||||
| Central Asia | CAS | 806 | 33 | 1985, 2000, 2001 | 1984, 1985, 2000 |
| East Asia | EAS | 2255 | 217 | 1998, 1999, 2003 | 1994, 1997, 2001 |
| Southern Asia | SAS | 1370 | 120 | 1983, 1992, 2009 | 2003, 2009, 2010 |
| Australia | |||||
| Australia | AUS | 130 | 20 | 1982, 2003, 2006 | 1983, 1998, 2003 |
Note: years indicated in bold are critical years for both hydropower and thermoelectric power. Years underlined indicate that usable capacity was reduced significantly (Wilcoxon Rank Sum tests; p < 0.05) compared to the long-term average over 1981–2010.
3.2. Impacts of drought and warm years on hydropower and thermoelectric power
On a mean worldwide level, simulated hydropower utilisation rates were on average reduced by 5.2%, and thermoelectric power by 3.8% during the investigated drought years compared to the average for 1981–2010. These global average values were obtained by calculating the average plant utilisation rate of the three critical years compared to the long-term average utilisation rate for 1981–2010, and then averaging the results over all plants worldwide. Boxplots with the distributions of utilisation rates of all hydropower plants for the 12 subregions are shown in figure 4(a). Values of 1 indicate that a power plant works at full capacity (no constraints) while for instance a value of 0.8 indicate that the plant works at 80% of the maximum capacity. The boxplots show that in Central North America, Eastern North America and Northern Europe, impacts of water constraints on hydropower utilisation are lowest, while impacts in Australia and East Asia are overall largest. This is related to the drier conditions and larger variability in streamflow in these regions. The interannual variability in utilisation rates of hydropower is highest in Australia and Southern Africa, but this might also be partly due to the low number of hydropower power plants in Australia (n = 130) and Southern Africa (n = 181) compared to the other subregions (n > 800) over which the results are aggregated. In most subregions, hydropower utilisation rates were significantly reduced (p < 0.05) for two out of the three critical drought years. For Western North America, Northern Europe, Mediterranean, Central Asia and East Asia, the hydropower utilisation rates were reduced significantly for all three investigated drought years (table 1).

Figure 4. Impacts of streamflow drought and high water temperature on utilisation rates of hydropower (a) and thermoelectric power (b) for 1981–2010. Boxplots with distributions of utilisation rates of hydropower are presented for 12 subregions and for thermoelectric power for 6 subregions with the largest number of plants and installed capacity. Highlighted years indicate that utilisation rates were reduced significantly (p < 0.05) compared to the average over 1981–2010.
Download figure:
Standard image High-resolution imageBoxplots with utilisation rates of thermoelectric power are presented for the six subregions with highest number of thermoelectric power plants (figure 4(b)). Our results show overall lower utilisation rates than for hydropower, which is expected as thermoelectric power usable capacity can be constrained by more factors (i.e. streamflow drought and high water temperature) and benefits less from storage of water in reservoirs during low flow conditions than conventional hydropower plants. Although considerable impacts of water constraints on thermoelectric power utilisation were found, these reductions were statistically insignificant (p > 0.05) for most critical drought and warm years compared to the average of 1981–2010.
We found however strong significant (p < 0.01) impacts on both thermoelectric power and hydropower utilisation rates during major critical years, such as 2003 in Europe (Northern Europe and Mediterranean) and 2007 in Eastern North America. During the drought year of 2003 in Europe, simulated hydropower utilisation was significantly (p < 0.01) reduced by 6.6% and thermoelectric power by 4.7% compared to the average of 1981–2010. Although the absolute values of hydropower utilisation rates are distinctly lower for the Mediterranean than for Northern Europe (figure 4), the relative changes (percentage reductions) in usable capacity for 2003 compared to the long-term average of 1981–2010 were larger for most hydropower power plants and thermoelectric power plants in Northern Europe than in the Mediterranean region (figure 5(a)). This discrepancy is partly due to the fact that power plants in the Mediterranean are hampered by water constraints on a more regular basis, resulting in lower absolute values of plant utilisation rates and smaller relative changes in usable capacity for 2003 compared to the long-term average for 1981–2010. In addition, the wet winter and spring of 2003 in the Mediterranean region resulted in relatively higher plant utilisation rates which partly compensated for losses during summer and resulted in smaller reductions on annual average basis, while water availability and plant utilisation rates in Northern Europe were lower throughout most of the year of 2003 compared to the long-term average of 1981–2010. For the drought year of 2007 in Eastern North America significant (p < 0.01) reductions of 6.1% in hydropower and 9.0% in thermoelectric power utilisation rates were found. Largest declines were simulated for hydropower and thermoelectric power plants in the state Georgia (figure 5(b)) where largest reductions in streamflow occurred during the drought year of 2007 compared to the average of 1981–2010.

Figure 5. Change in hydropower and thermoelectric power usable capacity for the drought, warm year of 2003 in Europe (a) and 2007 in the Eastern North America (b) relative to the average for 1981–2010.
Download figure:
Standard image High-resolution image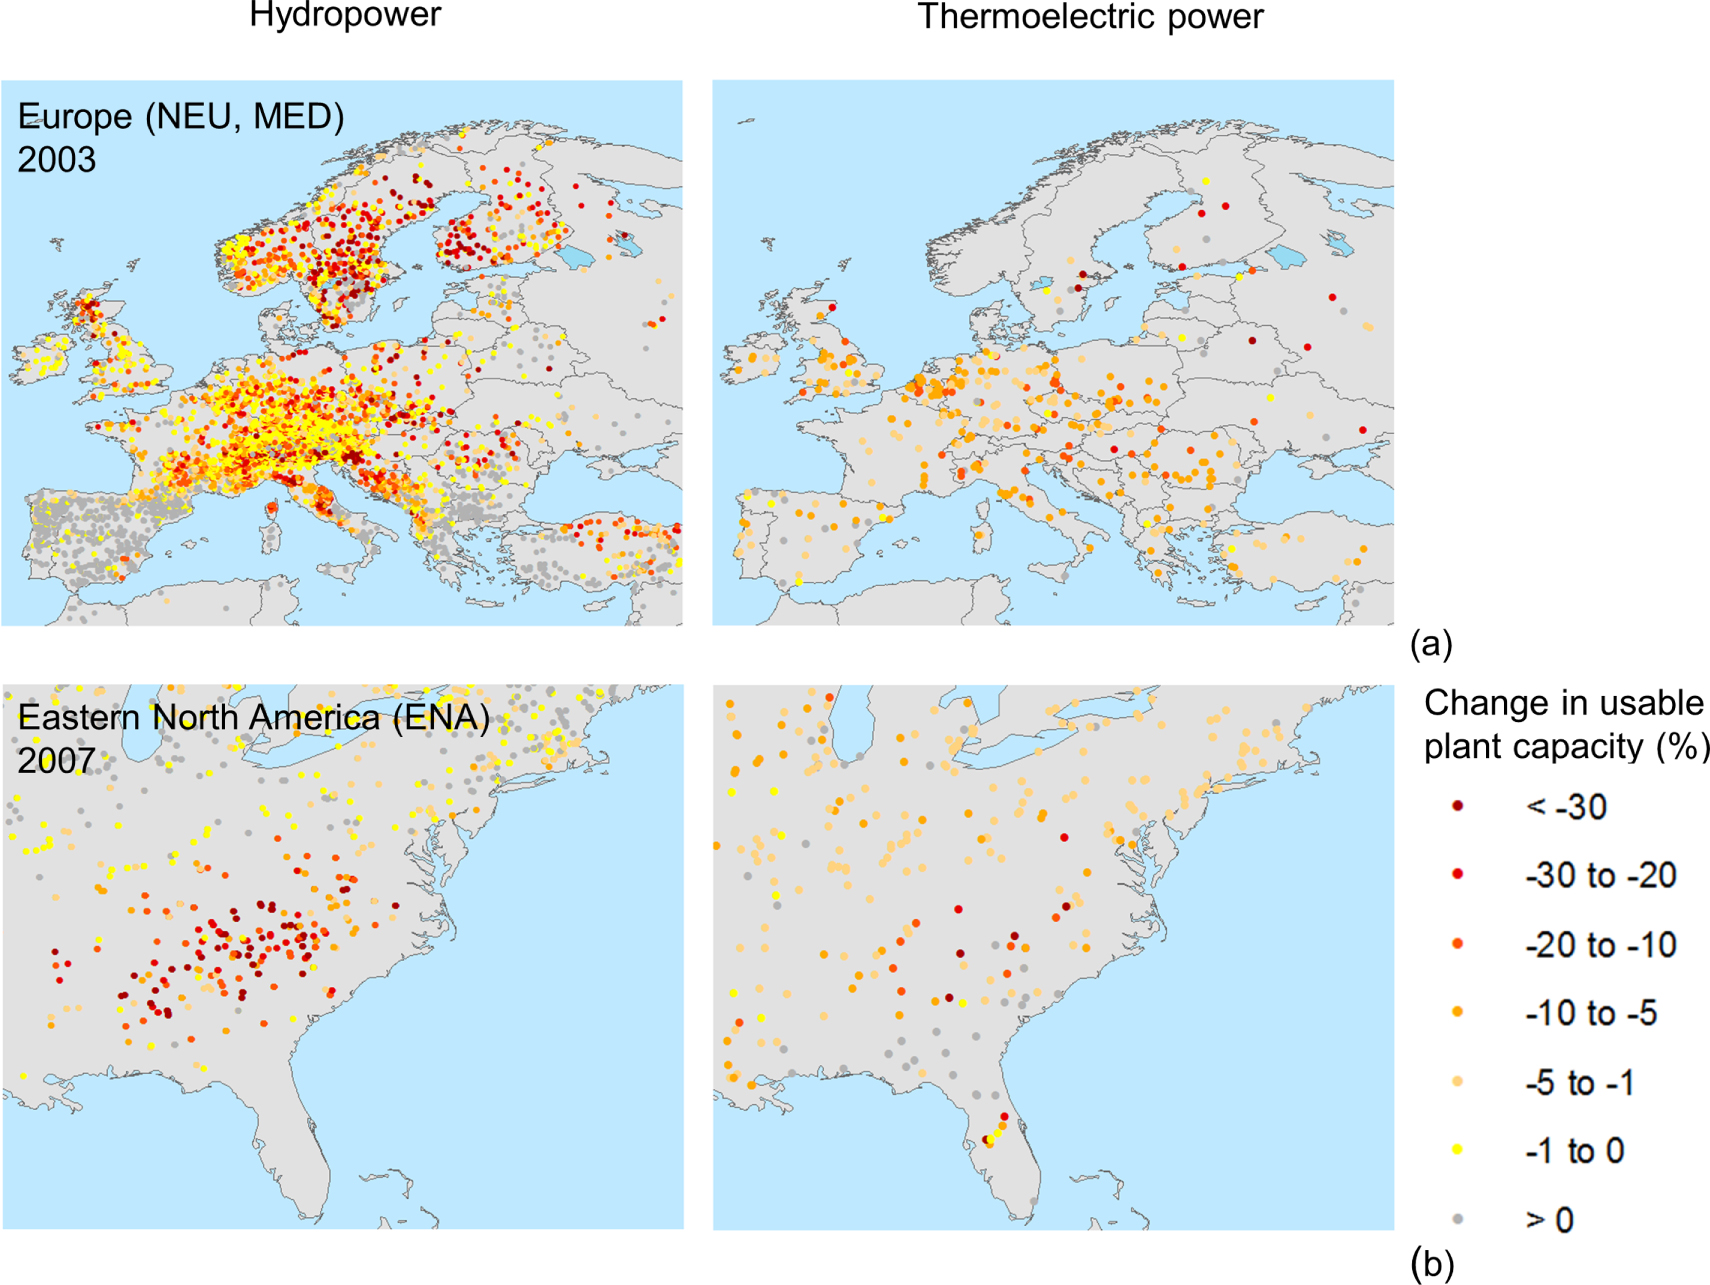
4. Discussion and conclusions
We identified recent years with streamflow drought and high water temperature in different subregions worldwide and studied how hydropower and thermoelectric power utilisation rates were impacted during the three most severe drought, warm years of 1981–2010 compared to the long-term average climate conditions of this 30 year period. Our results show that recent drought, warm years resulted on average in reductions of 5.2% in hydropower and 3.8% in thermoelectric power relative to the long-term average utilisation rates for 1981–2010.
A coupled hydrological-electricity modelling framework was used, which realistically represented the observed trends and interannual variability of streamflow, water temperature, hydropower and thermoelectric power generation in most regions worldwide and over long (30 year) periods (supplementary figures S1 and S2 and supplementary information of van Vliet et al 2016). However, uncertainties related to the structure and parameterisations of the used models are expected to influence the assessed impacts of droughts and warm years on hydropower and thermoelectric power usable capacity. Uncertainties related to the structure and parameterisation of the hydrological model and water temperature model are mainly attributed to heterogeneity in hydraulic characteristics and estimates of headwater temperatures (Yearsley 2012, van Vliet et al 2012a). Impacts of parameters uncertainties for the hydropower model and thermoelectric power model were previously quantified for derived estimates of hydraulic head and environmental limitations on cooling water use (supplementary information of van Vliet et al 2016). In addition to the impacts of uncertainties related to the various individual models, the use of a cascade of models (VIC hydrological model—routing model—RBM water temperature model—hydropower model and thermoelectric power model) may result also in a propagation of uncertainties (e.g. Freni et al 2011, Pappenberger et al 2012). We assessed the impacts of uncertainties in simulations of streamflow and water temperature on a selection of hydropower and thermoelectric power plants by comparing usable power plant capacity based on the simulations of streamflow and water temperature with values calculated based on observed streamflow and water temperature records of a nearby monitoring station for 1981–2010 (supplementary section 2.3). This showed moderated impacts (i.e. relative bias in simulated usable capacity of less than 10%) for most of the hydropower plants (72%) and thermoelectric power plants (78%) included in a sensitivity analysis. Impacts of uncertainties (biases) in simulated water temperature were higher, although the relative bias in simulated usable capacity is less than 10% for the majority (52% and 64%) of the thermoelectric power plants for the 1981–2010 period and for the drought, warm years, respectively (see supplementary section 2.3).
Our results show that hydropower utilisation rates were significantly reduced during the majority of investigated drought years and in almost all subregions, while reductions in thermoelectric power utilisation were only significant for a selection of drought, warm years compared to the average of 1981–2010 in some subregions (Western North America, East North America, Northern Europe, Mediterranean and East Asia). This discrepancy might be explained by the fact that thermoelectric power utilisation is overall constrained on a more regular basis, which results in lower absolute values of utilisation rates of thermoelectric power than for hydropower (figure 4) and relatively smaller (and statistically less significant) reductions during the drought, warm years compared to the average of 1981–2010. Thermoelectric power utilisation is hampered on a more regular basis than hydropower partly because of constraints in both water availability and temperature, which directly impact cooling water use potentials. In addition, there are differences in water management and institutional mechanisms (e.g. reservoir operational rules, environmental regulations for cooling water uses) that largely impact how hydropower and thermoelectric plants address streamflow variability. Conventional hydropower plants have overall large reservoirs that act as buffers by storing potential energy to help cope with hydrological variability. Although some thermoelectric power plants also benefit from flow regulation and water storage in reservoirs during the low flow period, most thermoelectric plants withdraw water for cooling purposes from rivers where water availability is not specifically optimised and regulated for thermoelectric cooling purposes (Schaeffer et al 2012). While simple operational rules are included in our hydrological-electricity modelling framework, the implementation of more comprehensive water management and institutional mechanisms (e.g. multi-reservoir operation and water allocation policies) (Oliveira and Loucks 1997) are recommended to better understand the impacts of droughts on hydropower and thermoelectric power usable capacity informed by both physical and anthropogenic driven constraints. However, limited access to data on real-world operations, or knowledge of operating rules, complicates the implementation of these mechanisms in a modelling framework on such a large scale.
Our results show that some streamflow drought and high water temperature events exceed the boundaries of subregions during some critical years (figure 3). This might have important implications, because when these events hamper hydropower and thermoelectric power generation in multiple subregions at once, the potential to alleviate power shortage through transmission is limited (e.g. van Vliet et al 2013, Bartos and Chester 2015).
For large-scale management of the electricity sector, especially the combination of streamflow drought with high water temperature is critical, because this can hamper both hydropower and thermoelectric power usable capacity with potentially drastic reductions of the reliability of the power supply system. Strong significant (p < 0.01) impacts of droughts on both hydropower and thermoelectric power utilisation were found during recent major droughts years, such as 2003 in Europe (reductions of 6.6% in hydropower and 4.7% in thermoelectric power) and 2007 in Eastern North America (6.1% in hydropower and 9.0% in thermoelectric power) (figure 5). Both events have been characterised as critical events with several power plants forced to reduce generation or shut down due to limited surface water and environmental restrictions on cooling water use (e.g. NETL 2009a, 2009b, Macknick et al 2011, Rübbelke and Vögele 2011).
Our hydrological-electricity modelling framework has potential for quantifying the impacts of future drought and warm events under climate change and human impacts developments on water-dependent electricity supply systems worldwide. Incorporation of the physical impacts of water constraints during drought, warm years from this study into energy models describing also the economic feedbacks (e.g. supply demand portfolio) would allow a more comprehensive understanding of the impacts of drought and warm events on the energy sector. The modelling framework has potential for studying how climate variability and change may affect the linkages between water and energy security, contributing to the quantification of the 'water-energy nexus' (Stucki and Sojamo 2012).
Acknowledgments
Dr Michelle van Vliet was supported by a contribution from the Niels Stensen Fellowship and a Veni-grant (project 863.14.008) of NWO Earth and Life Sciences (ALW). In addition, this research was part of the Water Futures and Solutions Initiative.