


Abstract
European air quality legislation has reduced emissions of air pollutants across Europe since the 1970s, affecting air quality, human health and regional climate. We used a coupled composition-climate model to simulate the impacts of European air quality legislation and technology measures implemented between 1970 and 2010. We contrast simulations using two emission scenarios; one with actual emissions in 2010 and the other with emissions that would have occurred in 2010 in the absence of technological improvements and end-of-pipe treatment measures in the energy, industrial and road transport sectors. European emissions of sulphur dioxide, black carbon (BC) and organic carbon in 2010 are 53%, 59% and 32% lower respectively compared to emissions that would have occurred in 2010 in the absence of legislative and technology measures. These emission reductions decreased simulated European annual mean concentrations of fine particulate matter (PM2.5) by 35%, sulphate by 44%, BC by 56% and particulate organic matter by 23%. The reduction in PM2.5 concentrations is calculated to have prevented 80 000 (37 000–116 000, at 95% confidence intervals) premature deaths annually across the European Union, resulting in a perceived financial benefit to society of US$232 billion annually (1.4% of 2010 EU GDP). The reduction in aerosol concentrations due to legislative and technology measures caused a positive change in the aerosol radiative effect at the top of atmosphere, reduced atmospheric absorption and also increased the amount of solar radiation incident at the surface over Europe. We used an energy budget approximation to estimate that these changes in the radiative balance have increased European annual mean surface temperatures and precipitation by 0.45 ± 0.11 °C and by 13 ± 0.8 mm yr−1 respectively. Our results show that the implementation of European legislation and technological improvements to reduce the emission of air pollutants has improved air quality and human health over Europe, as well as having an unintended impact on the regional radiative balance and climate.
Export citation and abstract BibTeX RIS

Original content from this work may be used under the terms of the Creative Commons Attribution 3.0 licence. Any further distribution of this work must maintain attribution to the author(s) and the title of the work, journal citation and DOI.
1. Introduction
Air pollutants have a detrimental effect on atmospheric visibility (Vautard et al 2009, Stjern et al 2011), ecosystems (Fowler et al 2009) and human health (Seaton et al 1995, Brunekreef and Holgate 2002). The World Health Organization (WHO) attributed 3.7 million annual premature deaths worldwide to the effects of ambient air pollution in 2012 (WHO 2014). Air pollutants can either be gas phase species (e.g. ozone) or particulate matter. This study will focus solely on particulate matter air quality. Exposure to fine particulate matter (PM2.5) is responsible for ∼3.3 million deaths worldwide each year (Cohen et al 2005, Lelieveld et al 2015), with in excess of 400 000 premature deaths annually across Europe (EEA 2014). Particulate matter (also known as aerosols) also influences climate by altering the radiation budget at both the top of atmosphere (TOA) and surface (Boucher et al 2013). Aerosols scatter and absorb radiation, termed as aerosol radiation interactions (ari), and can also alter the properties of clouds, termed as aerosol cloud interactions (aci) (Boucher et al 2013). Both interactions caused a negative radiative forcing of the Earth's radiation budget over the industrial period resulting in a cooling effect on climate (IPCC 2013).
Europe and North America implemented legislation from the 1970s to reduce emissions of air pollutants (UNECE 2004). Emissions of sulphur dioxide (SO2) fell by 73% across Europe over the period 1980–2004 and by 70% in the United States from 1980 to 2010 (Vestreng et al 2007, US EPA 2011). Consequently, European surface concentrations of sulphate aerosol mass decreased by between 65% and 78% over the period 1980–2010 (Tørseth et al 2012, Turnock et al 2015). In addition to the beneficial health effects from improved air quality, such reductions in particulate matter will also have changed the regional radiative balance and climate (Turnock et al 2015).
The benefits to human health from reductions in anthropogenic emissions have been highlighted in a number of studies (Anenberg et al 2011, 2012, Shindell et al 2012). Reducing PM2.5 concentrations across more than 20 European cities to 15 μg m−3 was calculated to reduce the number of annual premature deaths by nearly 17 000 (Boldo et al 2006), with larger PM2.5 reductions to the WHO annual mean guideline value of 10 μg m−3 estimated to avoid 19 000 premature deaths (Pascal et al 2013). Considering specific emission reductions from power plants over the United States, Levy et al (2007) calculated that 17 000–21 000 annual premature deaths could be avoided. These studies highlight the large potential benefit to human health that can be achieved from reducing the emissions of air pollutants.
Policies that reduce anthropogenic emissions of aerosols may cause inadvertent impacts on climate (Andreae et al 2005, Arneth et al 2009, Fiore et al 2012, 2015, von Schneidemesser et al 2015). The air quality and climate impact of reductions in particulate matter depends on the contribution from purely scattering (sulphate) and more absorbing (black carbon (BC)) components (Shindell and Faluvegi 2009), as well as the complex interactions between aerosols and clouds.
Increased surface temperatures over Europe since the 1980s have been attributed to a combination of reductions in aerosols and increases in greenhouse gases (Ruckstuhl et al 2008, Philipona et al 2009). Increased surface radiation over Europe (solar brightening) has been observed since the 1980s across the continent (Wild 2009 and references within). This solar brightening was simulated in all of the Fifth Coupled Model Intercomparison Project (CMIP5) models from 1990 to 2005 and was attributed to a reduction in aerosol optical depth caused by decreases in sulphate aerosols (Cherian et al 2014). Changes to aerosols over Europe between the 1980s and 2000s are estimated to have led to a positive change in the TOA aerosol radiative effect (RE) of 1–2 W m−2 and increased surface radiation by 2 W m−2 (Marmer et al 2007, Pozzoli et al 2011). The associated changes in cloud albedo are estimated to have caused a positive change in the RE of 1.5 W m−2 over central Europe from the late 1980s to late 1990s (Krüger and Graβl 2002). In the United States, a reduction in anthropogenic aerosol precursor emissions between 1990 and 2010 coincided with REari and REaci decreasing by 0.8 W m−2 and 1.0 W m−2 respectively (Leibensperger et al 2012a). The observed rapid warming over this period of 0.5 °C was potentially attributed in part to a reduction in anthropogenic aerosols (Leibensperger et al 2012b). Gan et al (2014) analysed the effect of air pollution controls in the US and found that an increase in the surface shortwave radiation occurred over the same time period as negative trends in AOD and PM2.5.
Previous studies have assessed the impact of changes in historical (Colette et al 2011, Koch et al 2011, Turnock et al 2015) and future emissions (Kloster et al 2008, Unger et al 2008, Colette et al 2013) on air quality and climate. Changes in historical emissions have resulted from the combined effects of legislation, abatement technology, economic situation and makeup of the national energy supply (Vestreng et al 2007). However, it is not known what fraction of the changes in historical emissions and associated impacts on air quality, climate and human health can be attributed to the implementation of legislation and technological developments. Such studies are needed to understand the efficacy of historical policy. In recent work, Crippa et al (2015) studied the impact of historical European air pollution mitigation measures on emissions of SO2, BC and organic carbon (OC). They found that emissions of SO2 and PM2.5 in 2010 would have been substantially higher over Europe if technology improvements and end of pipe abatement measures had not been implemented since 1970.
Here we use emissions scenarios from Crippa et al (2015), combined with a global composition climate model to assess the effect of historical legislative and technology measures on particulate matter air quality, climate and human health. The effect of these emission changes on ozone concentrations will be the subject of a future study. The achievements from past policy initiatives are highlighted and will aid in the design of future emission mitigation measures to improve air quality and climate across other regions of the globe.
2. Methods
2.1. HadGEM3-UKCA composition-climate model
We used the composition-climate model HadGEM3-UKCA, as described in Turnock et al (2015), to simulate surface aerosol mass concentrations as well as the impact on aerosol REs. HadGEM3-UKCA is similar in complexity to other models that have participated in the Atmospheric Chemistry and Climate Model Intercomparison Project (ACCMIP, (Lamarque et al 2013)) and the AeroCom initiative (Mann et al 2014). Simulations had a horizontal resolution of 1.875° by 1.275° (∼140 km at mid latitudes). Our previous work has demonstrated that HadGEM3-UKCA is able to capture the regional changes in annual mean surface aerosol mass concentrations and surface solar radiation observed over Europe in response to changes in anthropogenic emissions during the period 1980–2010 (Turnock et al 2015). Our simulations therefore capture regional changes in PM2.5 (at the scale of ∼100 km) and are suitable for isolating the effects of policy driven changes in regional aerosol precursor emissions. Our model underestimates PM2.5 concentrations in urban areas; we estimate the impact of this in section 2.3. Further details on the model description and experimental set-up are in supplementary methods section 1.
2.2. Anthropogenic emission scenarios
Monthly mean anthropogenic emissions of CO, SO2, NOX, NMVOC, OC and BC are based on version v4.3 of the Emission Database for Global Atmospheric Research (EDGAR) (EC-JRC/PBL 2015). The emissions used in this study are described in Crippa et al (2015) and are summarised below. Emission fields are provided at 0.5° by 0.5° resolution for the energy, industry, transport, agriculture, residential, waste and other sources sectors (http://edgar.jrc.ec.europa.eu/pegasos).
We compare two simulations with different anthropogenic emissions. All other factors in the model are the same. The reference simulation (REF) uses actual 2010 emissions. The NO-AQ simulation uses anthropogenic emissions that would have occurred in 2010 if measures to reduce air pollutant emissions between 1970 and 2010 did not occur. The NO-AQ scenario is based on 2010 economic activity data but assumes 1970 emission factors to simulate the stagnation of technological improvements in the energy, industry and road transport sectors. It also assumes that no further end-of-pipe abatement measures (e.g., particle filter traps, fuel desulphurisation) occurred in the energy and road transportation sectors after 1970 (Crippa et al 2015). The NO-AQ scenario does however account for changes in the makeup of the national energy supply (e.g. coal to gas) that occurred without specific legislation. These assumptions alter emissions globally, since stagnation of technology improvements are applied globally and some European emission standards are used outside Europe (Crippa et al 2016). However, we focus on the impact of these measures over Europe (defined here as the domain 10°W–36°E and 36°N–61°N).
Figures 1(a)–(c) shows the spatial distribution of the difference in emissions between the two scenarios (REF minus NO-AQ). This difference represents the emissions that were averted in 2010 due to the implementation of technology improvements and end-of-pipe abatement measures. The largest difference in emissions occurs over central and eastern Europe and the UK. Total European SO2, BC and OC emissions over all sectors are reduced, compared to what would have occurred, by 9.4 Tg SO2 yr−1 (53%), 0.4 Tg BC yr−1 (59%) and 0.3 Tg OC yr−1 (32%) (figure 1(d)). Reductions in SO2 emissions are dominated by changes in the energy sector, whereas reductions in BC and OC are dominated by changes in the transport sector (table S1).
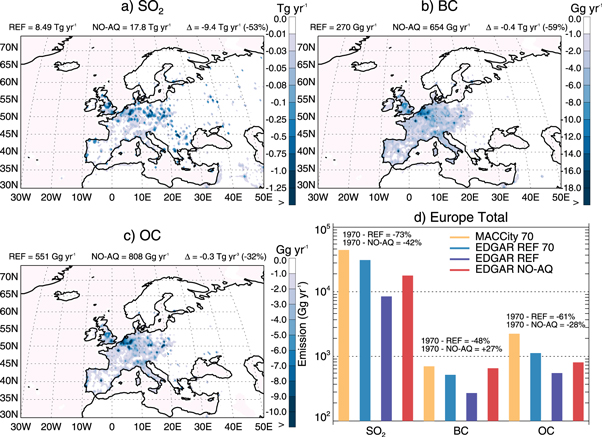
Figure 1. The impact of European air quality mitigation on annual mean emissions of (a) sulphur dioxide (SO2) (b) black carbon (BC), (c) organic carbon (OC). The impact is shown as the difference between the 2010 REF emissions and the NO-AQ emission scenario, calculated as the total of the energy, industry and road transportation sectors. Panel (d) shows the total European emissions (10°W–36°E, 36°N–61°N) in each scenario, as well as those in 1970 from the MACCity and EDGAR inventories. The totals from the NO-AQ and REF scenarios along with the difference between each are also displayed above panels (a)–(c). Within panel (d) the values refer to the percentage difference in the European total emissions of each species between EDGAR REF 1970 and each of the 2010 REF and NO-AQ scenario.
Download figure:
Standard image High-resolution imageFigure 1(d) compares total European emissions in the NO-AQ scenario against the actual 2010 (REF) and 1970 emissions from the EDGAR and MACCity inventories. The emissions of SO2 and OC in both the 2010 REF and NO-AQ scenarios are lower than emissions in 1970. In contrast, BC emissions from the 2010 NO-AQ scenario are larger than in 1970 but are lower in the 2010 REF scenario. This suggests that in the absence of technological improvements and end-of-pipe abatement measures, emissions of SO2 and OC would still have declined substantially due to changes in the makeup of the energy supply and consumption rates whereas emissions of BC would have been larger than in 1970. This highlights the large impact of legislation and technological improvements on reducing BC emissions compared to SO2 and OC and that historical changes to anthropogenic emissions are determined by the combined effect of legislation, technology and economic factors.
2.3. Human health and economic impacts
Concentration response functions (CRFs) for long-term exposure to PM2.5 have been used here to quantify the adverse health effects in terms of excess premature mortality from ischemic heart disease, stroke, chronic obstructive pulmonary disease, lung cancer and acute lower respiratory infection in infants. Here, the link between PM2.5 concentrations and relative risk of the above diseases is based on the integrated exposure-response functions developed by Burnett et al (2014), which also uses the baseline rate of disease and spatial distribution of the population.
The resolution of global aerosol models means that they typically underestimate urban PM2.5 concentrations. To estimate the impact of this underestimation on simulated human health impacts, we complete another calculation where we increase the PM2.5 concentrations in European urban areas in both the REF and NO-AQ simulations. We then apply the CRFs to these modified concentrations. We estimate that the underprediction of PM2.5 in urban areas in our global model (Turnock et al 2015) causes an bias in our mortality estimates of 13%–16%, substantially less than the uncertainty in the CRF (see supplementary methods). Our method is outlined fully in supplementary methods section 2.
The impact on human health from poor air quality can also have a perceived economic effect on society. The methods and data within WHO Regional Office for Europe (2015) have been used to calculate the perceived economic benefit to society that result from the health benefits associated with the reduction in particulate matter concentrations due to the implementation of air pollution mitigation measures (see supplementary methods section 3).
2.4. Climate response
Based on the climate response to regional radiative forcing (Shindell and Faluvegi 2009), and the atmospheric energy budget (Andrews et al 2010, Richardson et al 2015), we estimate the temperature and precipitation response due to changes in the radiative balance from the implementation of air pollutant (particulate matter) mitigation measures (see supplementary methods section 4).
3. Results and discussion
3.1. Effects on air quality
Figure 2 shows the simulated change in surface annual mean PM2.5 concentrations due to the implementation of European air pollutant emission reduction measures (REF versus NO-AQ simulations). European average concentrations are calculated as the 5 year annual mean (±standard deviation) over the continental land mass within the domain 10°W–36°E and 36°N–61°N. Across Europe, annual mean PM2.5 concentrations reduce by 1.75 ± 0.04 μg m−3 (35%), sulphate by 1.1 ± 0.03 μg m−3 (44%), BC by 0.27 ± 0.01 μg m−3 (56%) and particulate organic matter (POM) by 0.36 ± 0.01 μg m−3 (23%).

Figure 2. Percentage change in annual mean surface concentrations (averaged over 5 years) of (a) PM2.5, (b) sulphate, (c) black carbon (BC) and (d) particulate organic matter (POM) due to the mitigation of air pollution. Percentage changes are calculated as the difference between the REF and NO-AQ simulations relative to the latter simulation (i.e. REF-NOAQ/NOAQ). Stippling indicates regions where the difference is larger than the variability of the annual mean values (i.e. greater than two standard deviations of the annual mean). Above each panel we show the European mean concentrations (calculated as mean values over the continental land mass within the domain 10°W–36°E and 36°N–61°N) for each scenario along with the absolute and percentage change between simulations. We also detail the 1970–2009 simulated change in concentration from Turnock et al (2015).
Download figure:
Standard image High-resolution imageReductions in PM2.5 mass concentration of 40%–50% occur across much of central, eastern and parts of southern Europe (figure 2(a)). Sulphate mass concentrations decrease by more than 50% across most of central Europe and south eastern Europe (figure 2(b)), mainly due to the substantial decrease in SO2 emissions in these regions (figure 1(a)) that mostly occurs in the energy sector (table S1). The largest absolute reduction in sulphate mass concentrations (of >5 μg m−3) occurs in south-eastern Europe (figure S1). This is attributed to large reductions in SO2 emissions from the energy sector combined with atmospheric conditions that enhance the efficiency of sulphate formation (higher oxidant concentrations and temperatures than northern Europe). Reductions in BC mass concentrations of more than 70% occur across all of western Europe and Scandinavia (figure 2(c)), mainly due emissions reductions over Europe from the road transport sector (table S1). Fractional reductions in POM mass concentrations are typically less than 40% (figure 2(d)), despite a similar absolute reduction compared to BC (figure S1). The smaller fractional change in POM concentrations are due to the larger background concentrations of POM from natural emissions, which are the same in both simulations.
Legislative and technology measures have therefore led to reduced aerosol mass concentrations across Europe, with potential impacts for both regional climate and human health. We compared the change in aerosol concentration calculated due to these air quality mitigation measures against the change in aerosol concentrations that actually occurred over the period 1970–2009 simulated by Turnock et al (2015) using the same model. Using this method we estimate that air pollutant mitigation measures are responsible for 29% of the actual reductions in PM2.5 that occurred over the same period. Air pollutant mitigation contributes the most to changes in BC concentrations (73%) compared to sulphate (33%) or POM (15%). This difference reflects the different causes behind the changes in anthropogenic emissions and highlights the important effect of enacted European legislation on air quality.
Ammonium nitrate aerosol (absent from our simulations) has increased by 15%–30% over Europe since the 1980s due to the reduction in SO2 and sulphate aerosols (Fagerli and Aas 2008). The increase in ammonium nitrate aerosol concentrations would partially offset some of our simulated improvements to air quality and health but would not alter the overall net decrease in European mean particulate matter concentrations (1.75 μg m−3) due to the larger declines in sulphate (44%), BC (56%) and POM (23%) simulated here.
3.2. Health and economic effects
Figure 3 shows the impacts of improvements in regional air quality from air pollutant mitigation measures on public health. The simulated reduction in PM2.5 concentrations due to air pollutant mitigation measures reduces the number of premature deaths across Europe, with the largest numbers prevented across central Europe (Germany and The Netherlands) (figure 3(a)). Air pollutant mitigation measures prevent 3 to 4 premature deaths annually per 10 000 people in central and eastern Europe (figure 3(b)) and 5 to 6 premature deaths annually per 10 000 people in south eastern Europe (Romania and Bulgaria), where the largest reductions in PM2.5 occurred (figures 2(a) and S1(a)).
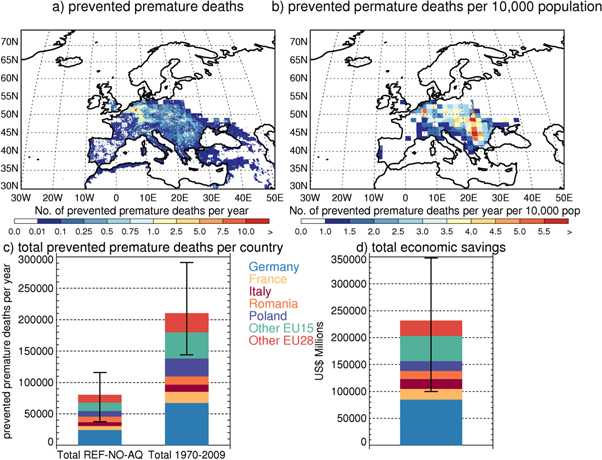
Figure 3. The impact of air quality mitigation measures on human health and perceived economic benefit in Europe. (a) Number of premature deaths prevented annually due to all causes of disease from the change in PM2.5 concentrations due to air quality mitigation (REF minus NO-AQ simulations). (b) Same as (a) but per 10 000 population. (c) Total number of premature deaths prevented for all causes of disease across the EU due to air quality mitigation compared to the reduction in premature deaths calculated due to the actual change in PM2.5 concentrations over the period 1970–2009 simulated by Turnock et al (2015) (error bars represent the 95% confidence intervals of the concentration response functions used for calculating total European annually prevented premature mortality). (d) The perceived economic benefit calculated for air quality mitigation from the number of deaths prevented annually across Europe. The error bars represent the economic savings calculated using the 95% confidence intervals of the total number of European annually prevented premature deaths.
Download figure:
Standard image High-resolution imageAcross all the European Union (EU), reductions in PM2.5 due to air pollutant mitigation measures prevented 80 250 (37 380–115 840, at 95% confidence intervals of the CRFs) premature deaths annually (individual country totals on figure 3(c) and table S2), which is 19% of the estimated premature deaths due to present-day (2011) PM2.5 concentrations across Europe.
We compared the improved public health due to these air quality mitigation measures against an estimate of the improved public health due to the actual change in PM2.5 concentrations that occurred over the same period. Using the change in simulated PM2.5 concentrations between 1970–74 and 2005–2009 from Turnock et al (2015), we estimate that 210 000 annual premature deaths were prevented over this period. Therefore European policies to reduce air pollutants and technological improvements can be considered responsible for ∼38% of the total number of premature deaths prevented due to the improved air quality across the EU from 1970 to 2009 (figure 3(c)).
We estimate that the improvement in human health from implementing air pollutant mitigation measures results in a perceived economic benefit to society of US$232 billion across the EU (individual country totals on figure 3(d) and table S3), 1.4% of the EU's GDP in 2010. In particular, the perceived economic benefits to society for some countries in eastern Europe, such as Hungary and Bulgaria, are relatively more important and represent a greater percentage of their national GDP (>5%). The WHO calculated that in 2010, premature mortality due to ambient concentrations of particulate matter was costing the EU US$700 billion, or 4% of the EU's GDP (WHO Regional Office for Europe 2015). We therefore suggest that the perceived economic costs of poor air quality would be 33% greater than they are currently if European legalisation and technological improvements had not been implemented.
3.3. Effects on climate
Table 1 shows the difference in European annual mean aerosol RE at the TOA and at the surface due to the implementation of the air pollutant emission mitigation measures. The reduction of aerosol concentrations in the atmosphere over Europe (figure 2) causes a positive change in the aerosol RE at the TOA, reduces the atmospheric absorption of radiation (mainly due to reductions in BC) and also increases the shortwave radiation incident at the surface. The annual European mean all-sky aerosol RE at the TOA increases by 2.3 ± 0.06 W m−2 with clear-sky TOA radiation increasing by 1.7 ± 0.05 W m−2. The shortwave radiation incident at the surface increases under both all-sky (3.3 ± 0.07 W m−2) and clear-sky conditions (2.7 ± 0.05 W m−2). Air pollutant mitigation measures have reduced atmospheric absorption of radiation over Europe by ∼1 W m−2 in both all-sky and clear-sky conditions (table 1 and figure 4) due to the large reductions in BC aerosols. Our model shows that air pollution mitigation has resulted in a warming effect on climate compared to what would have occurred, dominated by changes in the direct aerosol RE (clear-sky). This occurs from a combination of warming due to reductions in scattering aerosols (sulphate and POM) and the cooling response from the reduction in absorbing BC aerosols.
Table 1. Changes in the European annual mean all-sky aerosol radiative effects due to air pollutant mitigation measures. Clear-sky and cloudy-sky RE at the TOA and surface between the REF and NO-AQ simulations over the European continental land mass within the domain 10°W–36°E and 36°N–61°N. Values in parentheses are changes over the period 1970–2009 from Turnock et al (2015).
| All sky (W m−2) | Clear sky (W m−2) | Cloudy sky (W m−2) | |
|---|---|---|---|
| TOA | 2.26 (3.1) | 1.67 (2.0) | 0.59 (1.1) |
| Surface | 3.30 | 2.70 | 0.60 |
| Atmosphere | −1.04 | −1.03 | −0.01 |
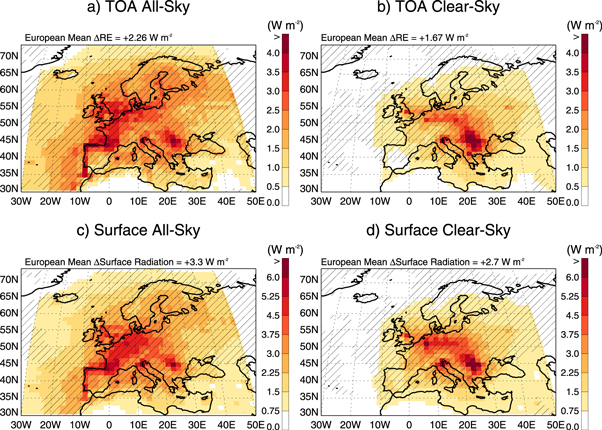
Figure 4. Difference between the REF and NO-AQ simulations in annual mean (average over 5 years) aerosol radiative effect at the top of atmosphere for (a) all-sky and (b) clear-sky conditions and incident surface solar radiation for (c) all-sky and (d) clear-sky conditions. Stippling indicates regions where the difference is larger than the variability of the annual mean values (i.e. greater than two standard deviations of the annual mean). European mean concentrations for each scenario are calculated as mean values over the continental land mass within the domain (10°W–36°E and 36°N–61°N, with the change between the two simulations shown above each panel.
Download figure:
Standard image High-resolution image
We can compare the change in aerosol RE calculated here against an estimate of the RE that actually occurred over the period 1970–2009 (table 1). In transient simulations with historical emissions, Turnock et al (2015) estimated that the annual European mean all-sky aerosol RE increased by 3.1 W m−2 between 1970 and 2009. The larger change in RE over the period 1970–2009 reflects the similar changes in BC but larger reductions in sulphate and POM that occurred in reality. Therefore our model simulations show that European legislation and technological improvements to reduce air pollutants are responsible for approximately 74% of the change in all-sky TOA aerosol RE from the 1970s to present day.
Over the 20th Century nitrate aerosols (not present within our model) were shown by Bellouin et al (2011) to have had a relatively small impact on the negative global aerosol forcing, enhancing it by less than 20%. The calculated changes in aerosol REs in this study will have been overestimated due to the absence of the negative aerosol REs from ammonium nitrate.
Figure 4 shows the spatial pattern of changes to the aerosol RE at the TOA and at the surface. The largest increase in TOA clear-sky aerosol RE occurs over south-east and central Europe (figure 4(b)), corresponding with the largest reduction in sulphate mass (figures 2(b) and S1). The largest reductions in atmospheric absorption (TOA minus surface) occur over The Netherlands and Germany where the largest reductions in BC aerosols occurs (figure 2(c)). The TOA warming response over these areas would have been even larger without the reductions of the absorbing BC aerosols (cooling response).
The all-sky changes are also caused by changes to cloud properties (aci). Air pollution mitigation reduces concentrations of cloud condensation nuclei (CCN) (figure S3(a)) leading to larger, less numerous cloud droplets (figure S3(b)), increasing shortwave all-sky radiation at the TOA and surface (figures 4(a) and (c)). Air pollutant mitigation causes the largest increase in all-sky radiation (both TOA and surface) over coastal areas of western Europe (figures 4(a) and (c)), corresponding with the largest reduction in CCN, cloud droplet number concentrations and larger cloud fractions (figures S3 and S4). Over central Europe, CCN and cloud drop concentrations are larger (shown by larger total number concentrations in figure S2), meaning air pollutant mitigation causes smaller fractional changes and a smaller RE here. The difference between all-sky and clear-sky radiation changes (figure S3(d)) gives an indication of the cloudy sky RE, which is greatest over north west Europe.
Overall reductions in aerosols from the implementation of air pollutant mitigation measures resulted in a positive change in the aerosol RE at the TOA and also increased the amount of solar radiation incident at the surface under both all-sky and clear-sky conditions. The simulated change in European all-sky TOA aerosol RE due to air pollutant mitigation is 2.5 times the change in global mean CO2 radiative forcing over the period 1970–2009 (Myhre et al 2013), indicating the large regional impact of air pollutant mitigation measures. Such changes to the radiative balance over Europe could have non-negligible effects on the climate, impacting both surface temperature and precipitation patterns.
Using the change in TOA aerosol RE between the two simulations, we estimate that the reduction in particulate matter from the implementation of air pollutant mitigation measures have increased European mean surface temperatures by 0.45 ± 0.11 °C compared to temperatures that would have occurred without mitigation measures (for methods see section 4 of supplementary methods). This change in European surface temperature is anticipated to be slightly smaller than that presented here due to the absence of ammonium nitrate from the simulations. In addition, the reduced atmospheric absorption of radiation caused by mitigation measures will induce a rapid adjustment to increase European precipitation by 13 ± 0.8 mm yr−1. Future work is needed to contrast the human health and economic costs associated with these changes in climate against those quantified here due to air quality improvements.
4. Conclusions
Air quality legislation and technology improvements implemented over Europe have reduced the emission of air pollutants. Here we used a coupled composition-climate model to assess the impact of these reduced emissions on air quality, human health and the Earth's radiative balance.
We used two simulations to quantify the impact of air pollutant mitigation measures on emissions across the energy, industry and road transport sectors over the period 1970–2010 (Crippa et al 2015). One simulation used actual 2010 emissions whereas the other simulation used a 2010 emission scenario in which air pollutant mitigation measures were not implemented, represented by the absence of improvements to end-of-pipe abatement measures and technology between 1970 and 2010. The implementation of these air pollutant mitigation measures is estimated to have reduced European anthropogenic emissions of SO2 (53%), BC (59%) and OC (32%) compared to what would have occurred in the absence of legislative and technology measures.
We estimate that this reduction in emissions improved regional air quality over Europe by reducing concentrations of fine particulate matter (PM2.5 by 35%) and their component masses (sulphate by 44%, BC by 56% and POM by 23%). We estimate that these policy measures and technology changes are responsible for ∼29% of the actual reductions in PM2.5 that occurred from 1970 to 2009.
The improvement in air quality from the implementation of European air pollutant mitigation measures has benefitted human health by preventing 80 000 premature deaths (37 000–116 000, at 95% confidence intervals of the CRF) annually across Europe. These improvements to health have had a perceived economic benefit to society estimated to be US$232 billion annually, representing 1.4% of the EU's GDP in 2010.
The spatial resolution of our global model (∼140 km) means that our results apply to regional changes in PM2.5. For this reason our model typically underestimates PM2.5 concentrations in urban areas of Europe, leading to a ∼15% bias in our premature mortality estimates (based on calculations where we adjust simulated PM2.5 concentrations in urban areas to match observed concentrations). This error is substantially smaller than the factor 3 uncertainty in estimated premature mortality calculated using the 95% confidence intervals of the CRF. Better understanding of the health impacts of PM2.5, in addition to studies using higher resolution models would improve future calculations of the impact of air pollutants on human health.
Changes in fine particulate matter concentrations from measures to reduce air pollutants can have an unintended impact on climate by altering the radiative balance. The reduction in aerosol concentrations has caused a positive change to the all-sky aerosol RE at the TOA (2 W m−2), reduced the absorption of radiation in the atmosphere (−1 W m−2) and increased the amount of shortwave radiation incident at the surface (3 W m−2). Changes are largest over central and eastern Europe for clear sky conditions, indicating that aerosol radiation interactions are dominant here, but for all-sky conditions the changes are largest over western Europe, signifying that aerosol cloud interactions are more important here.
We have estimated that these changes in the radiative balance from air pollutant mitigation measures would have caused European mean surface temperatures to increase by ∼0.45 ± 0.11 °C and precipitation by ∼13 ± 0.8 mm yr−1 compared to those that would have occurred without mitigation measures.
Implementing measures to reduce emissions of air pollutants has led to an improvement in air quality and reduced the impact on human health over Europe. However, the reduction in aerosol concentrations has also had an unintended warming (positive) response on the Earth's radiative balance. The calculated effect on air quality, climate and human health from European legislation and technological improvements implemented over the last 40 years should be used to help inform the design of future multi-pollutant mitigation strategies.
Acknowledgments
Steven Turnock would like to thank the Natural Environment Research Council (NERC) and Met Office for providing the funding for this PhD studentship. This work was also made possible by participation in the EU Framework 7 PEGASOS project (no: 265148). We acknowledge the use of the MONSooN system, a collaborative facility supplied under the Joint Weather and Climate Research Programme, a strategic partnership between the Met Office and NERC. We would like to acknowledge the use of the EDGAR anthropogenic emissions inventory and the scenarios used in this study provided by the Joint Research Centre, Italy. Edward Butt is funded by the United Bank of Carbon.